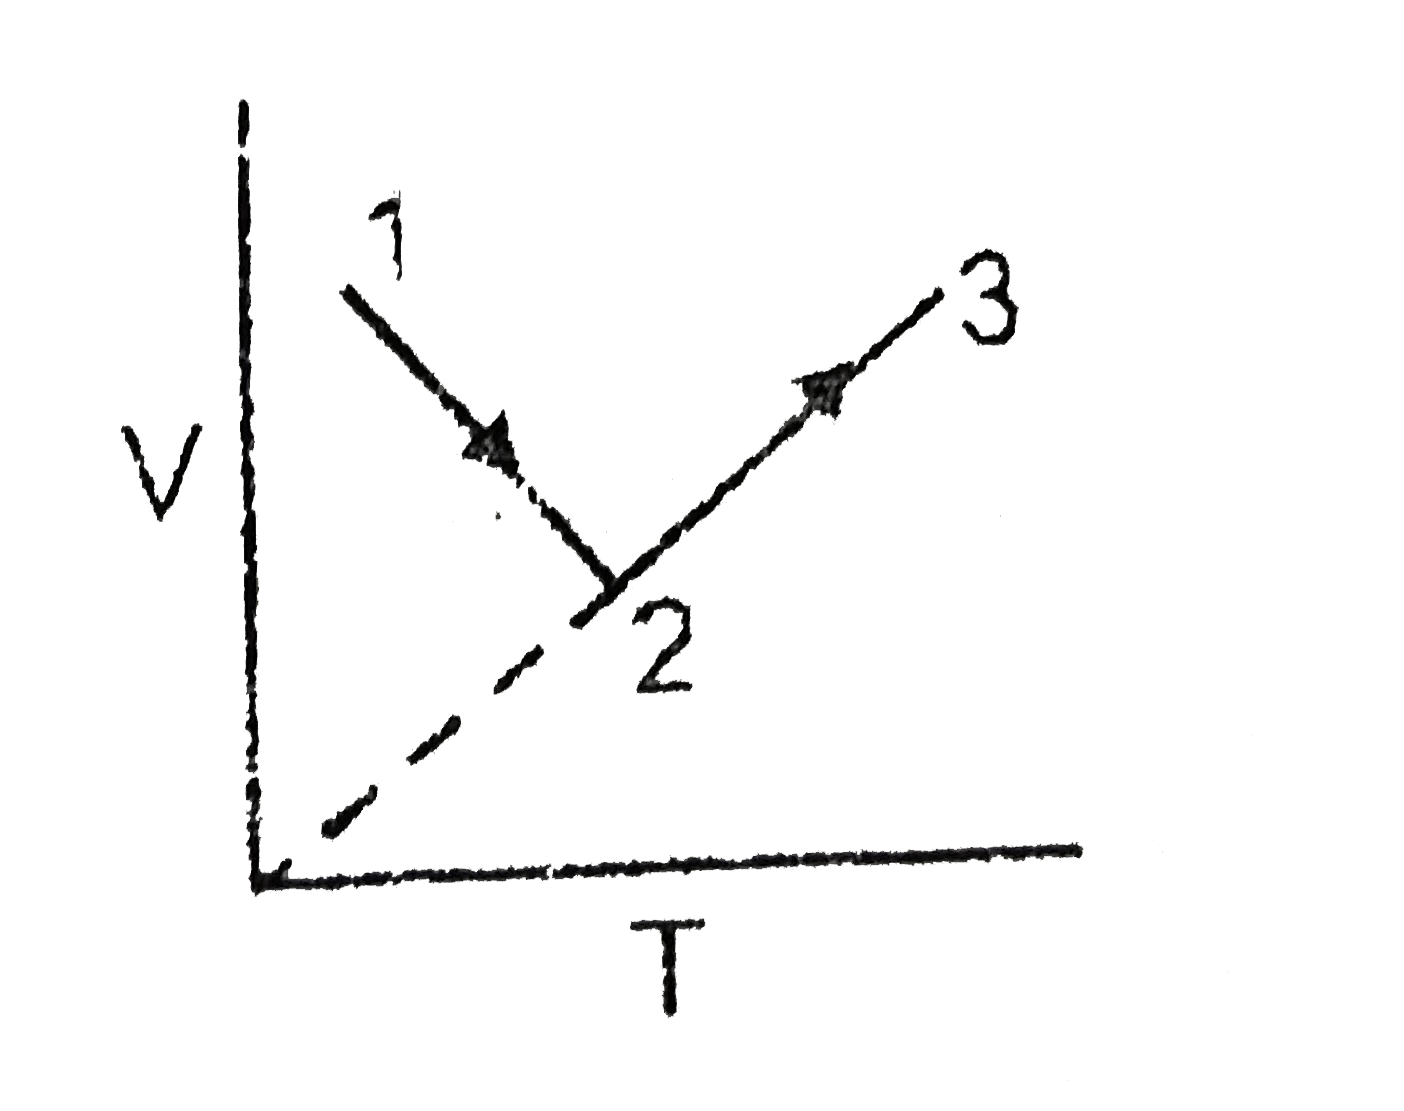
Draw a graph of logP and log(1/V) for a fixed amount of gas at constant temperature.
To draw a graph of logP versus log(1V) for a fixed amount of gas at constant temperature, we can follow these steps:
1. Start with the Ideal Gas Equation:
The ideal gas law is given by the equation:
PV=nRT
where P is pressure, V is volume, n is the number of moles, R is the gas constant, and T is the temperature.
2. Rearrange the Equation:
For a fixed amount of gas at constant temperature, we can rearrange the ideal gas equation to express pressure P in terms of volume V:
P=nRTV
Here, nRT is a constant (let's call it K):
P=KV
3. Express Pressure in Terms of Volume:
From the equation P=KV, we can express this as:
P=K⋅(1/V)
4. Take Logarithms:
Taking the logarithm of both sides gives us:
logP=logK+log(1V)
5. Identify the Linear Relationship:
This can be rearranged to:
logP=log(1V)+logK
This resembles the equation of a straight line y=mx+c, where:
- y=logP
- x=log(1V)
- m=1 (slope)
- c=logK (y-intercept)
6. Plot the Graph:
On the graph:
- The x-axis will represent log(1V).
- The y-axis will represent logP.
- The graph will be a straight line with a slope of 1 and a y-intercept at logK.
Graph Characteristics:
- The graph does not start from the origin due to the y-intercept logK.
- The slope of the line is 1, indicating a direct proportionality between logP and log(1/V).
The ideal gas law is given by the equation:
PV=nRT
where P is pressure, V is volume, n is the number of moles, R is the gas constant, and T is the temperature.
For a fixed amount of gas at constant temperature, we can rearrange the ideal gas equation to express pressure P in terms of volume V:
P=nRTV
Here, nRT is a constant (let's call it K):
P=KV
From the equation P=KV, we can express this as:
P=K⋅(1/V)
Taking the logarithm of both sides gives us:
logP=logK+log(1V)
This can be rearranged to:
logP=log(1V)+logK
This resembles the equation of a straight line y=mx+c, where:
- y=logP
- x=log(1V)
- m=1 (slope)
- c=logK (y-intercept)
On the graph:
- The x-axis will represent log(1V).
- The y-axis will represent logP.
- The graph will be a straight line with a slope of 1 and a y-intercept at logK.
- The graph does not start from the origin due to the y-intercept logK.
- The slope of the line is 1, indicating a direct proportionality between logP and log(1/V).
Topper's Solved these Questions
- STATES OF MATTERBOOK - CENGAGE CHEMISTRY ENGLISHCHAPTER - STATES OF MATTEREXERCISE - Illustration
2 Videos
- STATES OF MATTERBOOK - CENGAGE CHEMISTRY ENGLISHCHAPTER - STATES OF MATTEREXERCISE - Exercises
21 Videos
- SOME BASIC CONCEPTS AND MOLE CONCEPTBOOK - CENGAGE CHEMISTRY ENGLISHCHAPTER - SOME BASIC CONCEPTS AND MOLE CONCEPTEXERCISE - Archives Subjective
11 Videos
- STOICHIOMETRYBOOK - CENGAGE CHEMISTRY ENGLISHCHAPTER - STOICHIOMETRYEXERCISE - Archives Subjective
33 Videos
Similar Questions
Draw a graph of log P vs log (1/V) for a fixed amount of a gas at constant temperature.
View SolutionDraw the graph of y=log2x.
View SolutionDraw the graph of y=x/ln x
View SolutionDraw the graph of y=−logex.
View SolutionWhat is the type of graph between log P and log(1V) at constant temperature for a given amount of gas ?
View SolutionDraw the plot log P vs log V for Boyle's law.
View SolutionDraw the graph of y=logx√x
View SolutionDraw the graph of y=loge(sinx).
View SolutionFollowing graph is constructed for the fixed amount of the gas

View SolutionWhich of the following graphs correctly represents the variation of β=−(dVdP)/V with P for an ideal gas at constant temperature
View Solution
