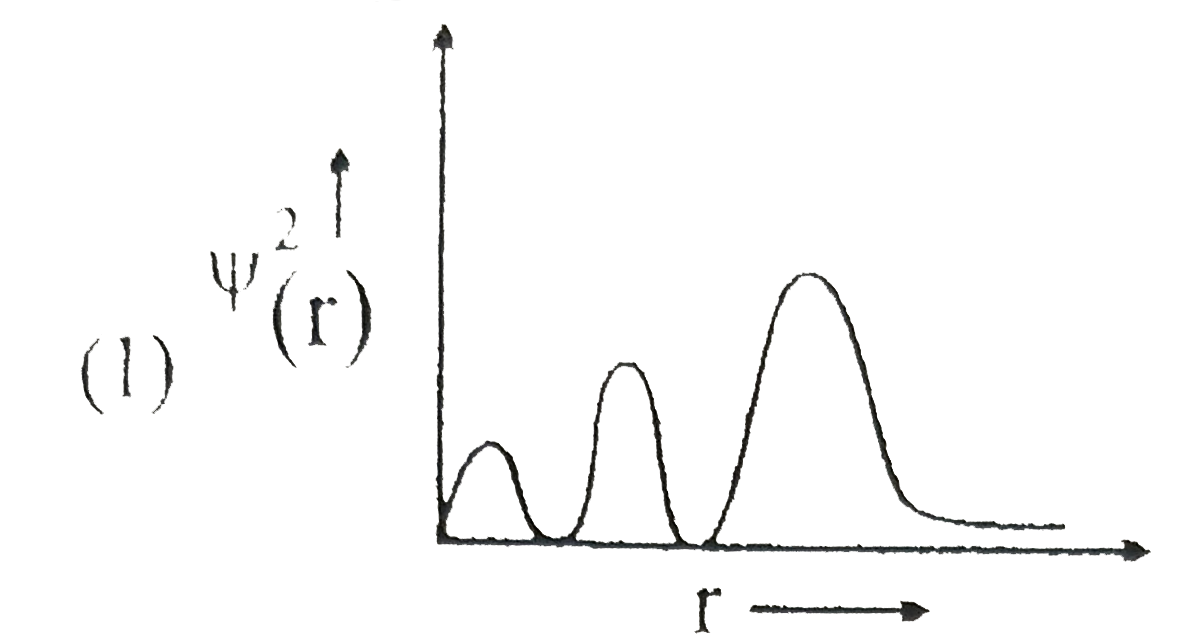
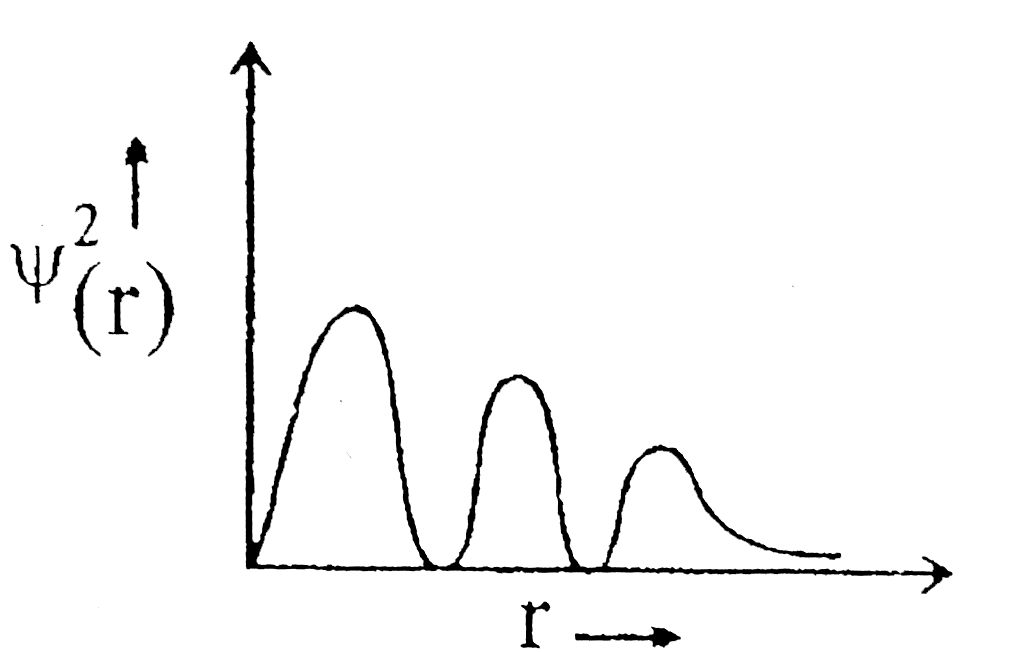
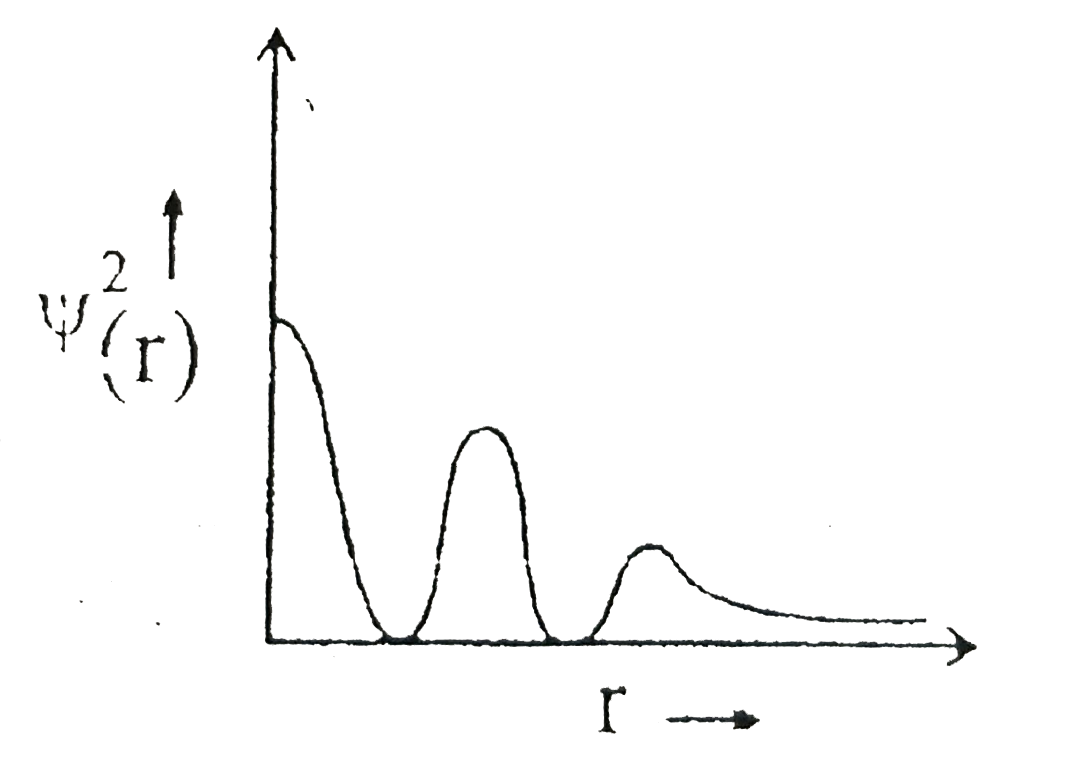
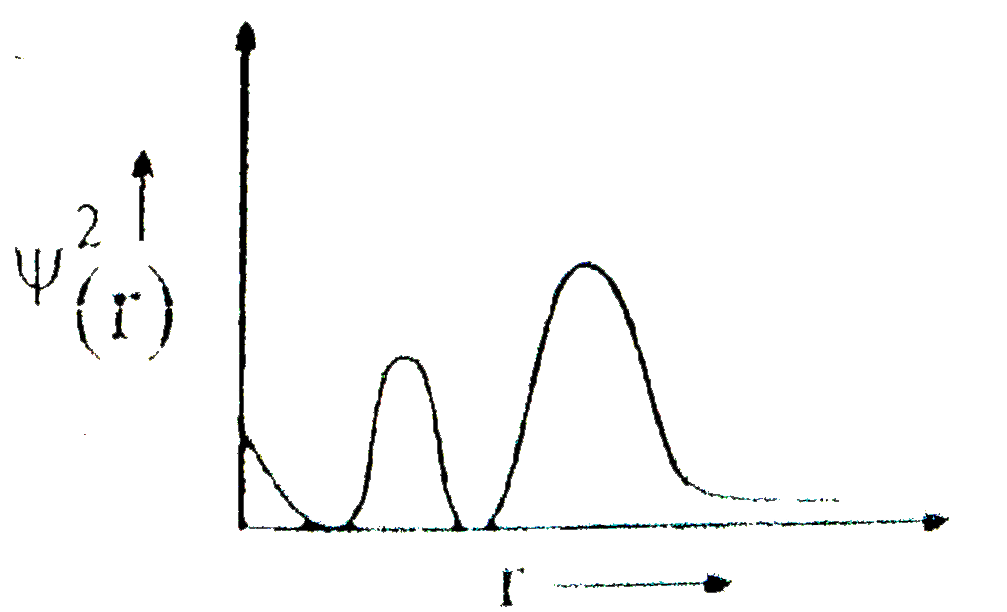
Which of the following is correct graph between Probability density sπ2(r) vs radial distance of electron (r) form nucleus for 3 s ?
A
B
C
D
Text Solution
The correct Answer is:C
Height of maxima decreases in radial probability density curve.
|
Topper's Solved these Questions
- TEST PAPERSBOOK - BANSALCHAPTER - TEST PAPERSEXERCISE - CHEMISTRY PART (A)
14 Videos
- TEST PAPERSBOOK - BANSALCHAPTER - TEST PAPERSEXERCISE - CHEMISTRY PART (B)
1 Videos
- TEST PAPERSBOOK - BANSALCHAPTER - TEST PAPERSEXERCISE - Chemistry PART D
4 Videos
- SOLUTIONSBOOK - BANSALCHAPTER - SOLUTIONSEXERCISE - Exercise4
32 Videos
- THERMOCHEMISTRYBOOK - BANSALCHAPTER - THERMOCHEMISTRYEXERCISE - Exercise 4
15 Videos
Similar Questions
Knowledge Check
The following graph between Ψ2 probability density and distance from the nucleus represents -
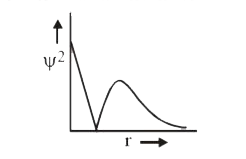 A2sB3sC1sD4p
Which of the following graphs between radial probability distribution and radius of atom corresponding to 4s-orbital
(n=4,l=0) is correct?A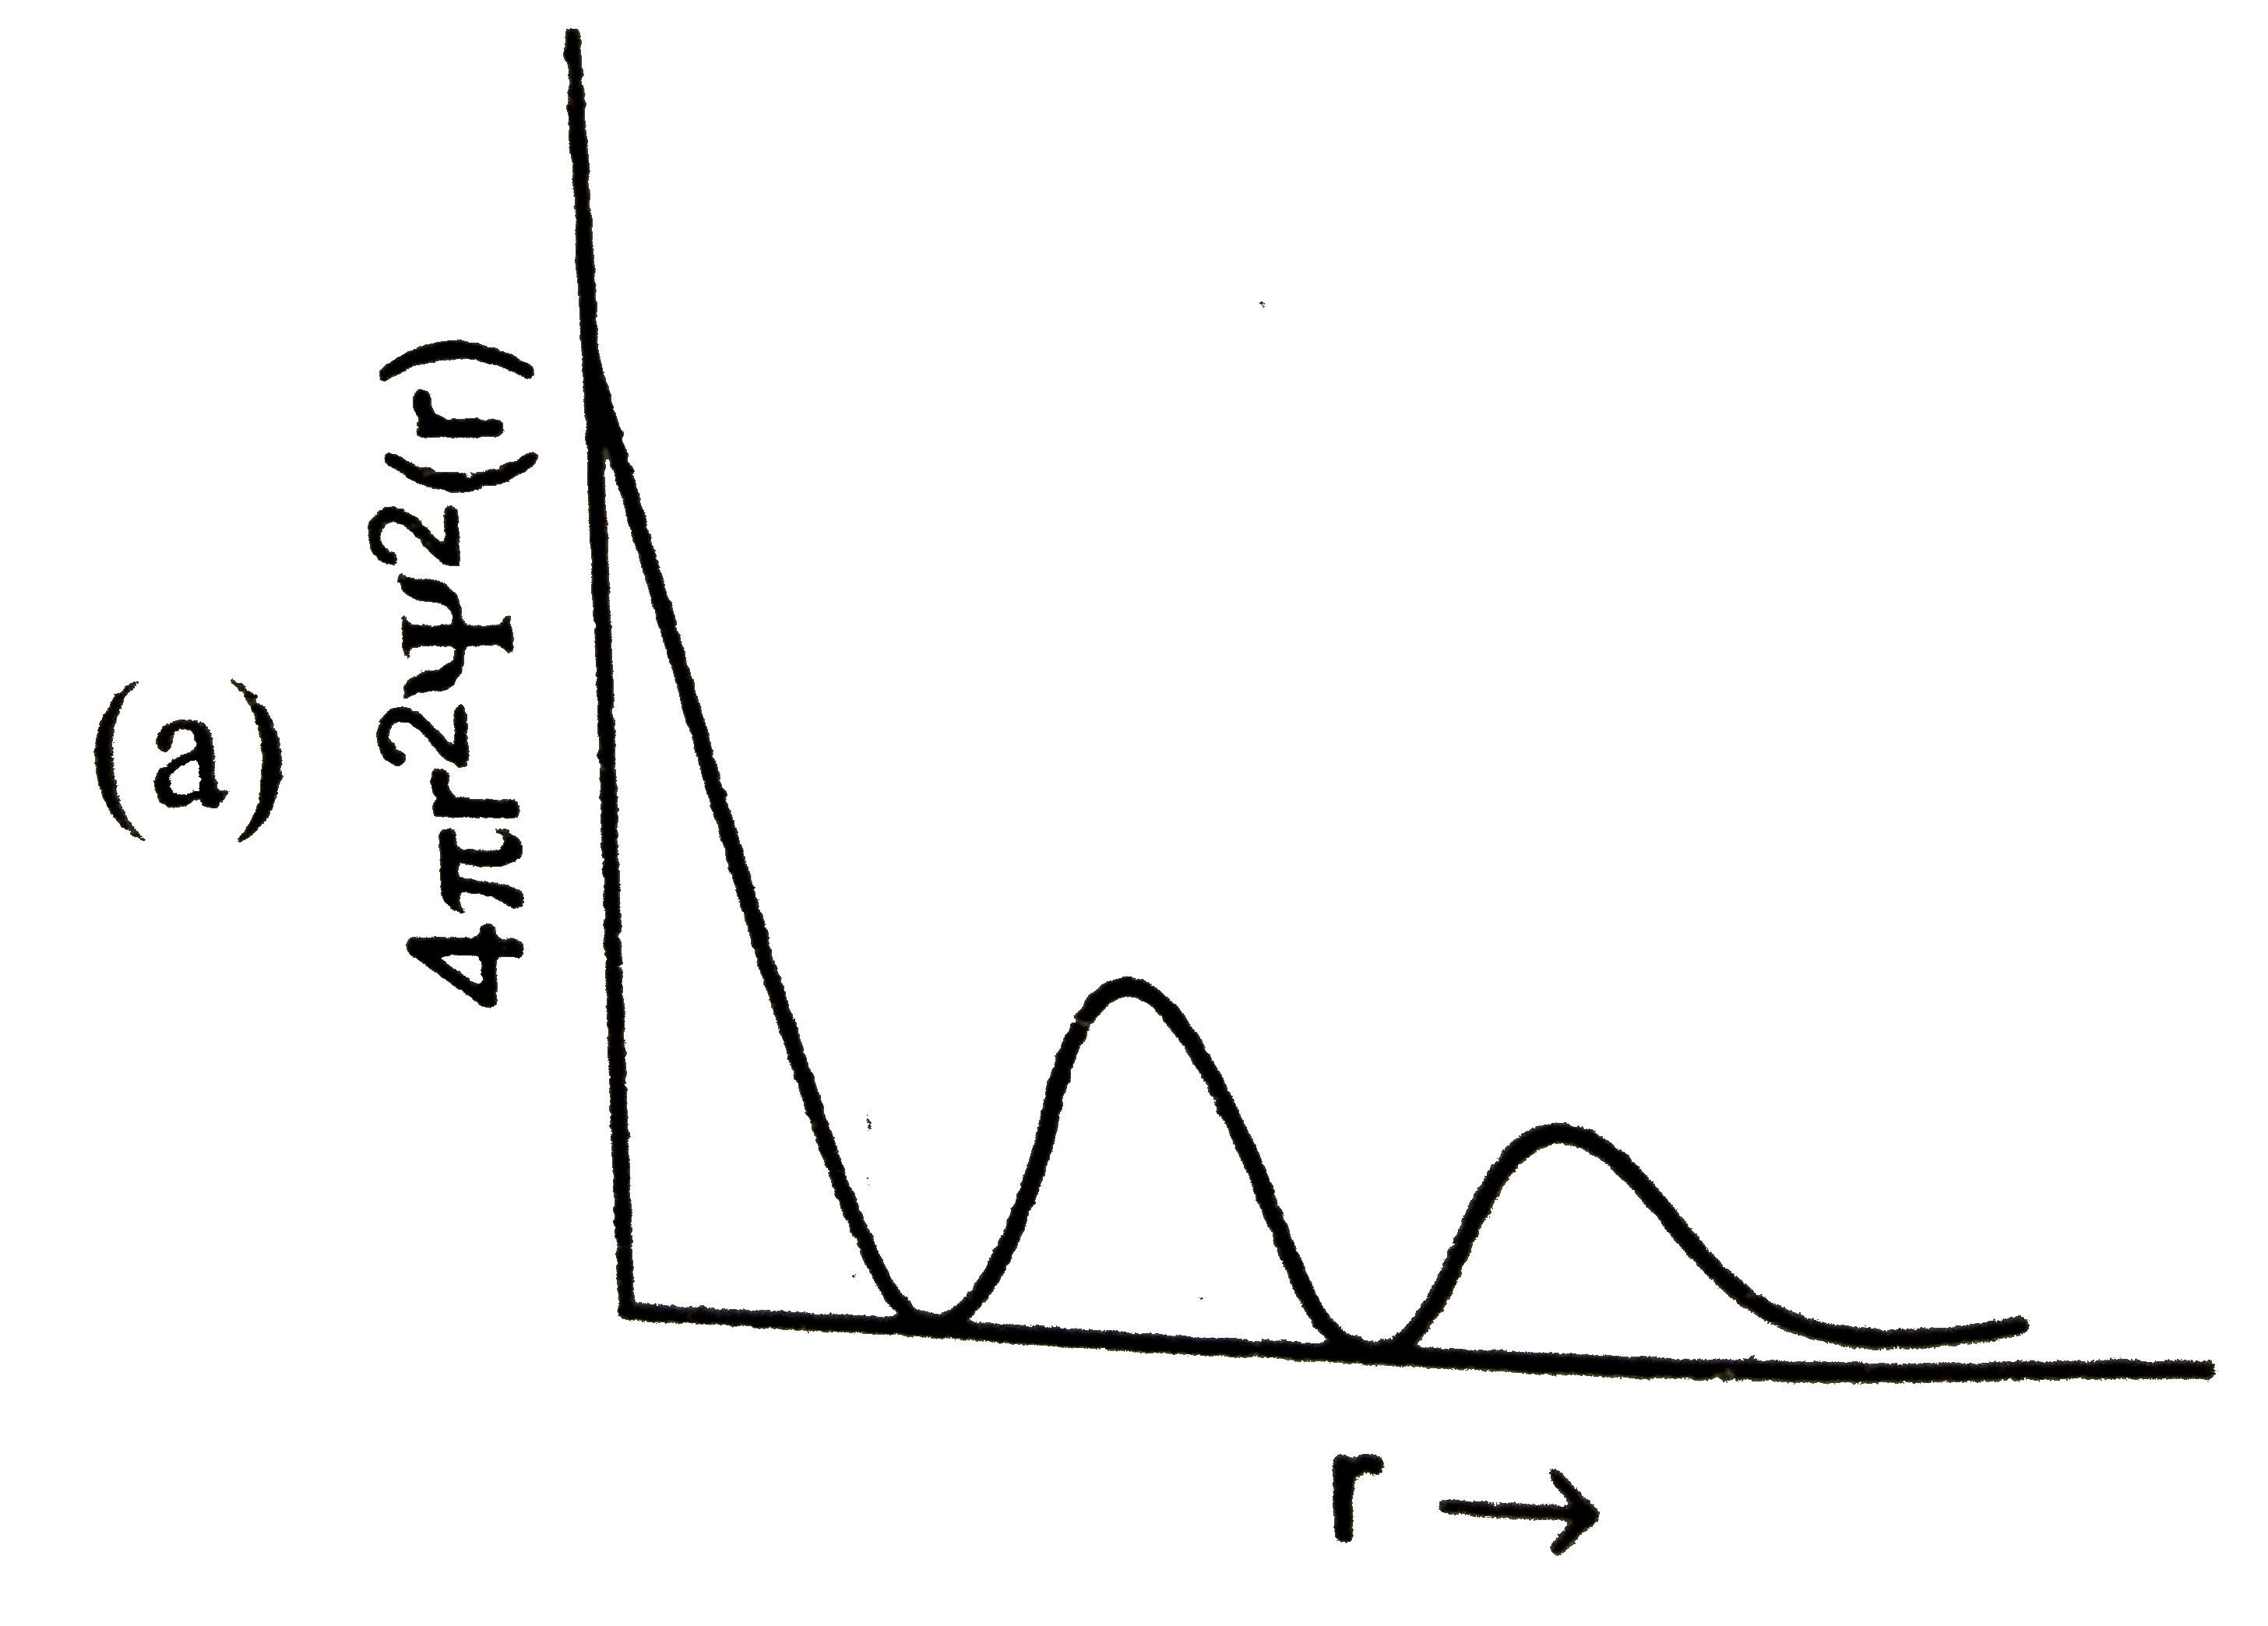 B
B C
C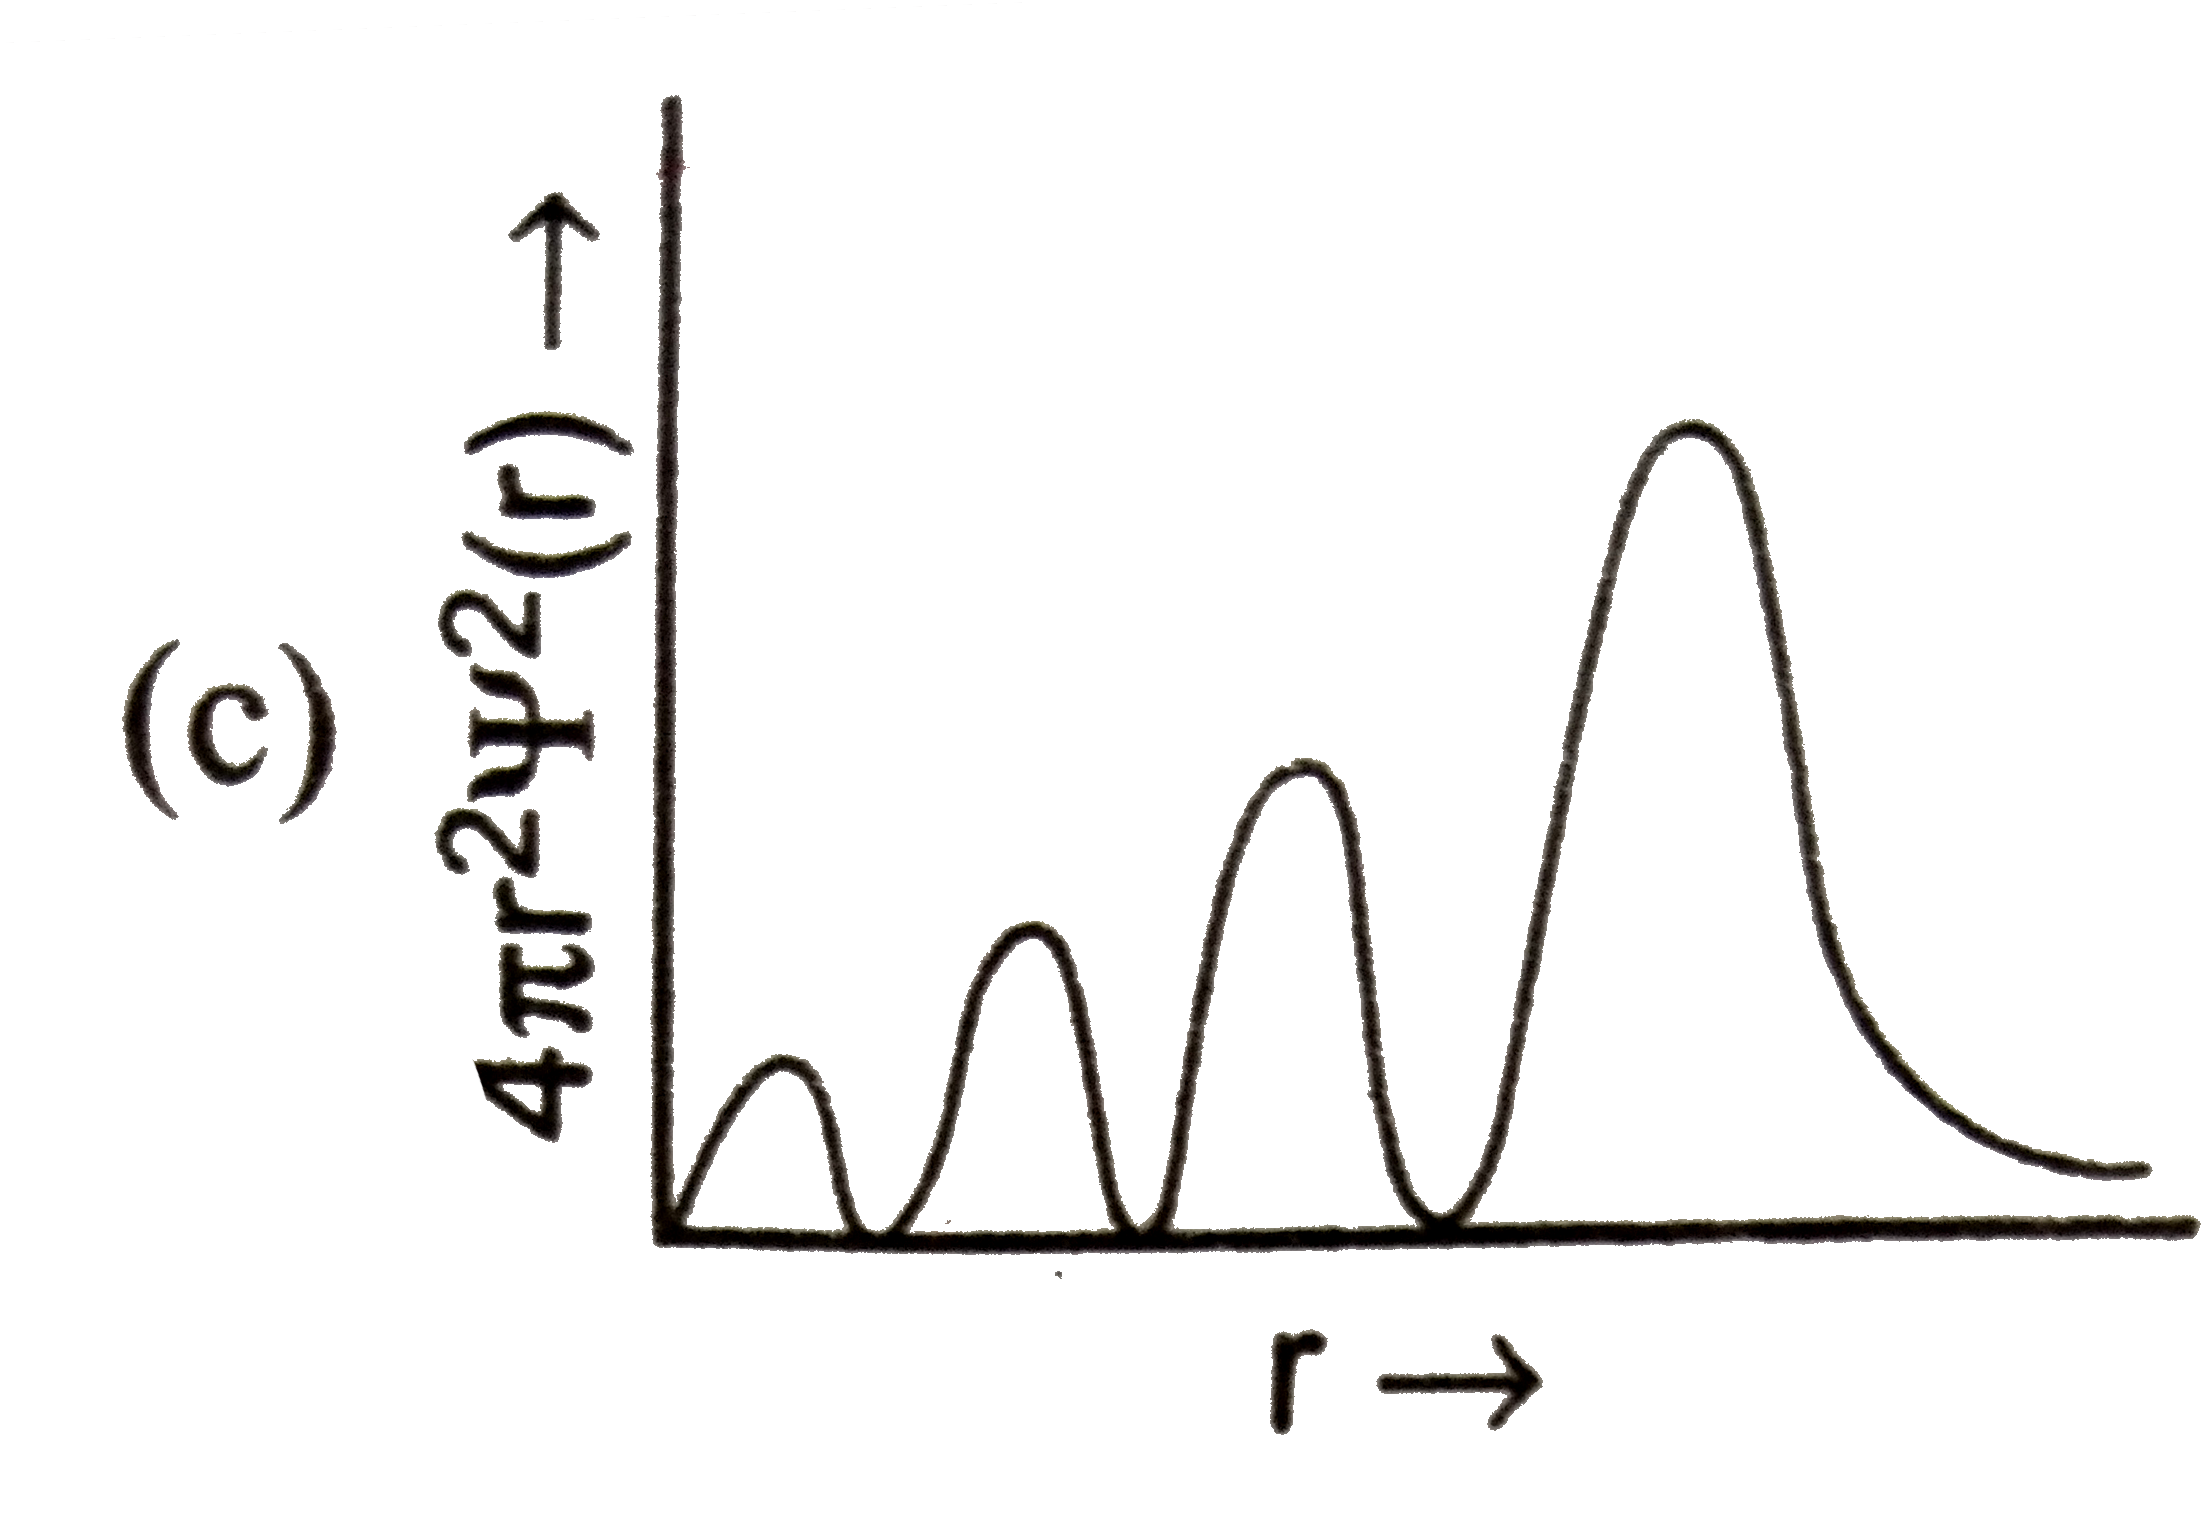 D
D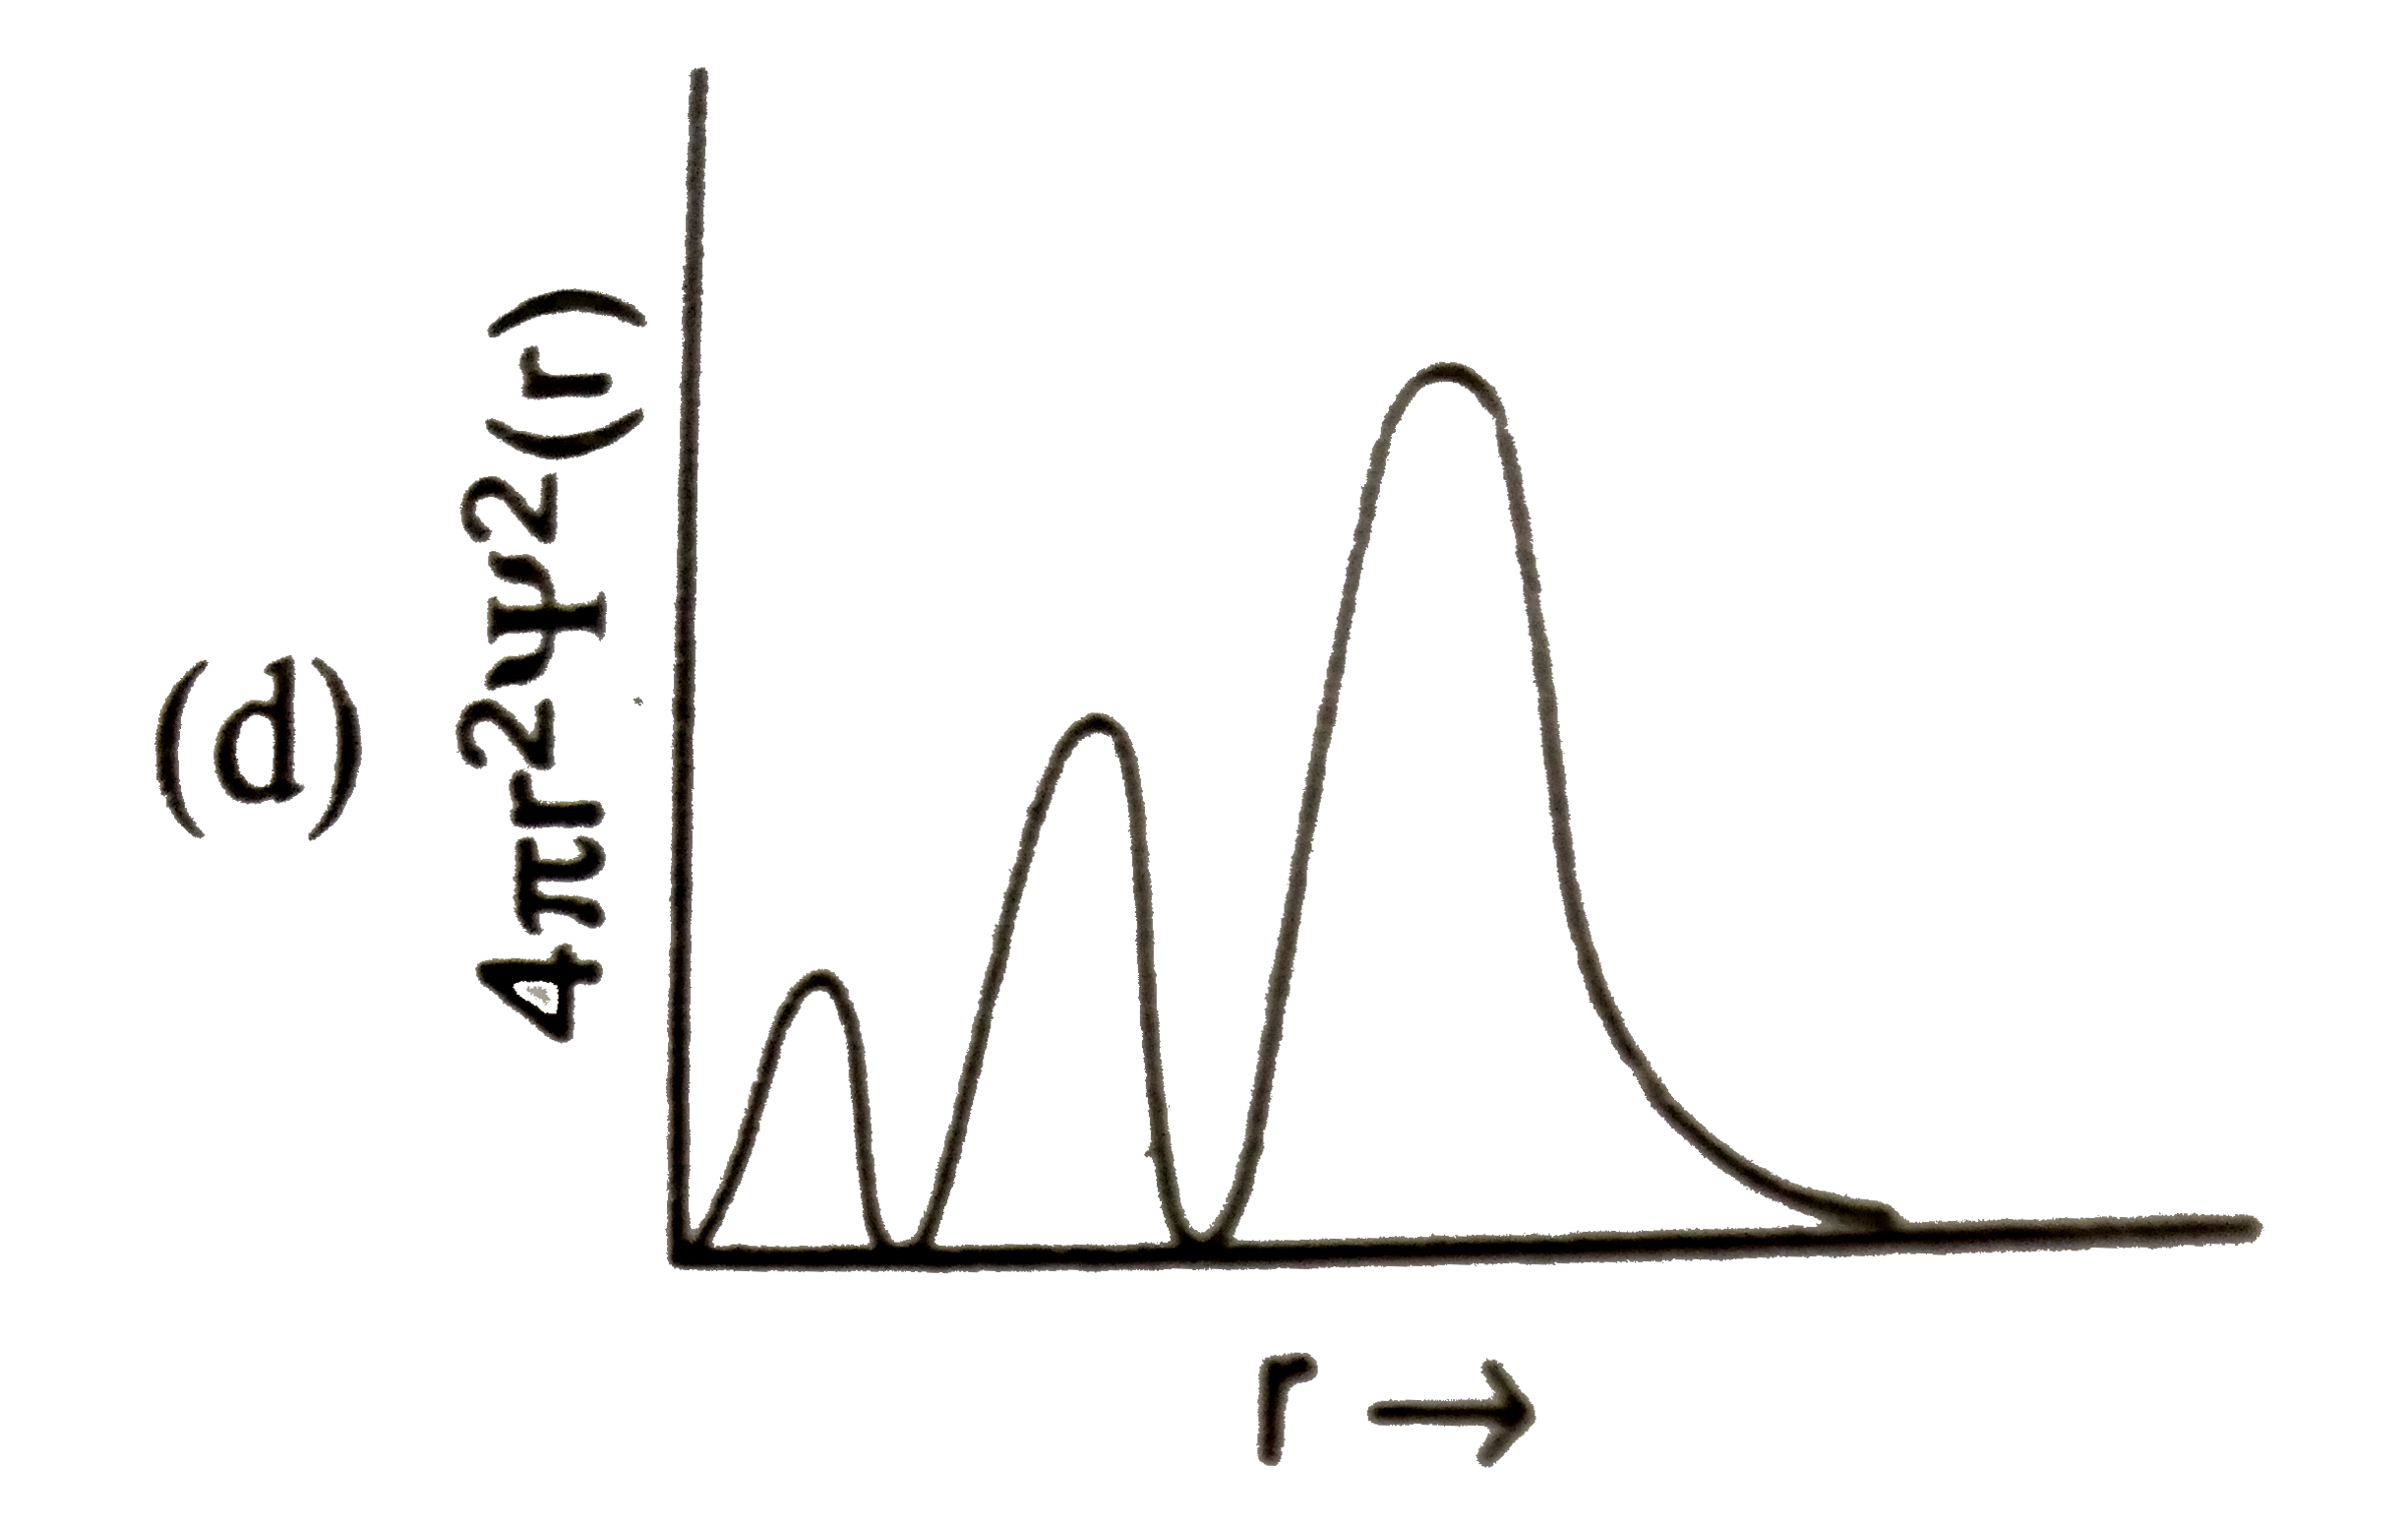
For which of the following orbitals is the radial probaility density R2 the maximum at the nucleus and descrease sharply as the distance form the nucleus increases?
A1sB2sC3sDAll the s orbitals
The variation of radial probability density R2 (r) as a function of distance r of the electron from the nucleus for 3p orbital:
View SolutionThe correct statement about probability density (except at infinite distance from nucleus ) is :
View SolutionThe correct statement about probability density (except at infinite distance from nucleus ) is :
View SolutionThe variation of radial probability density R2 (r) as a function of distance r of the electron from the nucleus for 3p orbital:
(A)(a)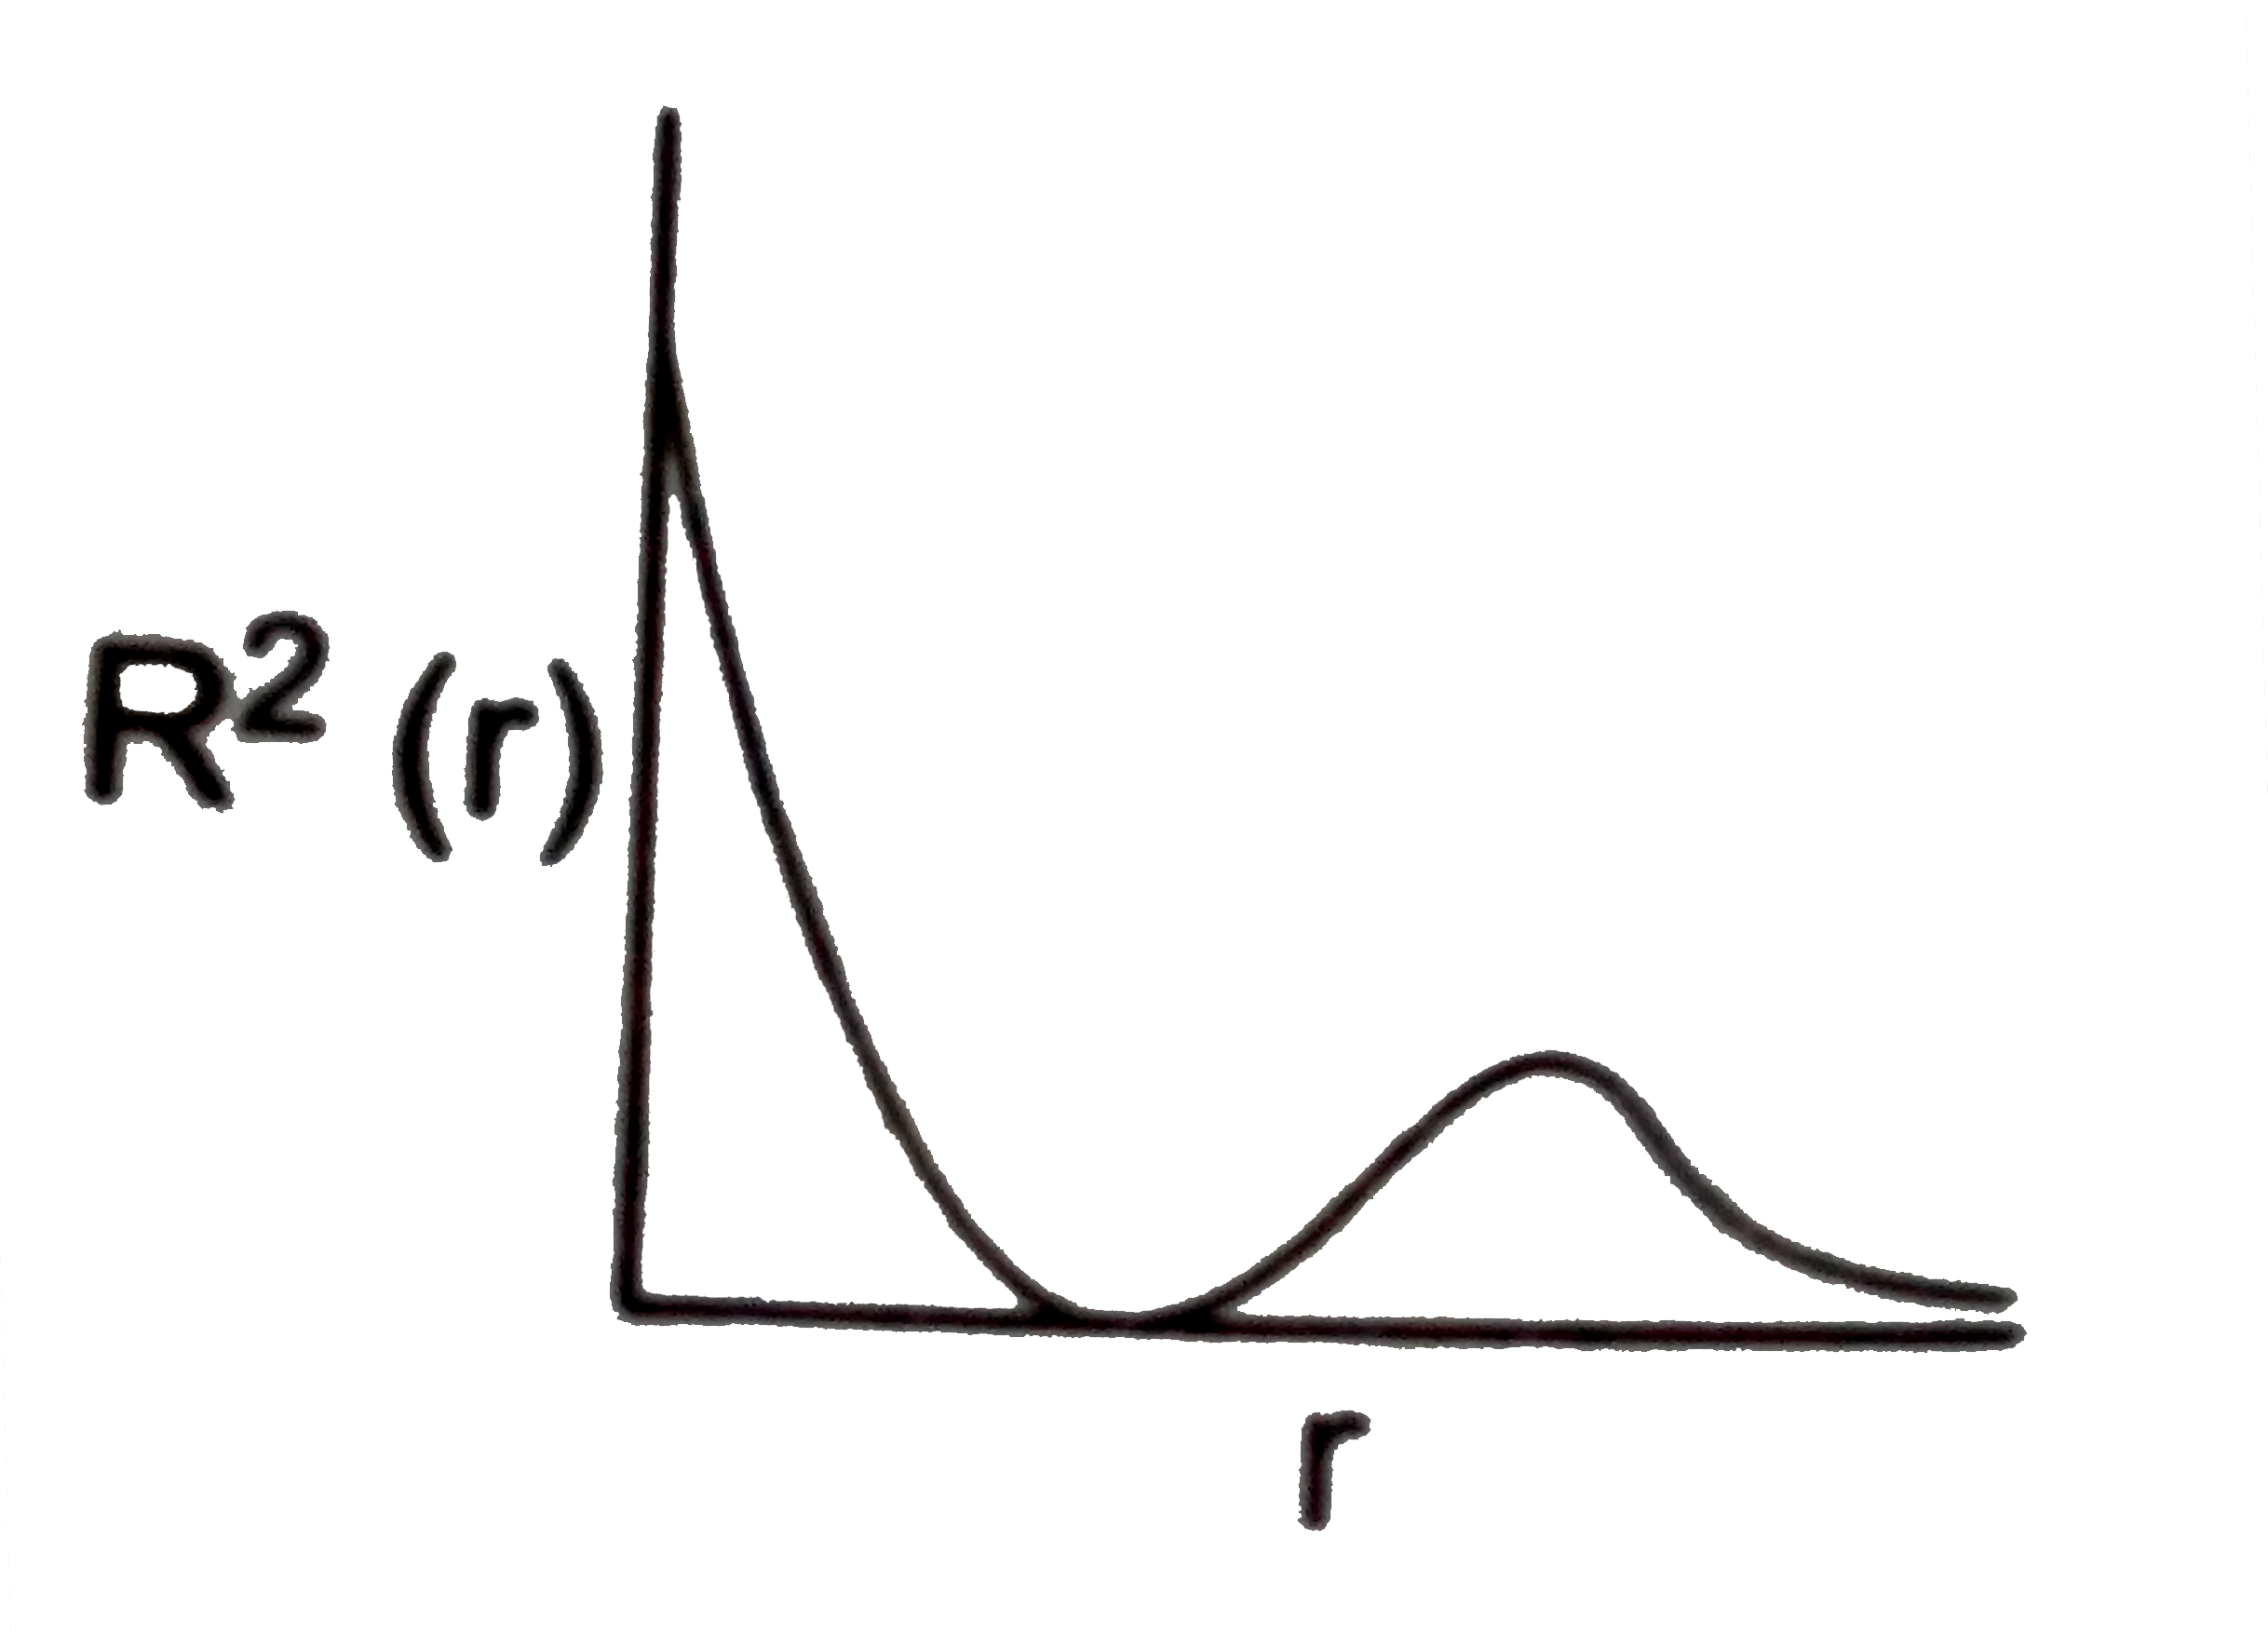
(b) (b)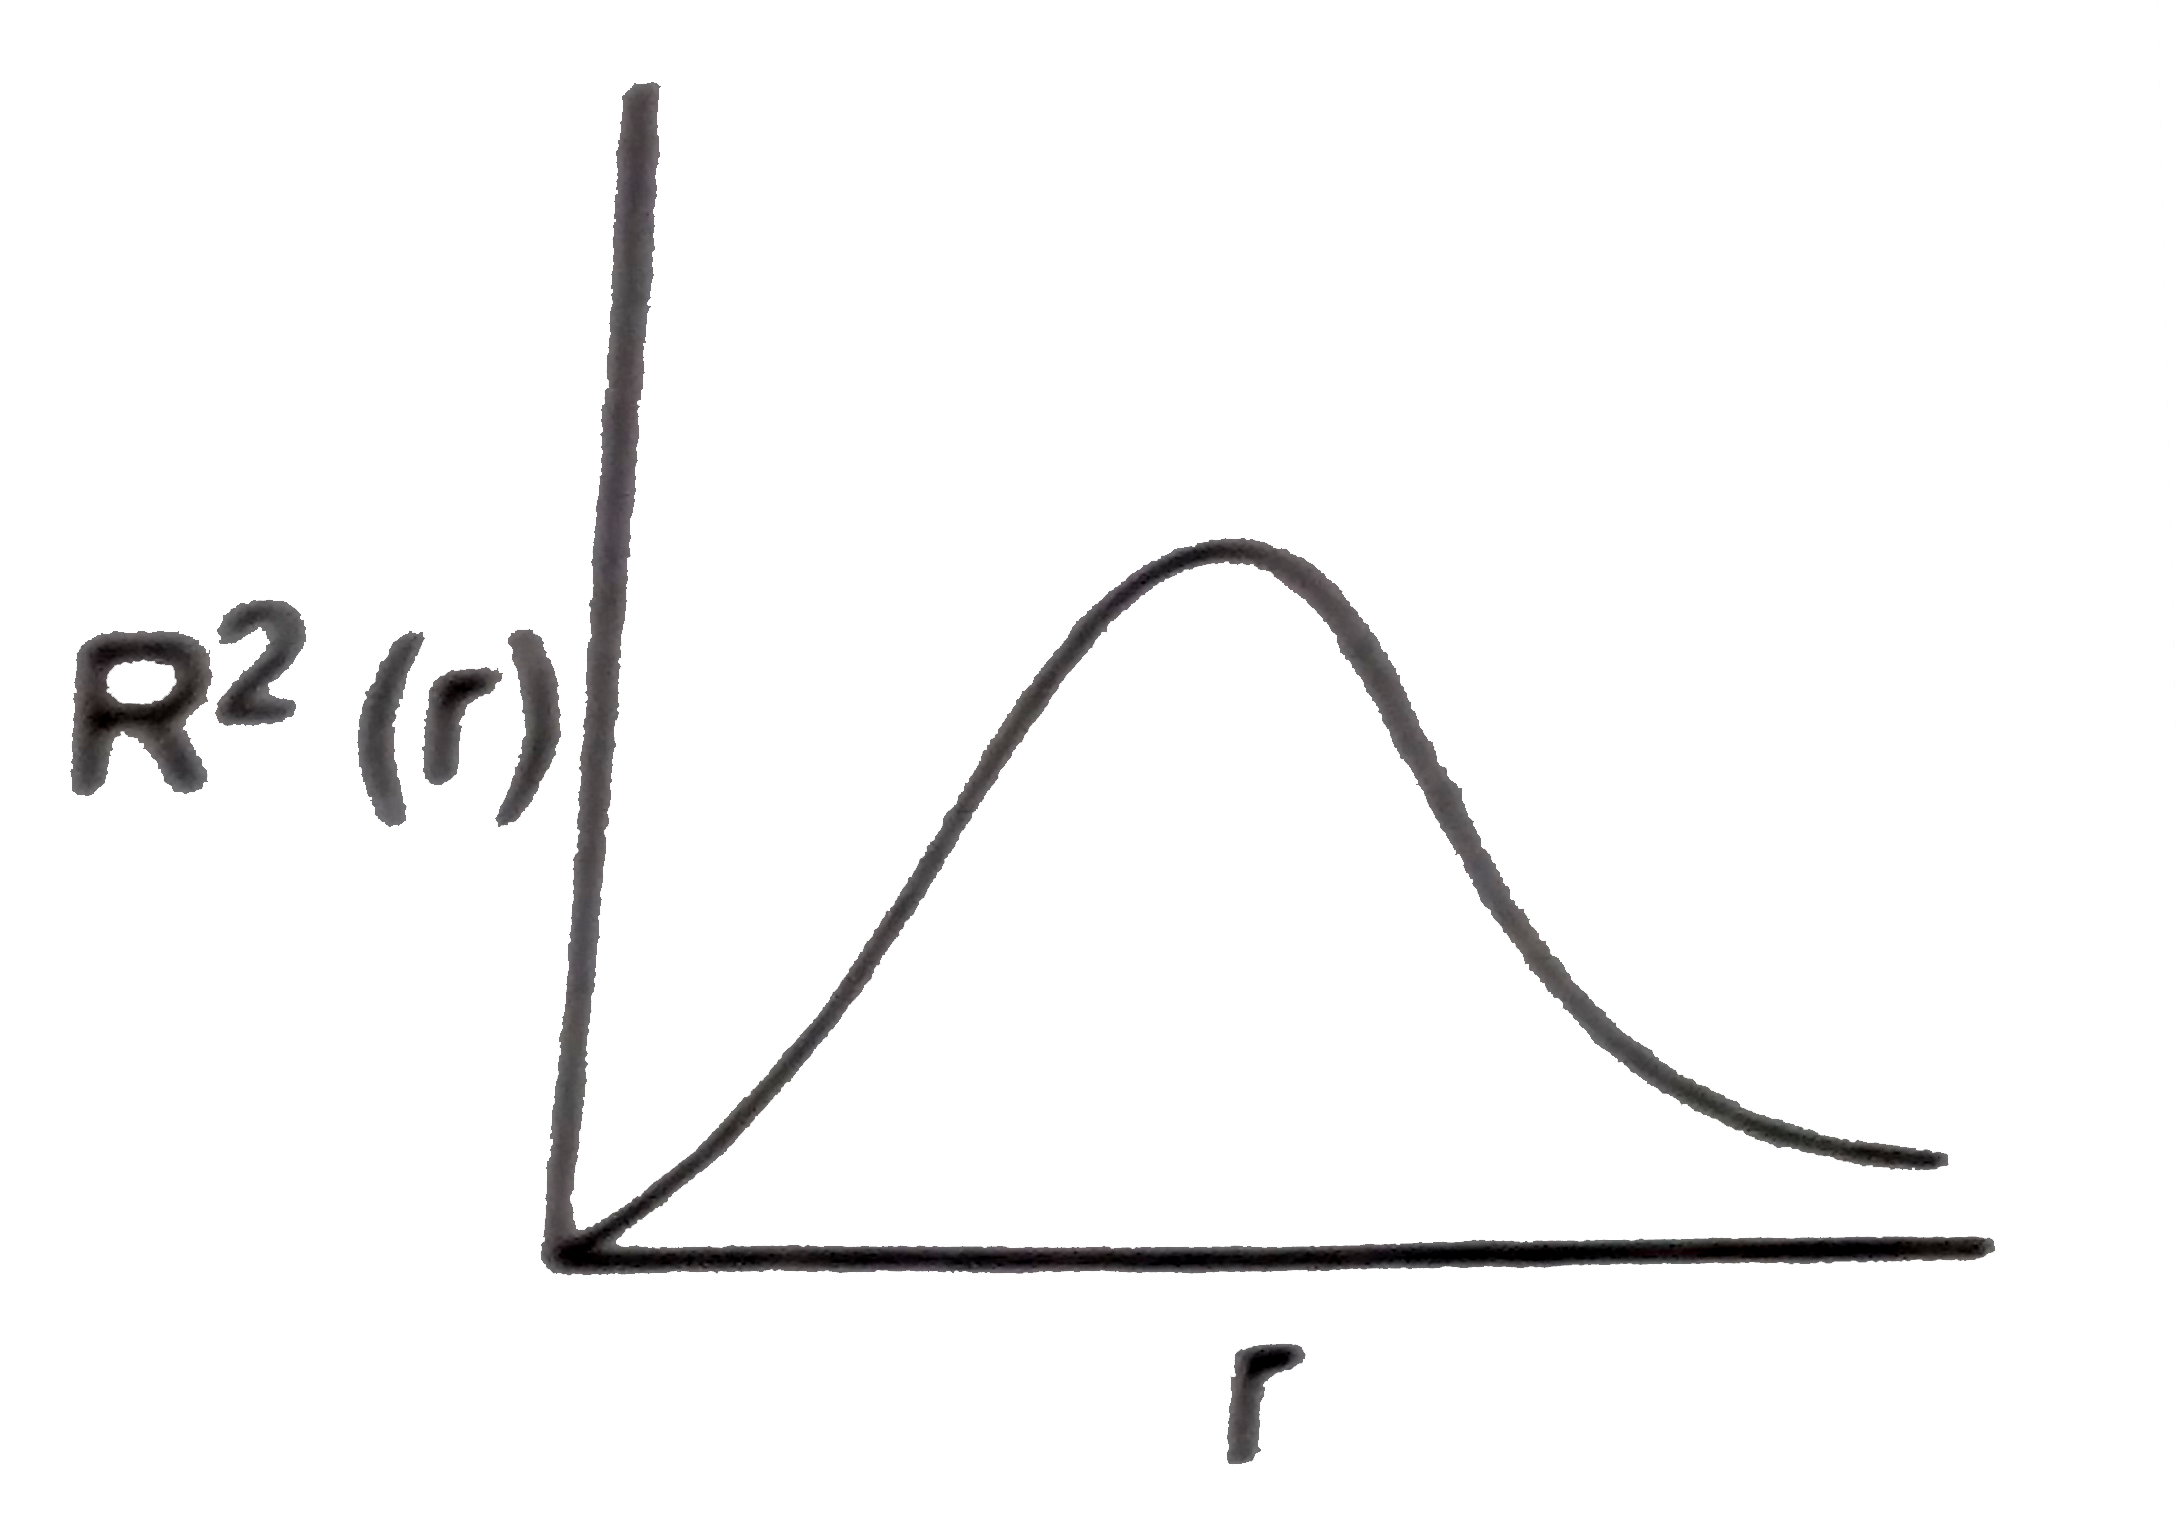
(c)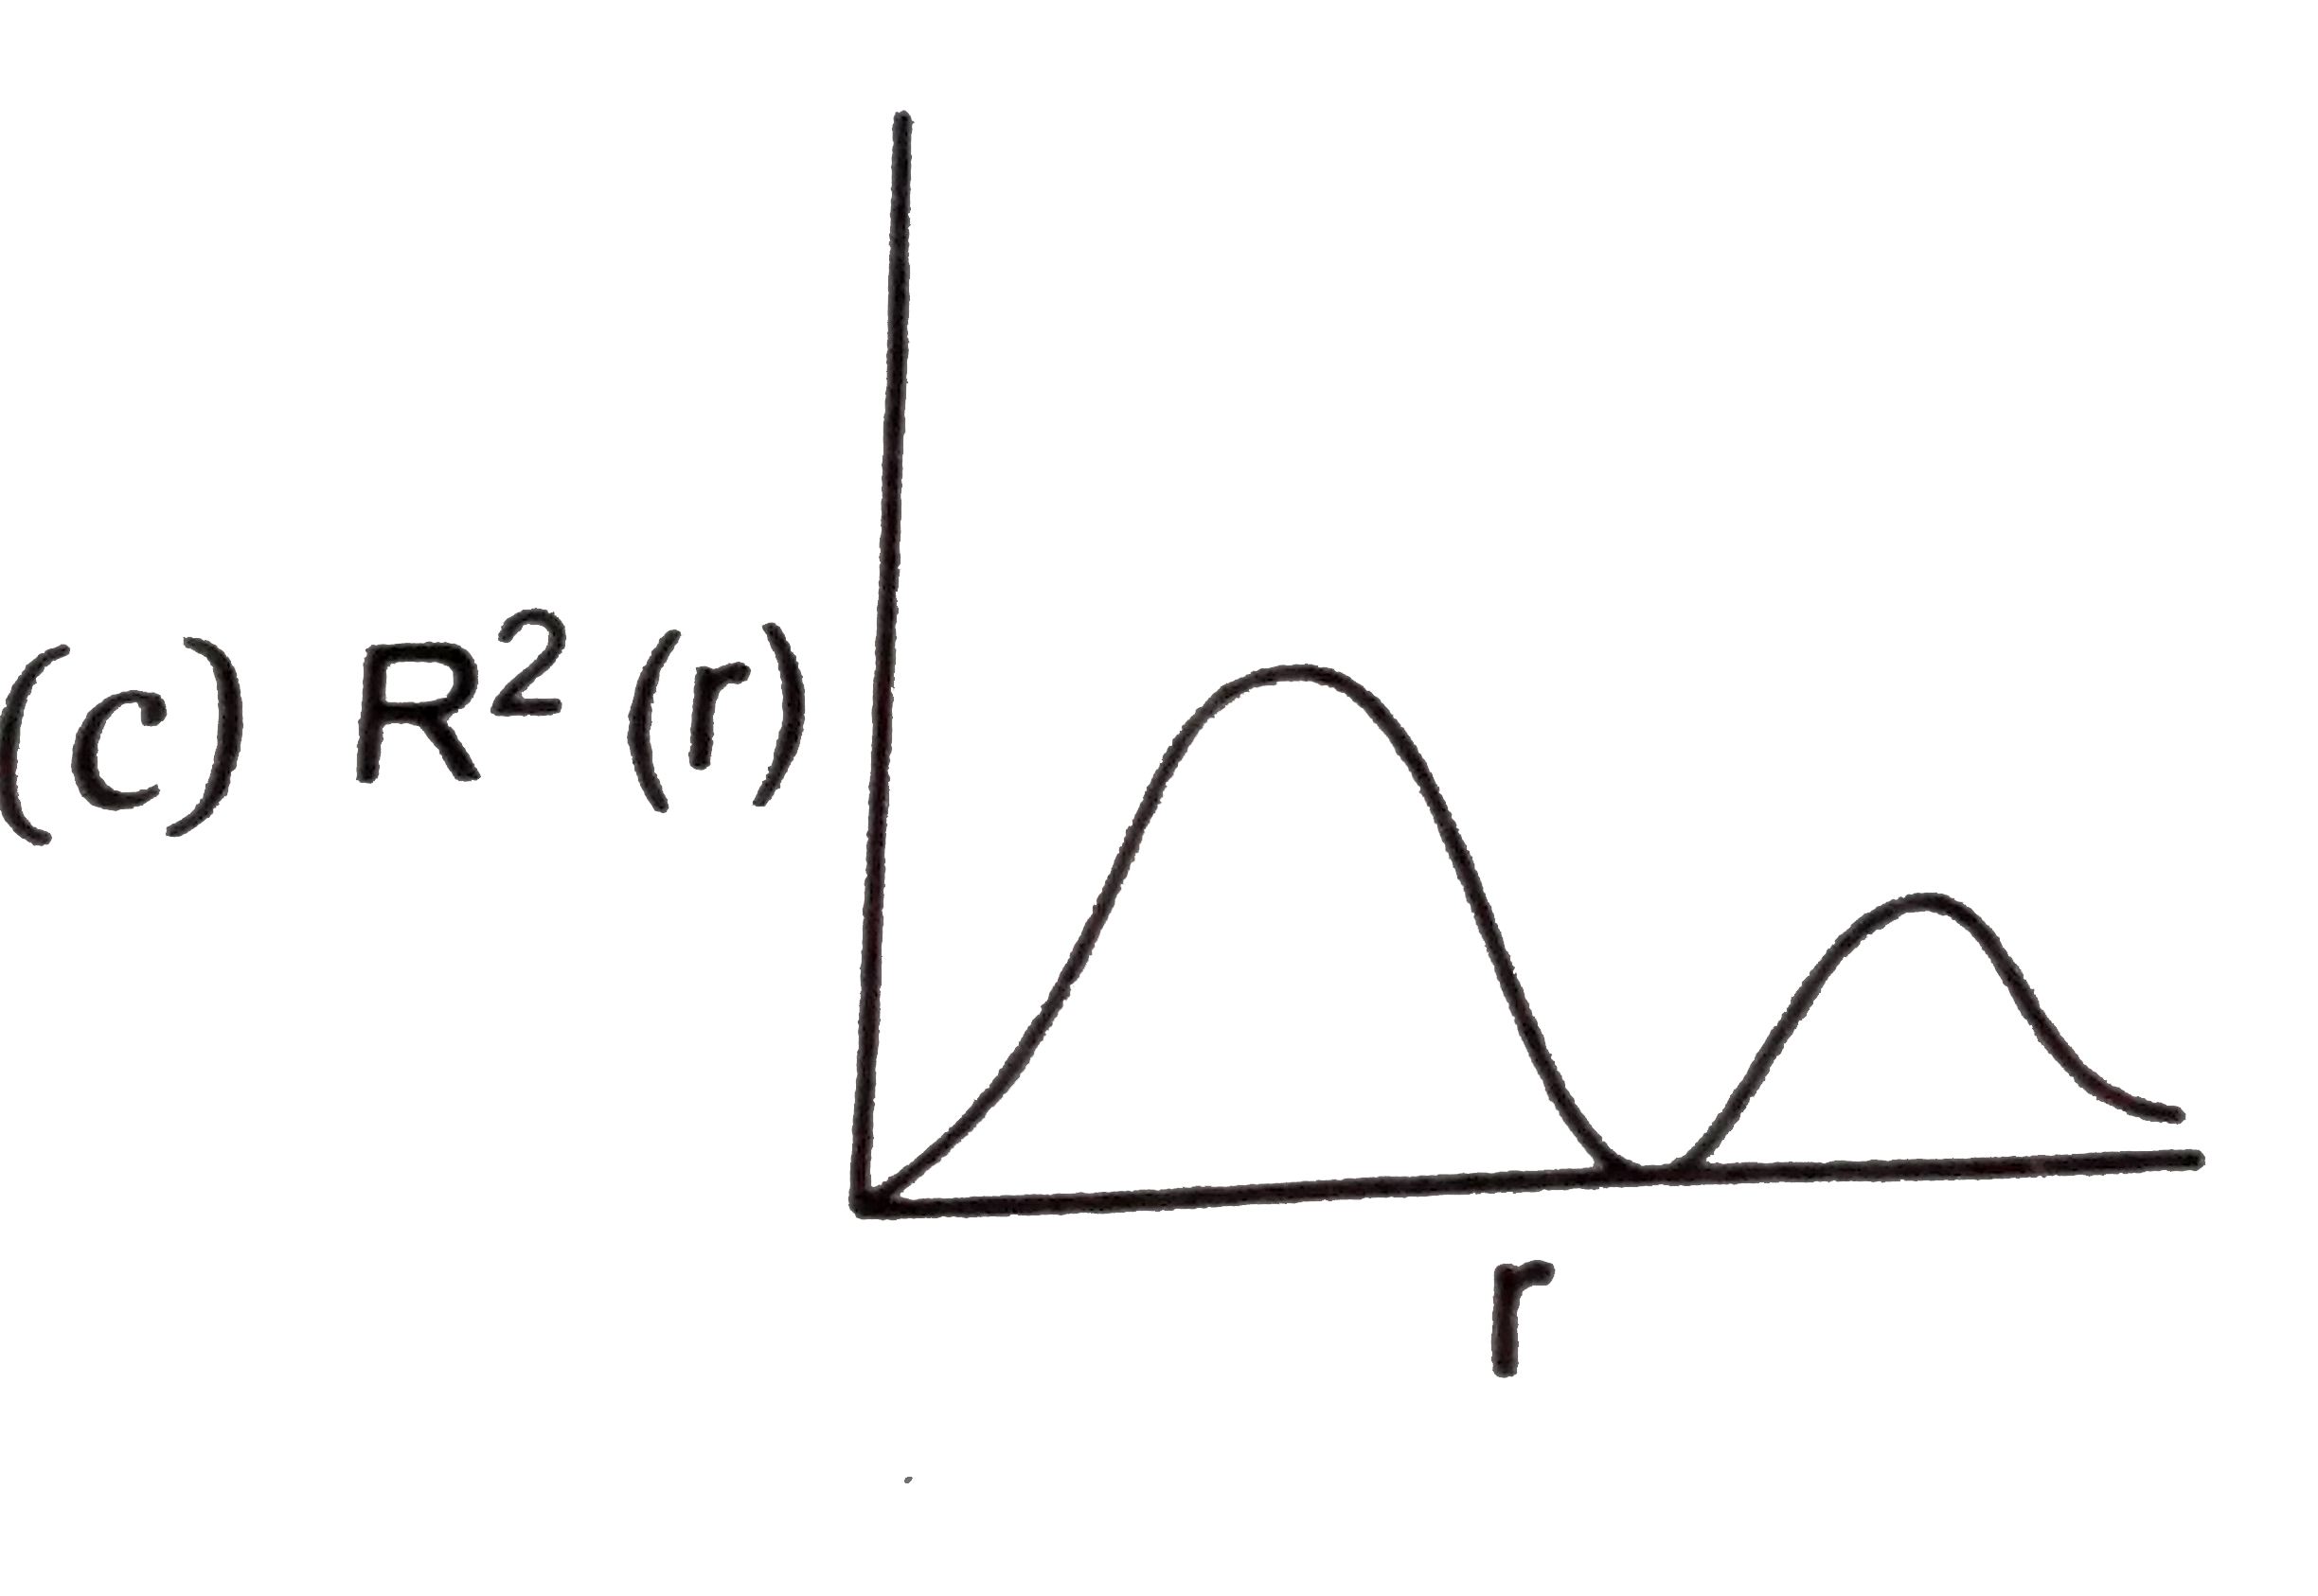
(d)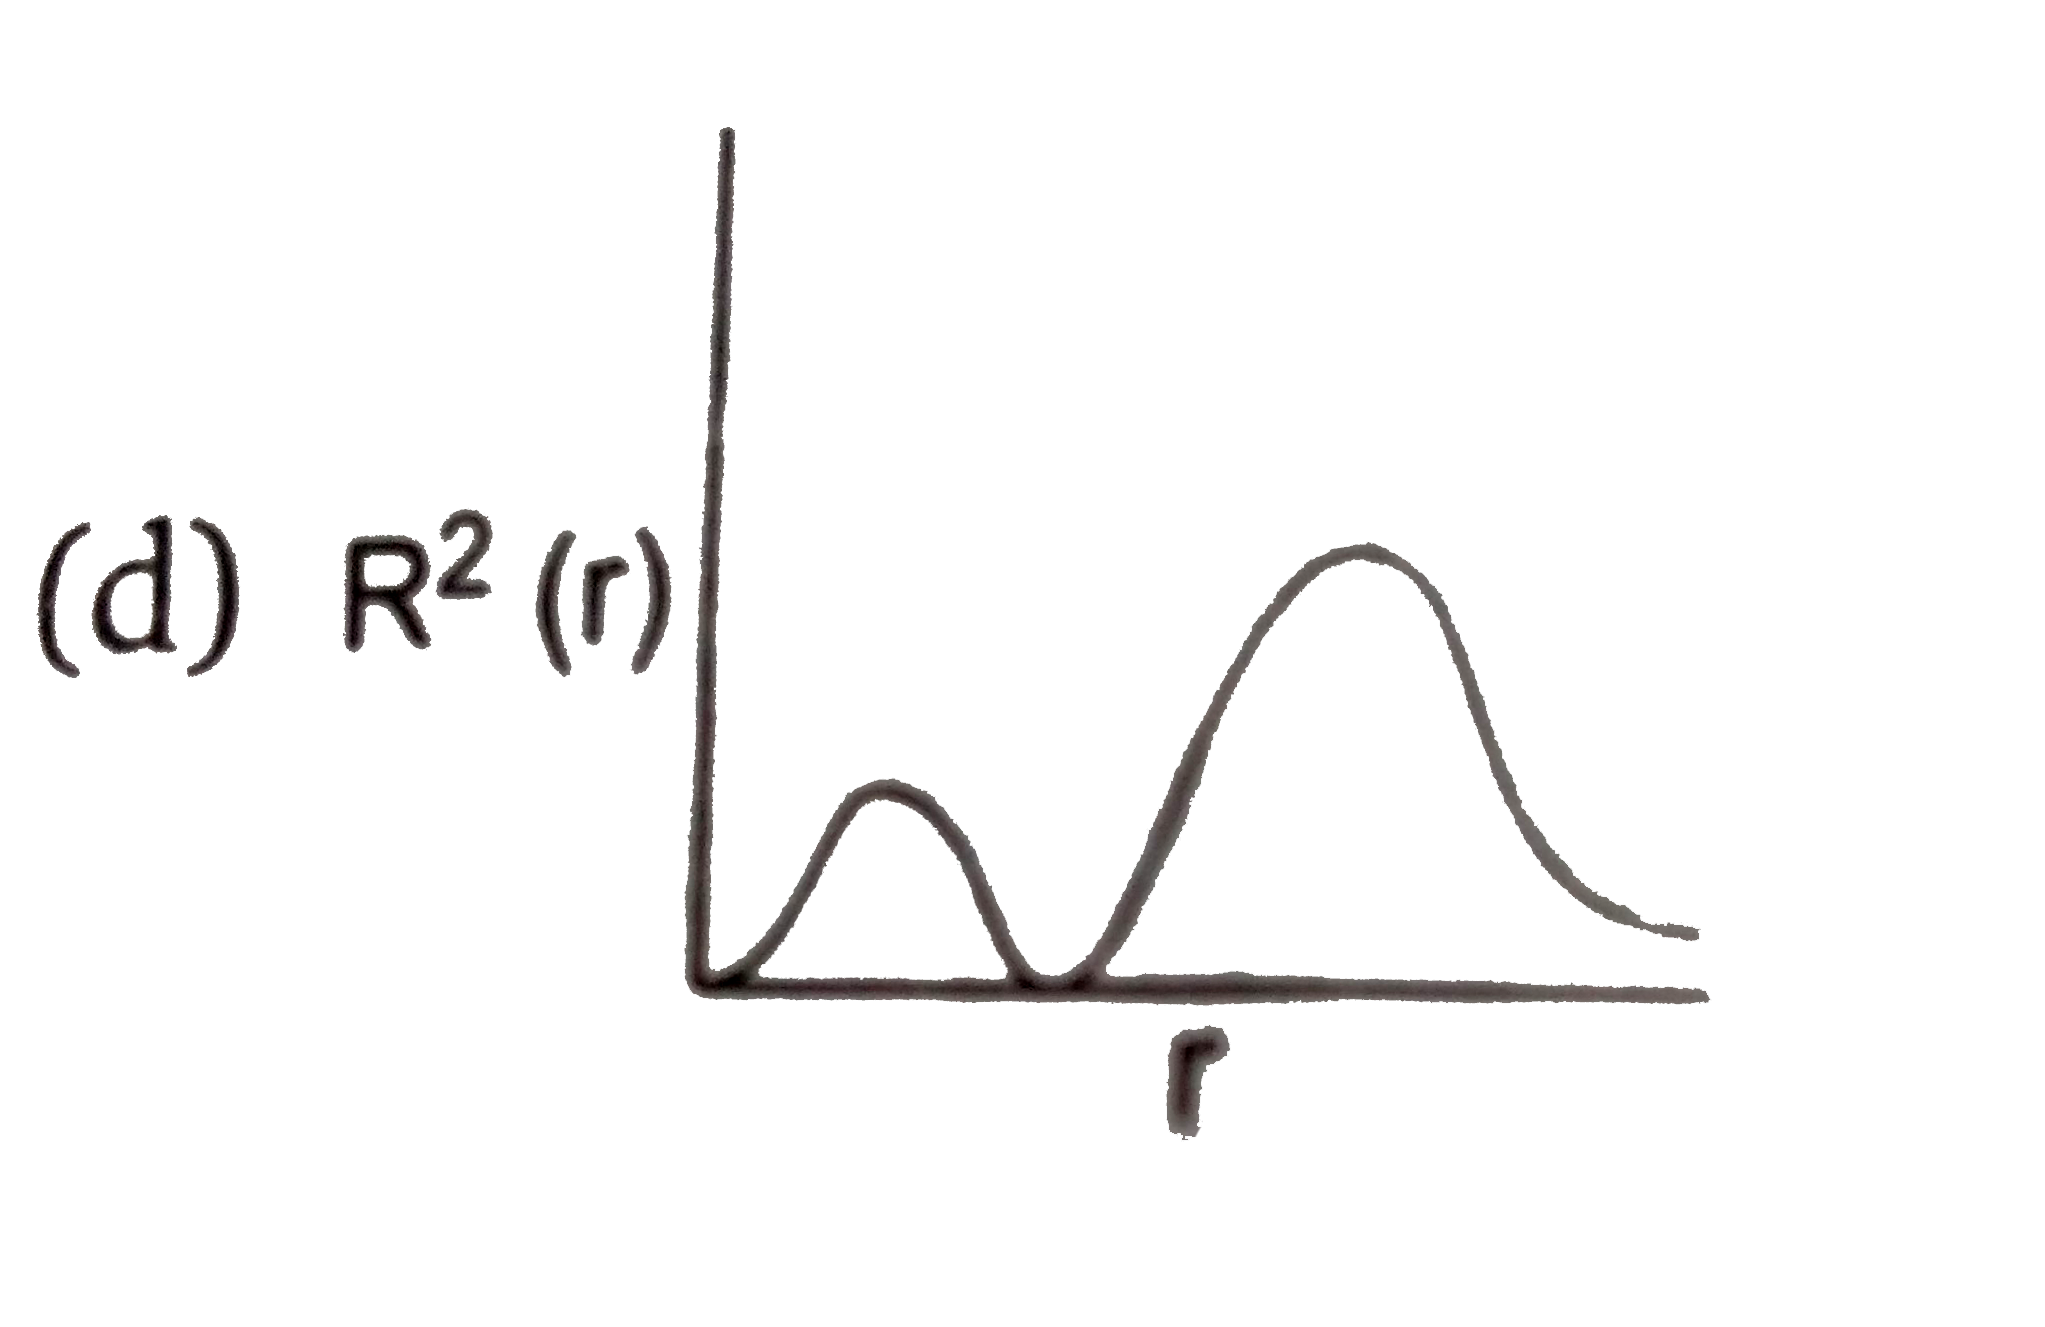
View SolutionWhich of the following radial probability distribution graph is correct for 5s orbital ?
View Solution
