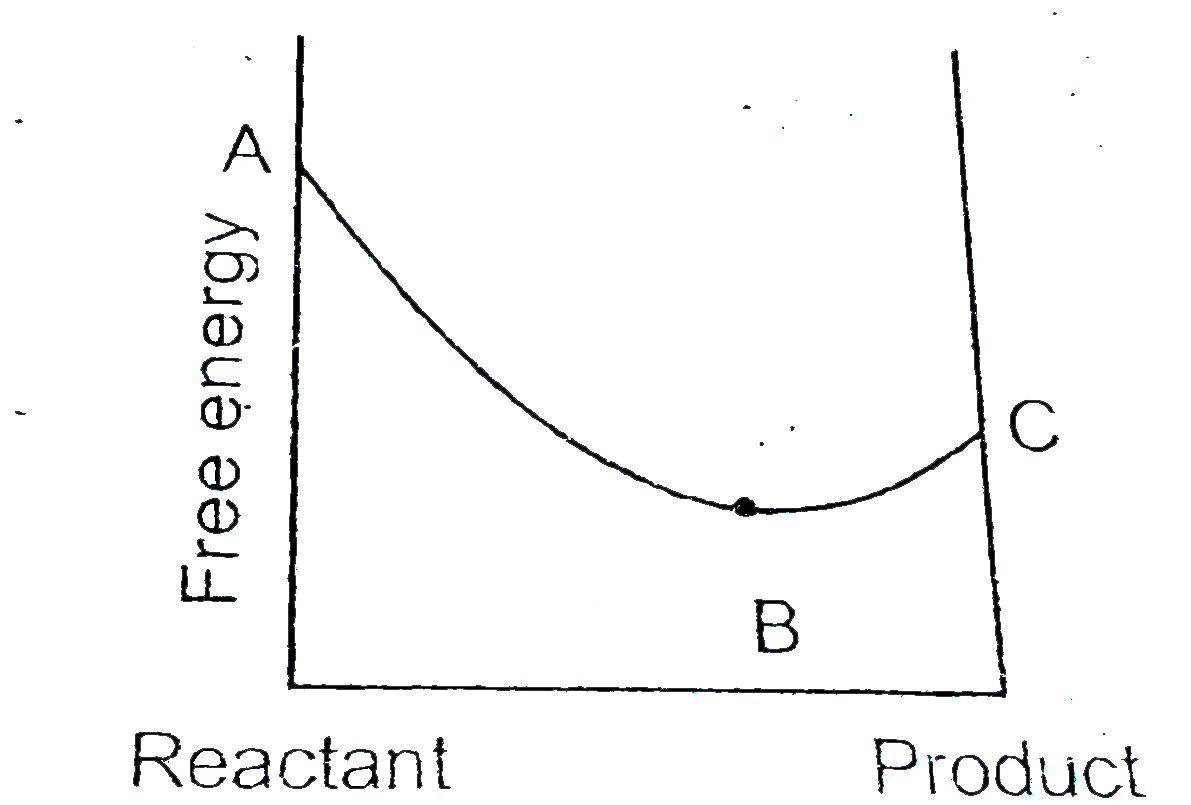
Which of the following graph between (x/m) vs P is correct?
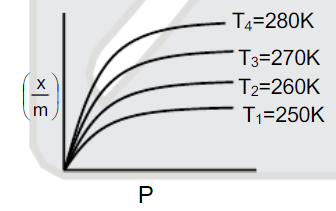
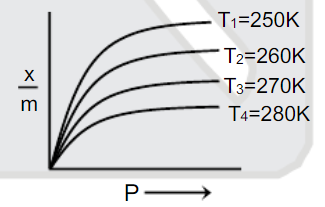
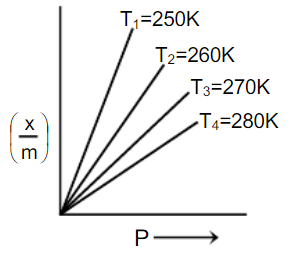
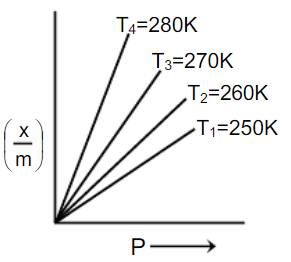
To solve the question regarding the correct graph between xm vs P, we will analyze the relationship based on the Freundlich adsorption isotherm.
1. Understanding the Variables:
- x is the amount of gas adsorbed.
- m is the mass of the adsorbent.
- P is the pressure of the gas.
- The term xm represents the extent of adsorption.
2. Freundlich Adsorption Isotherm:
- The Freundlich adsorption isotherm states that the extent of adsorption (xm) is directly proportional to the pressure (P) and inversely proportional to the temperature (T).
- Mathematically, this can be expressed as:
xm∝PT
- This implies that as pressure increases, the extent of adsorption increases, provided the temperature remains constant or decreases.
3. Analyzing the Graphs:
- We need to look for a graph where xm increases with P while T decreases or remains constant.
4. Evaluating Each Option:
- Option 1: As P increases, xm increases, but temperature also increases. This does not satisfy the condition (incorrect).
- Option 2: As P increases, xm increases, and temperature decreases. This satisfies the condition (correct).
- Option 3: As P increases, xm increases, but temperature also increases. This does not satisfy the condition (incorrect).
- Option 4: Similar to option 3, xm and P both increase while temperature also increases. This does not satisfy the condition (incorrect).
5. Conclusion:
- The only graph that satisfies the condition of xm increasing with P while T decreases is Option 2.
Final Answer:
The correct graph between xm vs P is Option 2.
- x is the amount of gas adsorbed.
- m is the mass of the adsorbent.
- P is the pressure of the gas.
- The term xm represents the extent of adsorption.
- The Freundlich adsorption isotherm states that the extent of adsorption (xm) is directly proportional to the pressure (P) and inversely proportional to the temperature (T).
- Mathematically, this can be expressed as:
xm∝PT
- This implies that as pressure increases, the extent of adsorption increases, provided the temperature remains constant or decreases.
- We need to look for a graph where xm increases with P while T decreases or remains constant.
- Option 1: As P increases, xm increases, but temperature also increases. This does not satisfy the condition (incorrect).
- Option 2: As P increases, xm increases, and temperature decreases. This satisfies the condition (correct).
- Option 3: As P increases, xm increases, but temperature also increases. This does not satisfy the condition (incorrect).
- Option 4: Similar to option 3, xm and P both increase while temperature also increases. This does not satisfy the condition (incorrect).
- The only graph that satisfies the condition of xm increasing with P while T decreases is Option 2.
The correct graph between xm vs P is Option 2.
Similar Questions
Knowledge Check
Which of the following graph represents correct graph for SN1 reaction :
A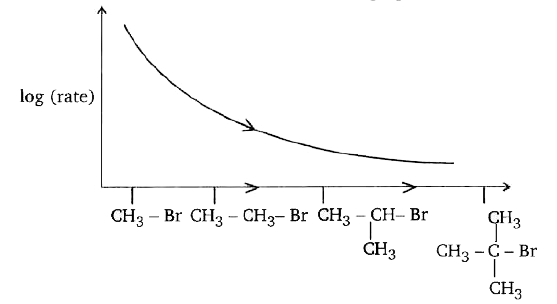 B
B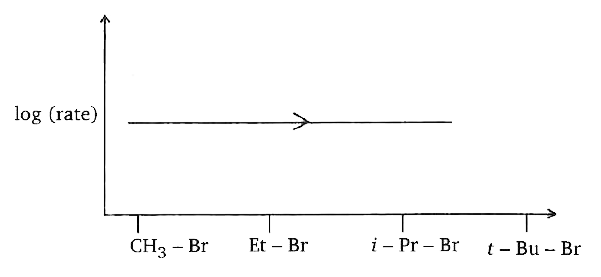 C
C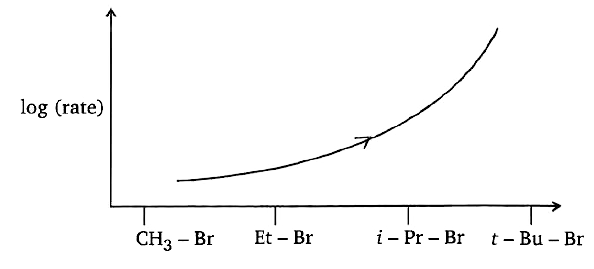 D
D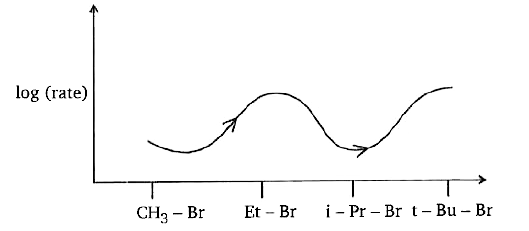
Which of the following graph represents v/f vs u/f graph for a virtual erect image by a diverging lens?
View SolutionWhich one of the following graphs between molar conductivity (Am) versus √C is correct?
View SolutionWhich of the following graph ploltted between P and V is
INCORRECT ?
View SolutionWhich of the following graphs between the square of the time period and cube of the distance of the planet from the sun is correct ?
View SolutionWhich of the following graphs between the square of the time period and cube of the distance of the planet from the sun is correct ?
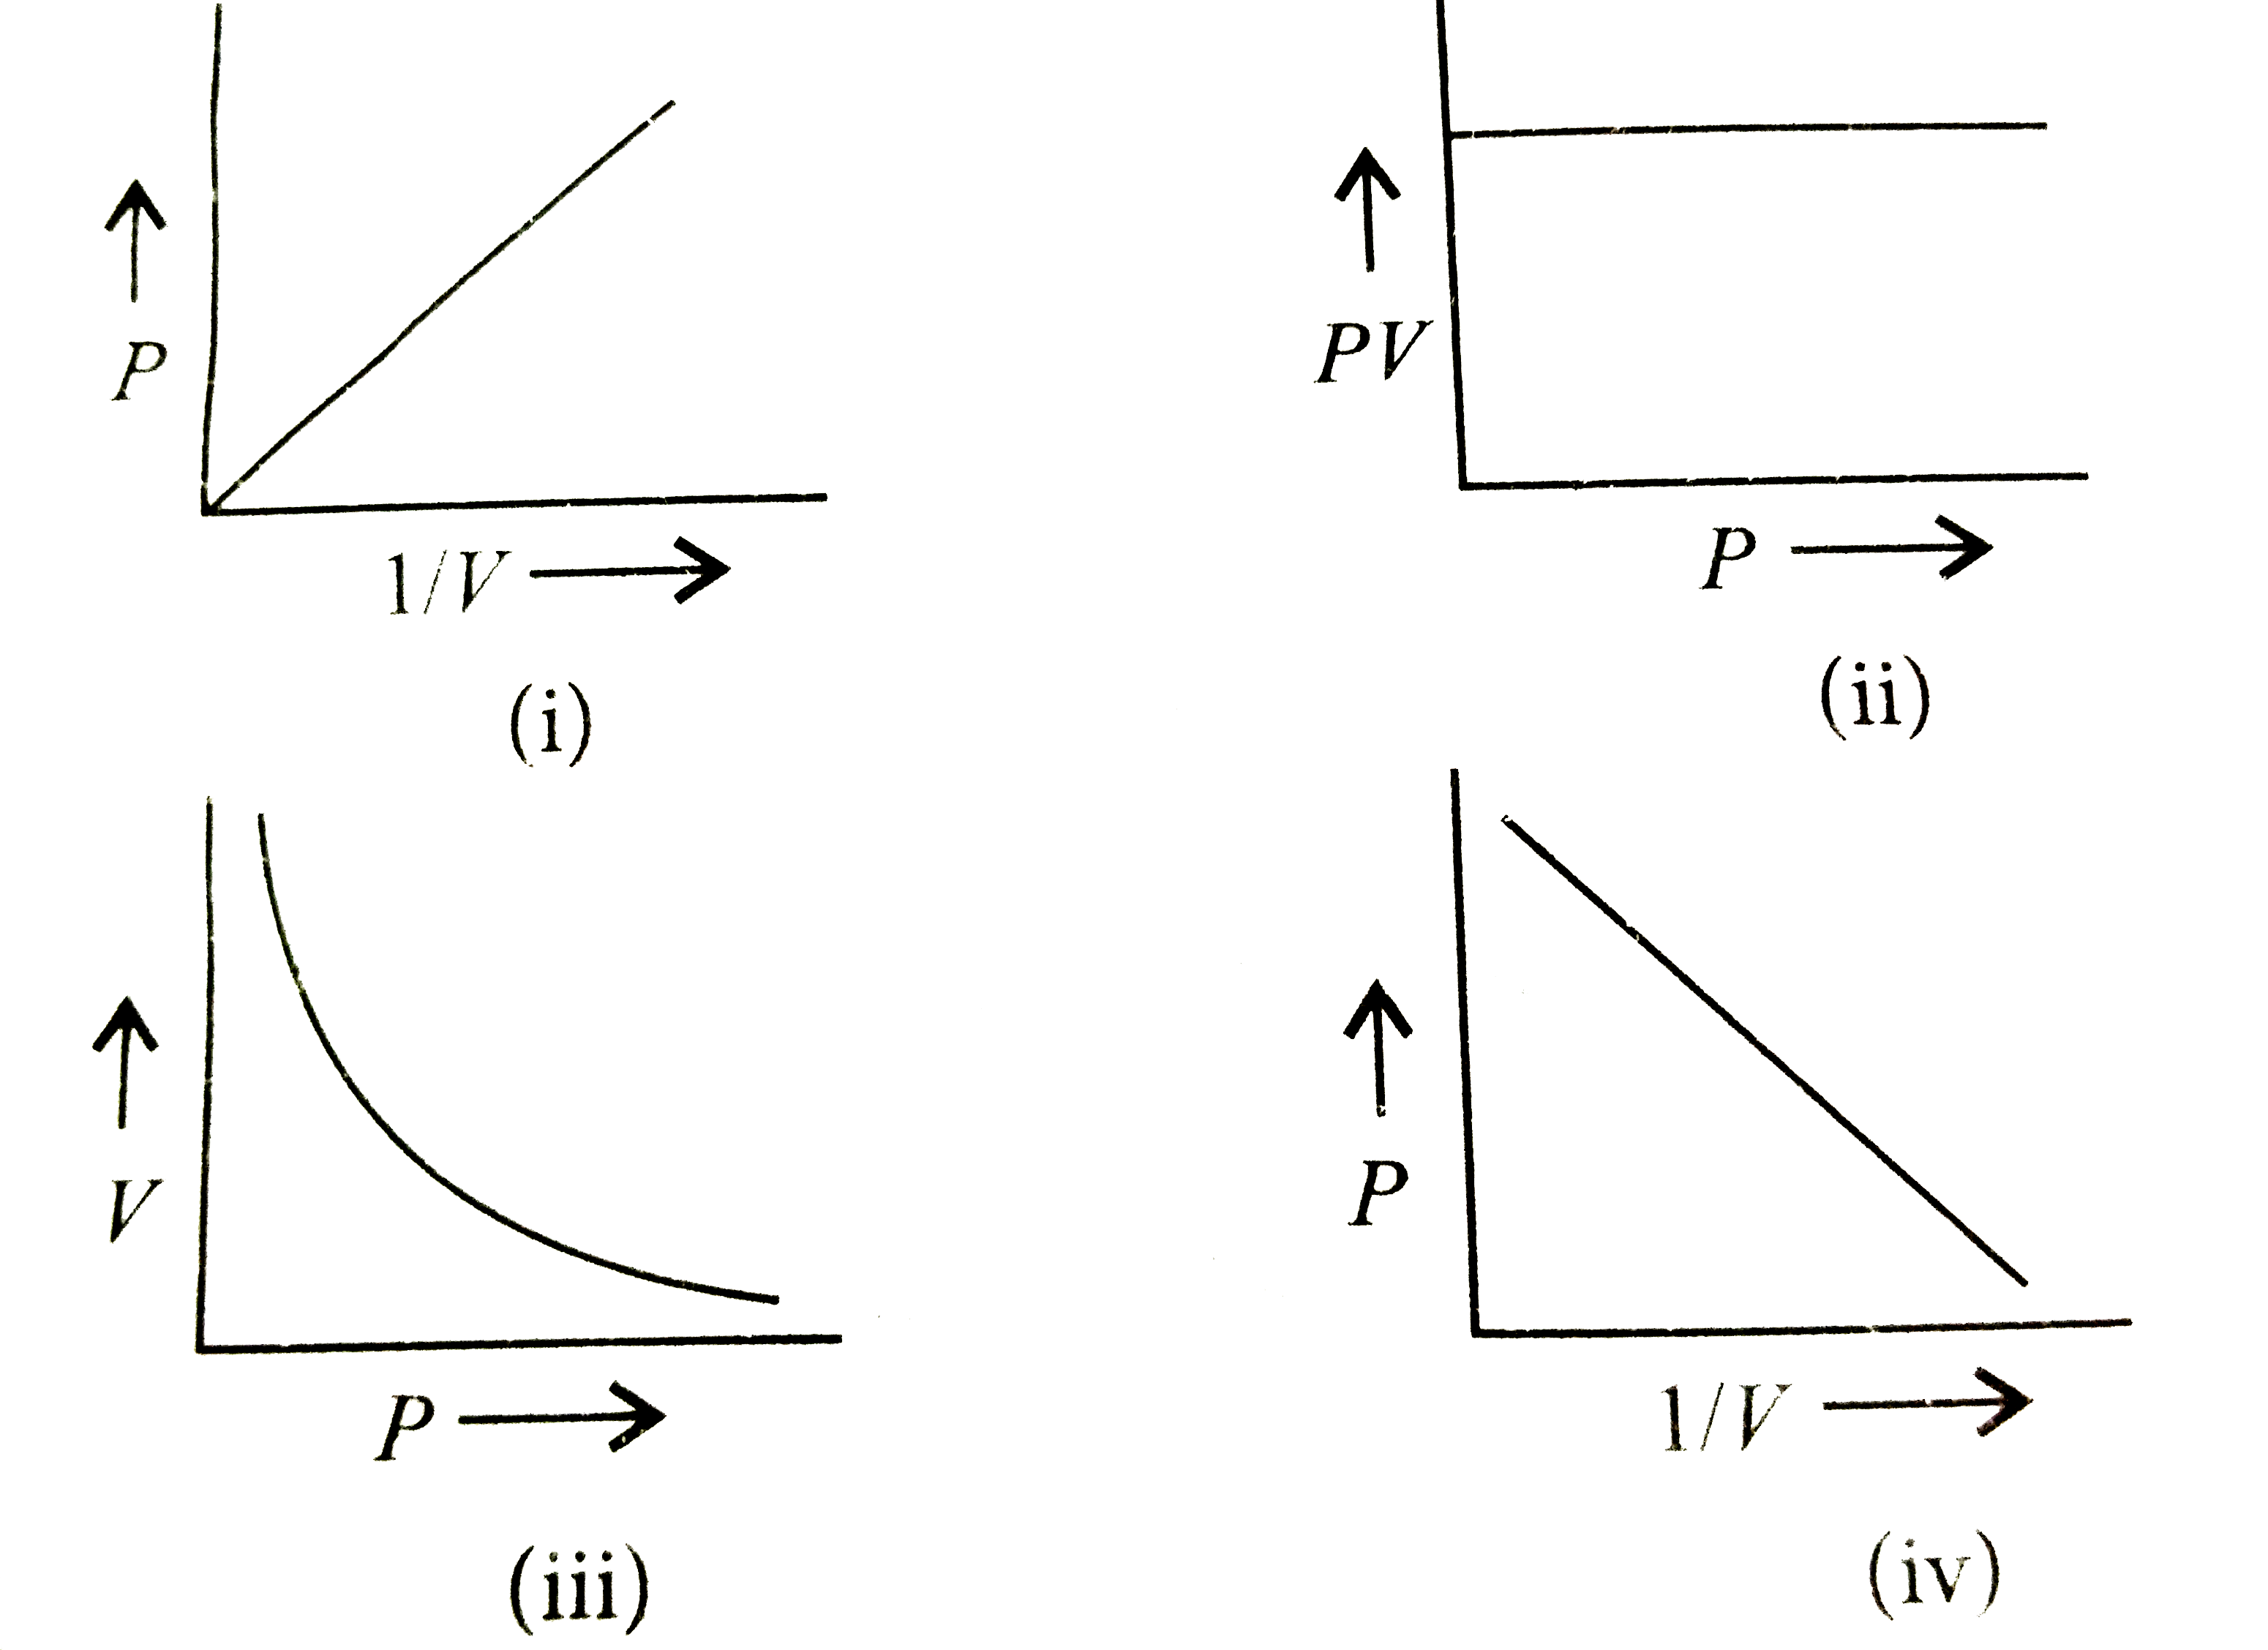
View SolutionWhich of the following graphs represents the correct Boyle's law ?
View SolutionWhich of the following graph is correct for a first order reaction ?
View Solution

