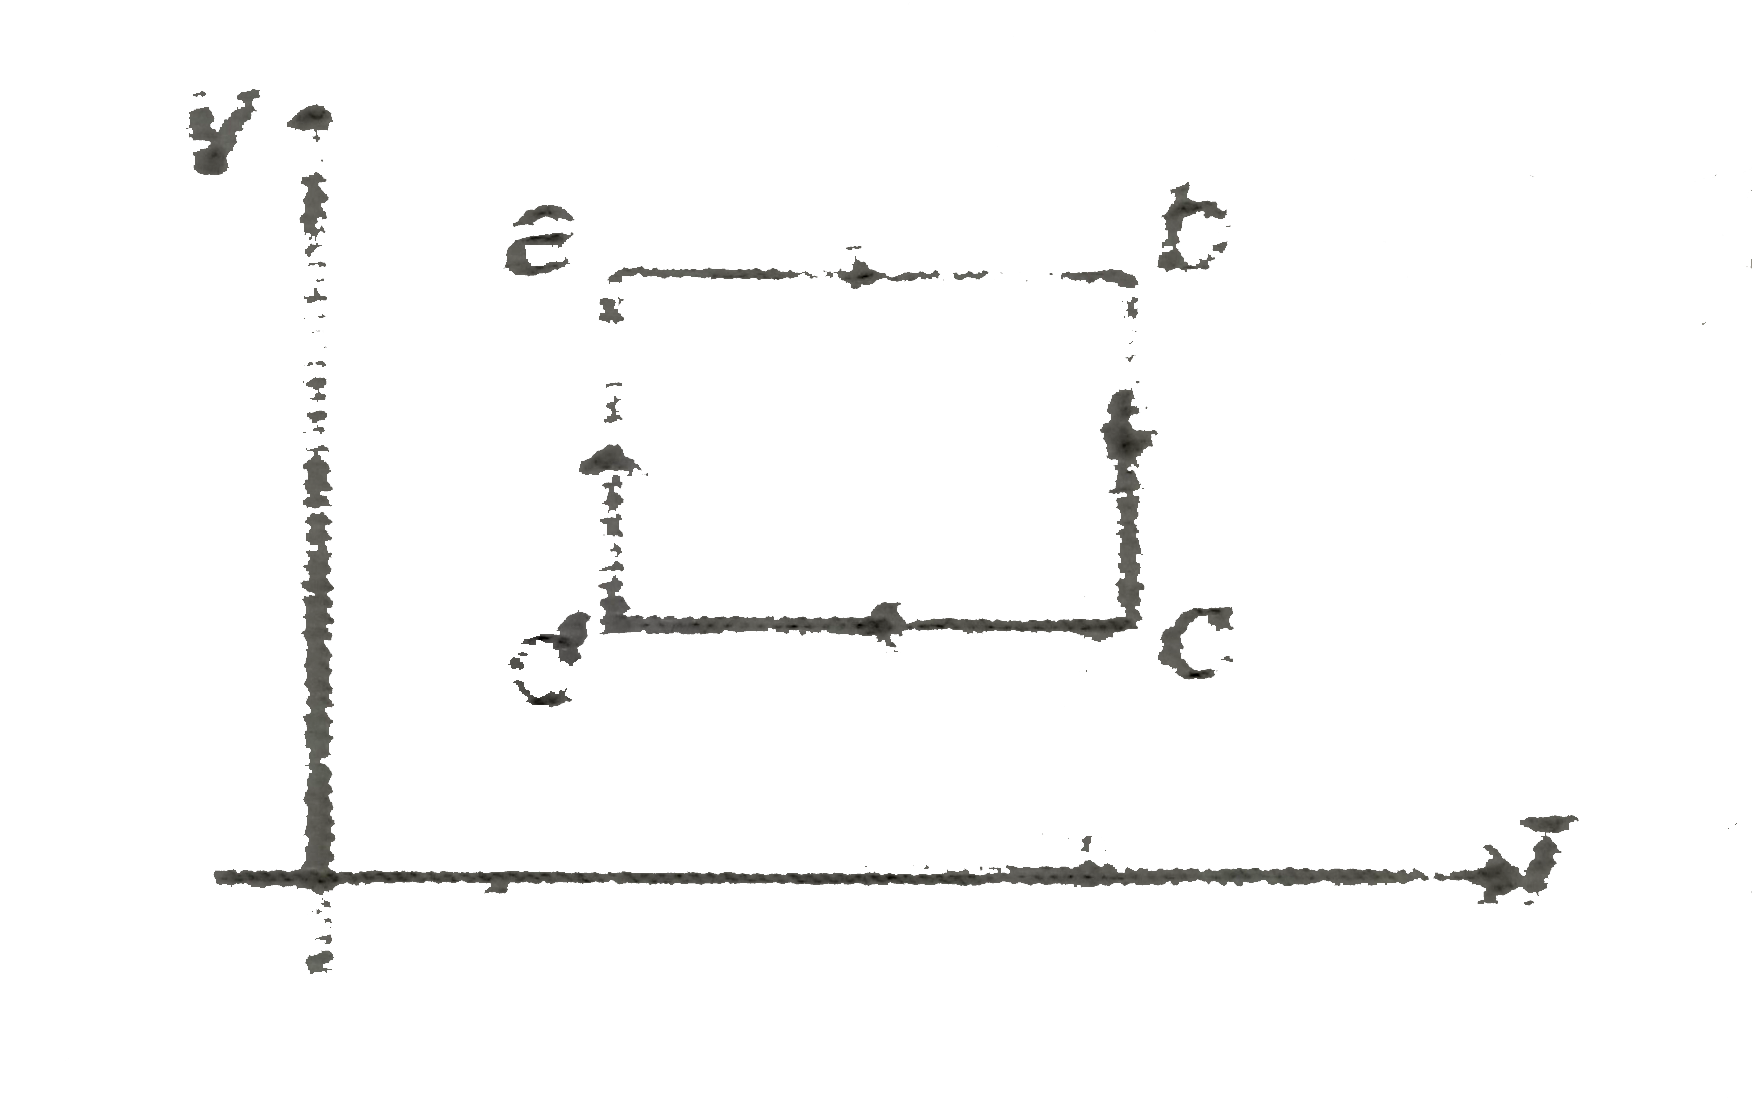
V - T graph for a given mass of an ideal gas is shown in the figure. Then the corresponding P - V graph would be
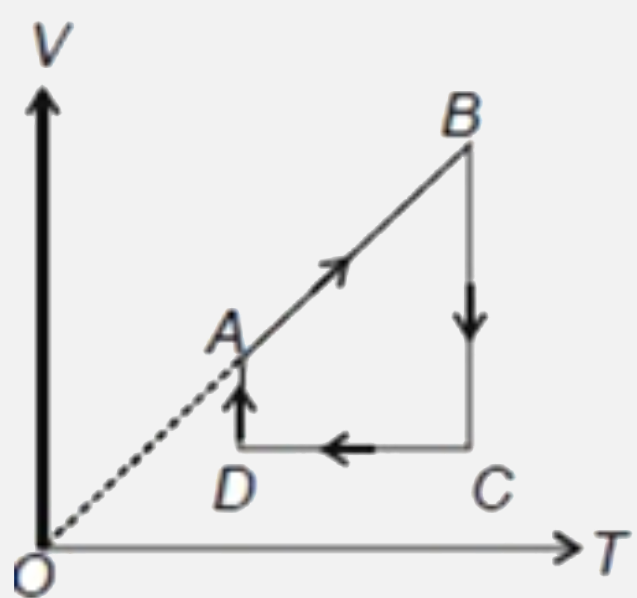
(BC and DA are vertical lines , CD is horizontal line )


The correct Answer is:A
Step by step video & image solution for V - T graph for a given mass of an ideal gas is shown in the figure. Then the corresponding P - V graph would be (BC and DA are vertical lines , CD is horizontal line ) by Physics experts to help you in doubts & scoring excellent marks in Class 12 exams.
Updated on:21/07/2023Topper's Solved these Questions
Similar Questions
Knowledge Check
The P−T graph for the given mass of an ideal gas is shown in figure. Then the volume
_E01_022_Q01.png) AincreasesBdecreasesCremains constantDdata insuficient
AincreasesBdecreasesCremains constantDdata insuficientThe slope of T−P graph for a given mass of a gas increases, the volumn of the gas
AincreasesBdecreasesCdoes not changeDMay increase or decreases.V−T diagram for a process of given mass of ideal gas is as shown in fig. During the process pressure of the gas
_E01_072_Q01.png) AFirst increases then decreasesBFirst decreases then increasesCcontinously decreasesDcontinously increases
AFirst increases then decreasesBFirst decreases then increasesCcontinously decreasesDcontinously increases
V-T graph of a process of monoatomic ideal gas is shown in figure.
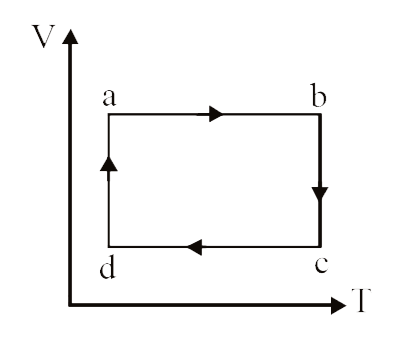
Heat is supplied to the gas in process(s)-
View SolutionV-T graph of a process of monoatomic ideal gas is shown in figure.
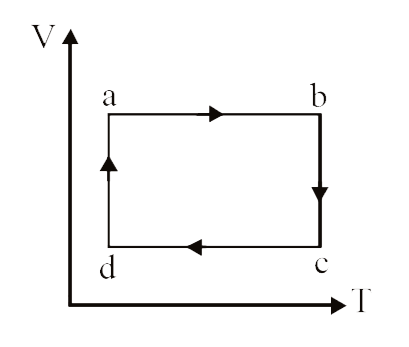
Sum of work done by the gas in process abod is-
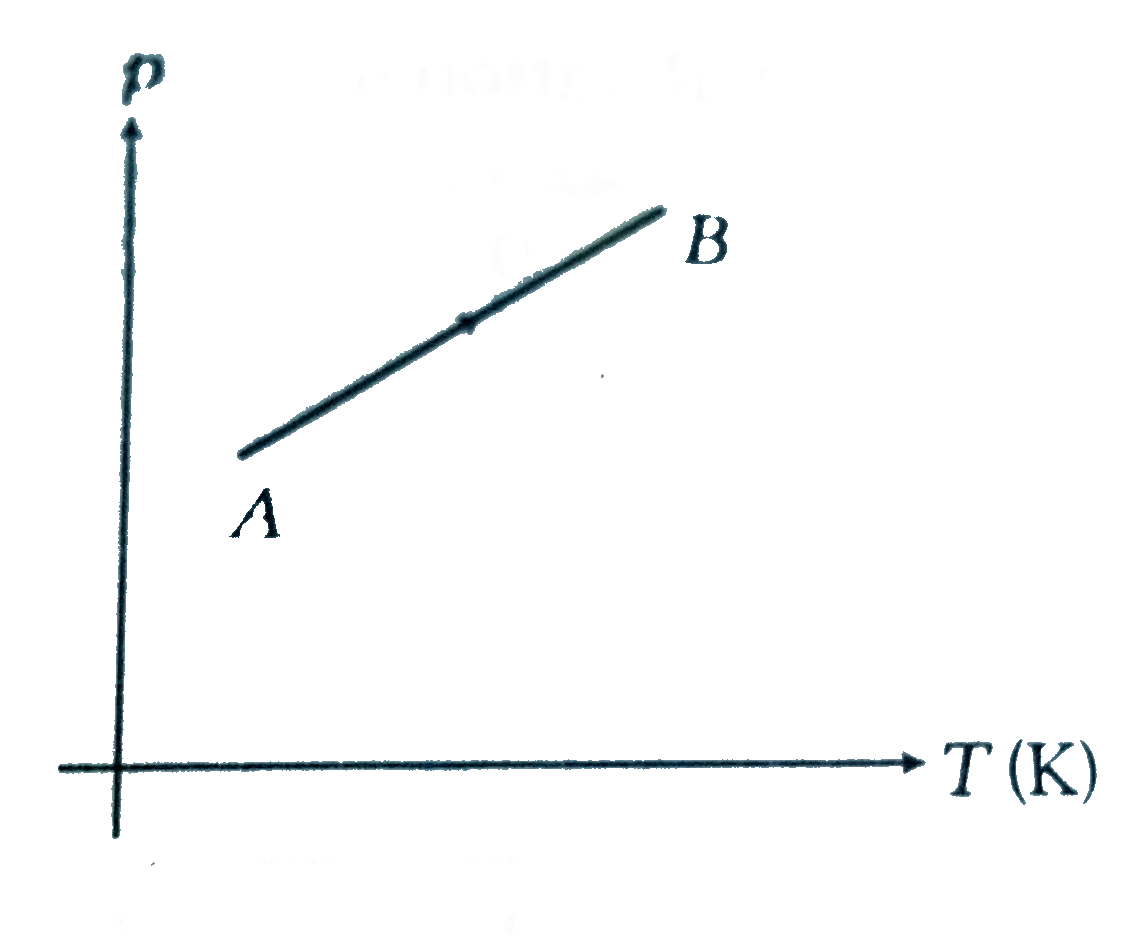
View SolutionThe p−T graph for the given mass of an ideal gas is shown in figure. What inference can be drawn regarding the change in Volume (whtherit is constant, increasing or decreasing) ?
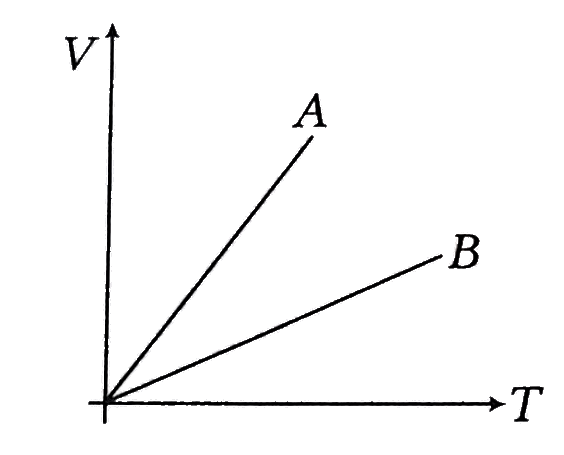
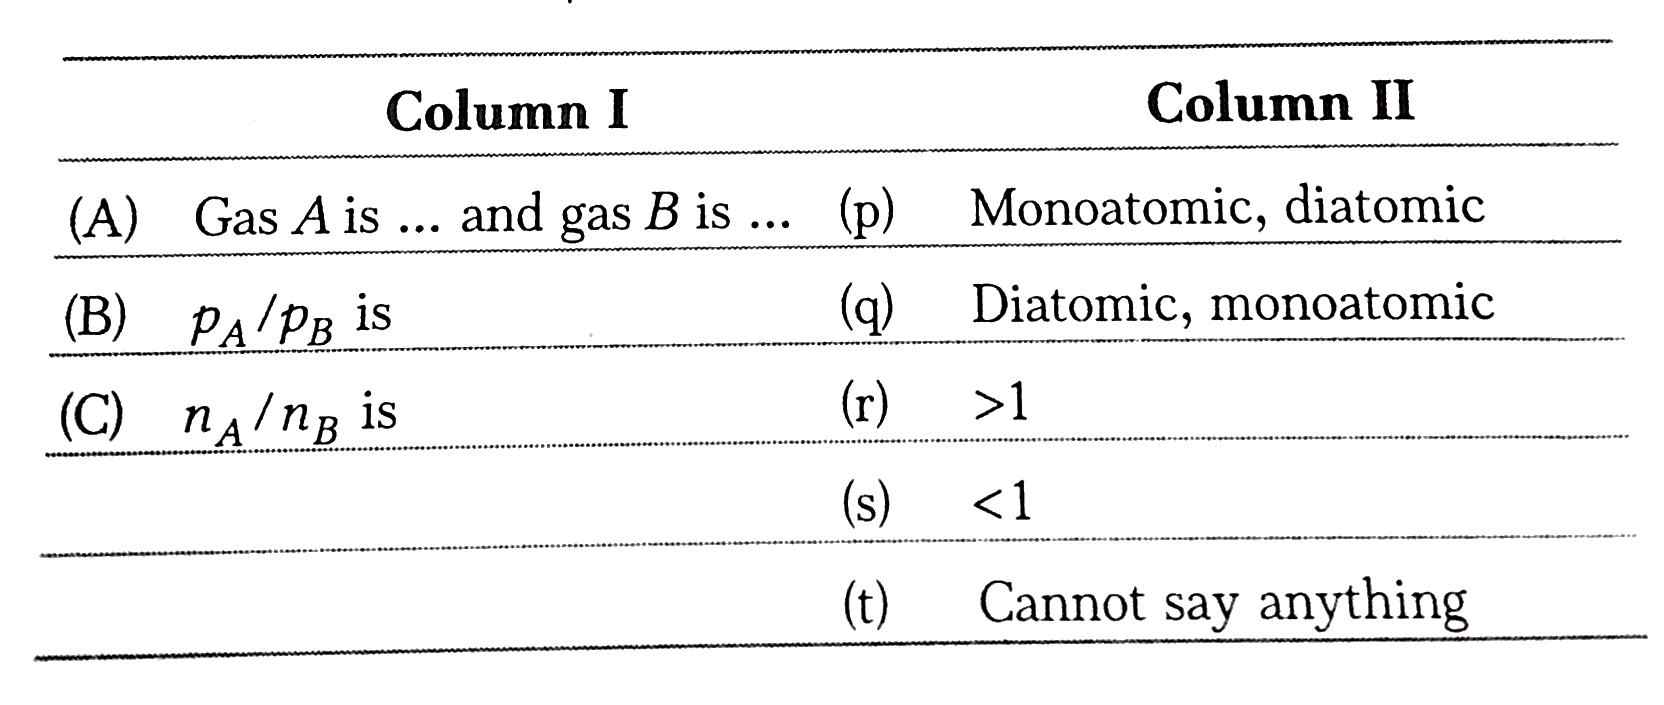
View SolutionIn the V-T graph shown in the figure match the following columns.
View Solutiongraph of an ideal gas is as shown in figure.
Heat is supplied to the gas in process (s).
View Solution

