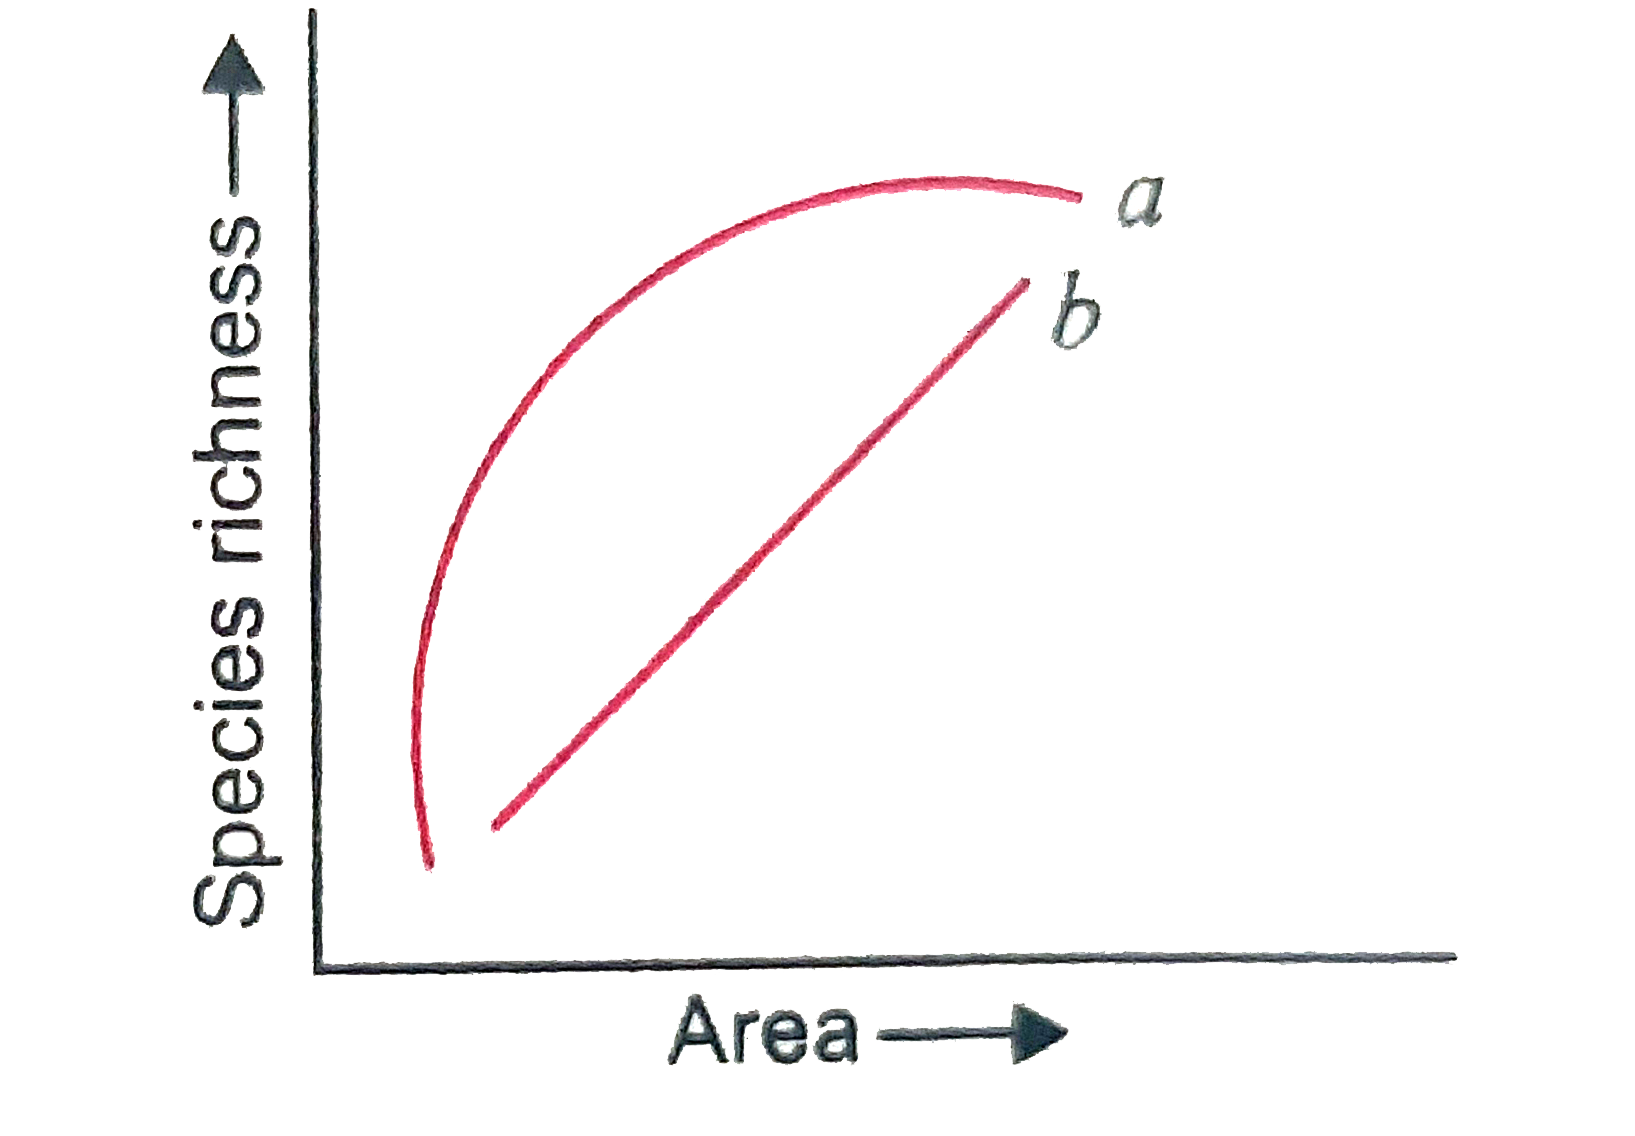
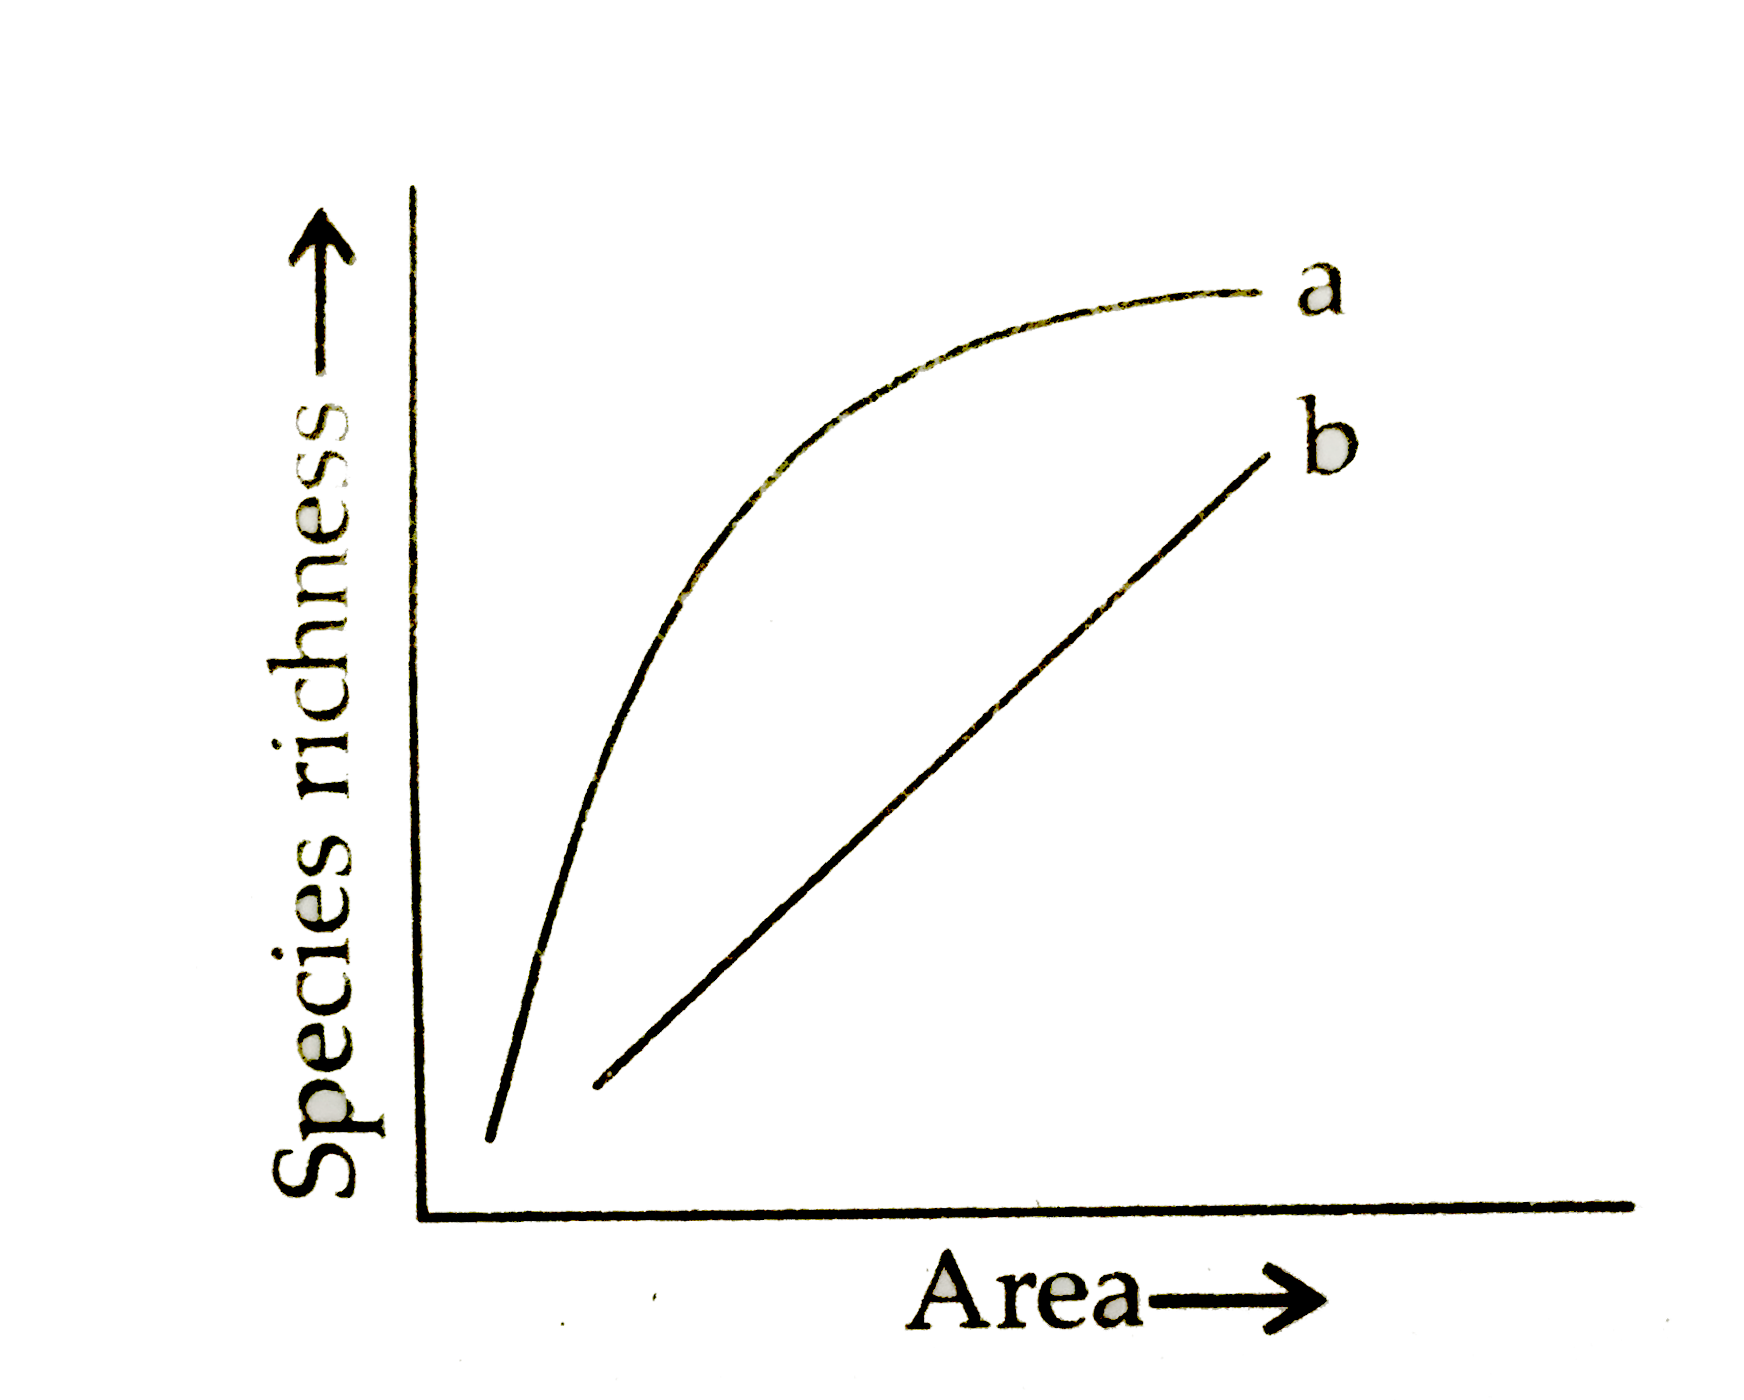
In the polt of the species - area relationship for the co-efficient z, the axis X and Y, represents
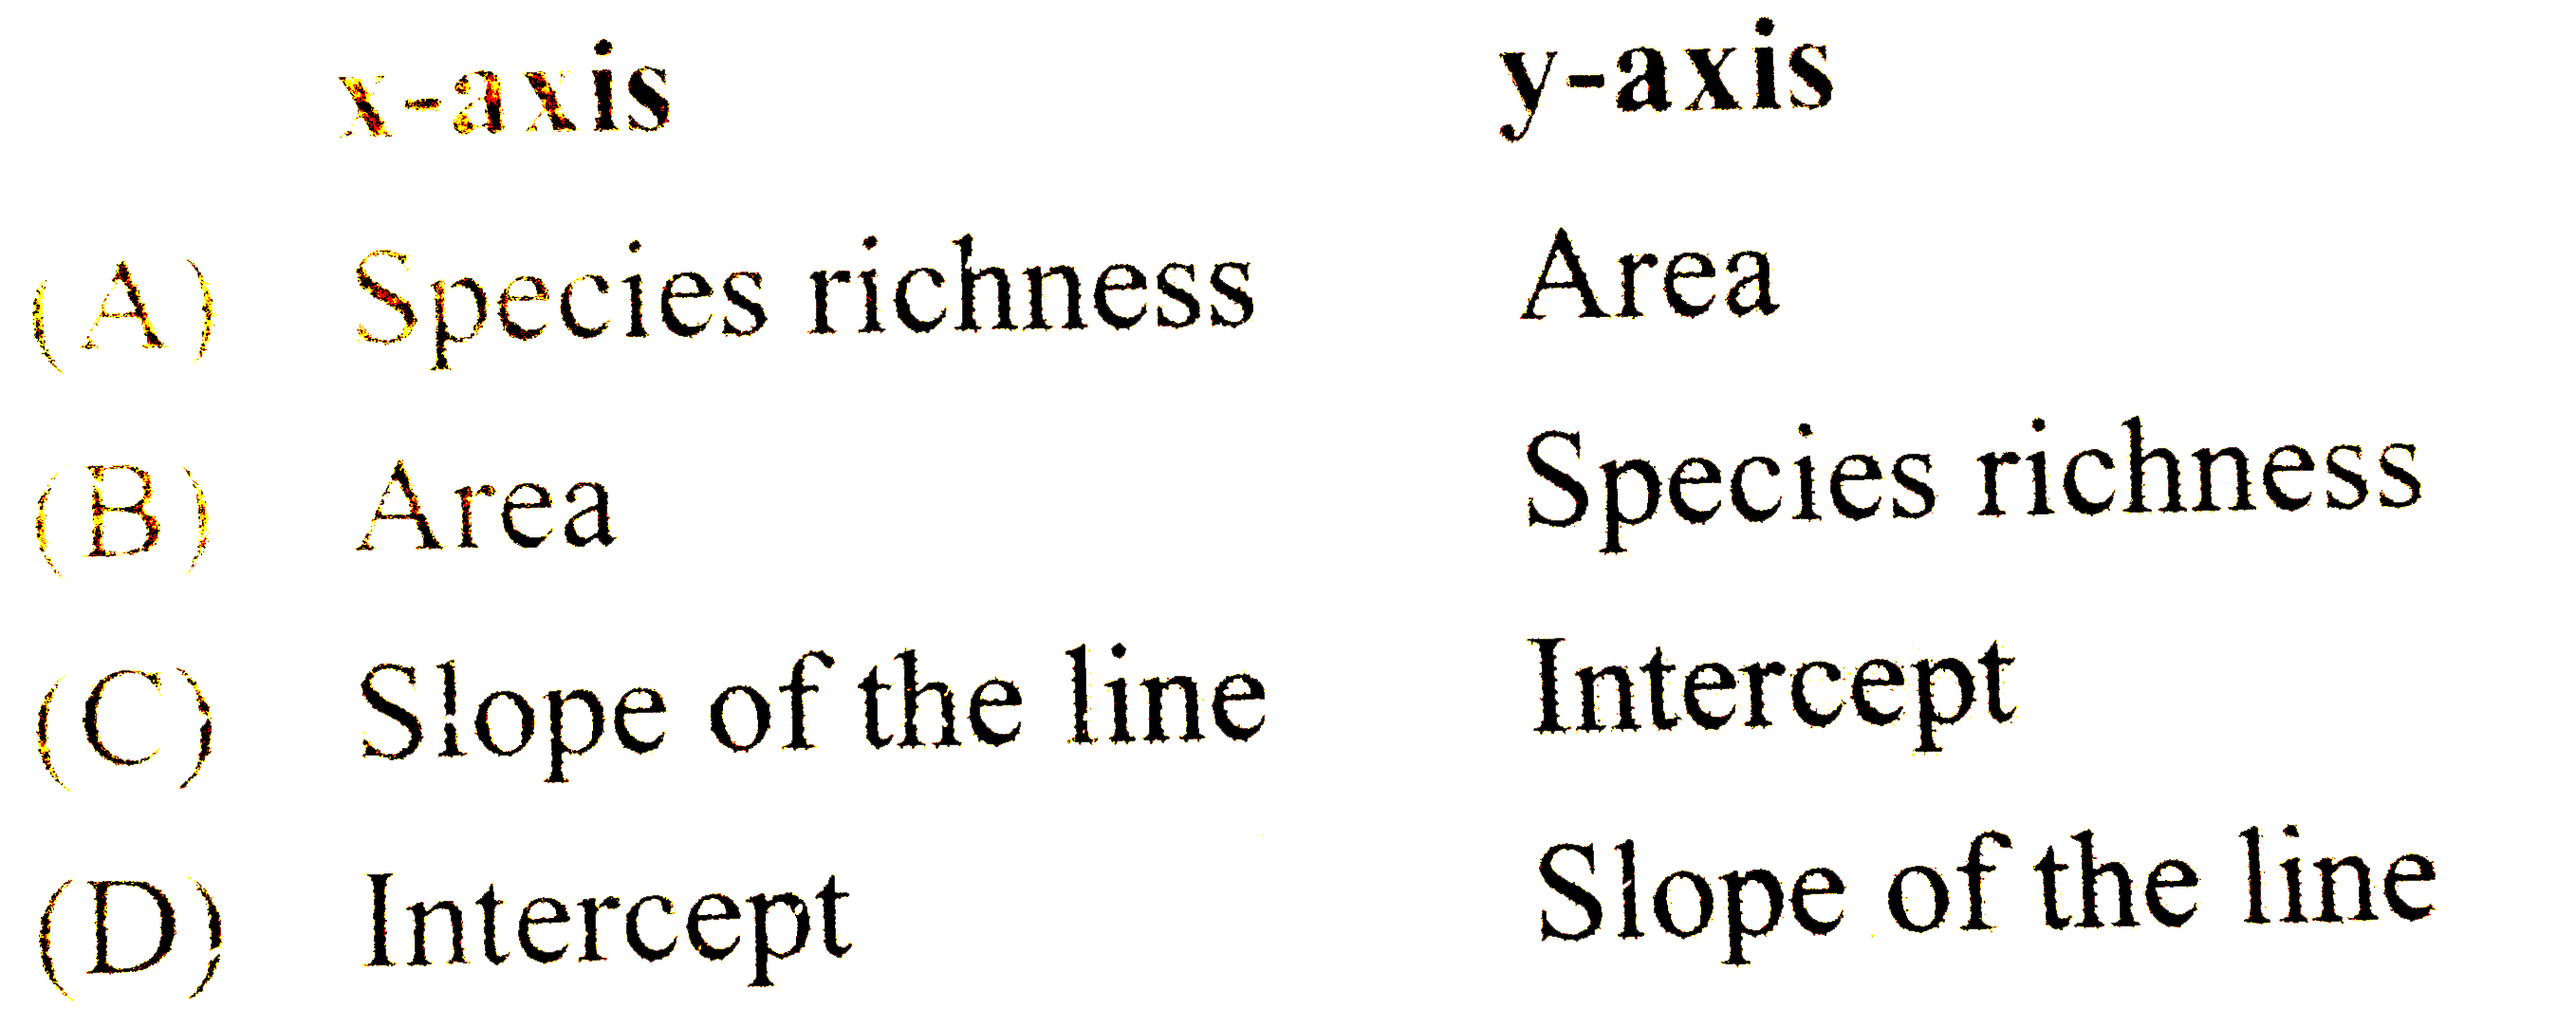
x-axisy - axisSpecies richnessArea
x-axisy - axisAreaSpecies richness
x-axisy - axisSlope of the line Intercept
x-axisy - axisIntercept Slope of the line
The correct Answer is:B
To solve the question regarding the plot of the species-area relationship for the coefficient z, we need to identify what the X and Y axes represent in this context.
1. Understanding the Species-Area Relationship:
- The species-area relationship is a fundamental ecological concept that describes how the number of species (species richness) increases with the area available for them to inhabit.
2. Identifying the Axes:
- In the context of the species-area relationship, the X-axis typically represents the area of the habitat being studied.
- The Y-axis represents the number of species (species richness) that can be found in that area.
3. Conclusion:
- Therefore, in the plot of the species-area relationship for the coefficient z, the X-axis represents the area, and the Y-axis represents species richness.
Final Answer:
- X-axis: Area
- Y-axis: Species Richness
- The species-area relationship is a fundamental ecological concept that describes how the number of species (species richness) increases with the area available for them to inhabit.
- In the context of the species-area relationship, the X-axis typically represents the area of the habitat being studied.
- The Y-axis represents the number of species (species richness) that can be found in that area.
- Therefore, in the plot of the species-area relationship for the coefficient z, the X-axis represents the area, and the Y-axis represents species richness.
- X-axis: Area
- Y-axis: Species Richness
Topper's Solved these Questions
Similar Questions
Knowledge Check
Species area relationship was given by
AAlexander von HumboldtBPaulCMayerDBoth (a) and (b)Species area relationship was given by :-
ARobert constranzaBAlexander von humboldtCAlexander flemmingDStamford ecologist Paul EhrlichSpecies-Area relationship was given by
ABritish zoologist and geographer David TilmanBGerman botanist and geographer Alexander von HumboldtCGerman naturalist and geographer Alexander von HumboldtDBritish naturalist and geographer Alexander von Huboldt
The given graph shows species-area relationship. Write the equation of the curve 'a' and explain.

View SolutionIn the equation of the species - area relationship , the letter 'C' and 'Z' represent:
View SolutionAccording to the concept of species-area relationship.
View SolutionThe hyperbolic equation for the species area relationship is
View SolutionIn the equation of species-area relationship, the letter 'C' and 'Z' represent
View Solution


