A student noted the number of cars passing through a spot on a road for 100 periods each of 3 minutes and summarised it in the table given below. Find the mode of the data :

Modal Class is the class with the highest frequency
Mode = l+[f1−f02f1−f0−f2]×h
Here,
Class size, h
Lower limit of modal class, l
Frequency of modal class, f1
Frequency of class preceding modal class, f0
Frequency of class
succeeding the modal class, f2
From the table, it can be observed that the maximum class frequency is 20, belonging to class interval 40 − 50
Therefore, modal class = 40 − 50
Class size, h = 10
Lower limit of modal class, l = 40
Frequency of modal class, f1=20
Frequency of class preceding modal class, f0=12
Frequency of class
succeeding the modal class, f2=11
Mode = l+[f1−f02f1−f0−f2]×h
=40+[20−122×20−12−11]×10
=40+[840−23]×10
=40+(817)×10
=40+4.705
=44.705
≈44.7
Hence, the mode is 44.7
Topper's Solved these Questions
- BOOK - NCERTCHAPTER - STATISTICSEXERCISE - EXERCISE 14.19videos
STATISTICS
- BOOK - NCERTCHAPTER - STATISTICSEXERCISE - EXERCISE 14.43videos
STATISTICS
- BOOK - NCERTCHAPTER - SOME APPLICATIONS OF TRIGONOMETRYEXERCISE - SOLVED EXAMPLES7videos
SOME APPLICATIONS OF TRIGONOMETRY
- BOOK - NCERTCHAPTER - SURFACE AREAS AND VOLUMESEXERCISE - EXERCISE 13.28videos
SURFACE AREAS AND VOLUMES
Similar Questions
A student noted the number of cars passing through a spot on a road for 100 periods each of 3 minutes and summarised it in the table given below. Find the mode of the data :
 View Solution
The bar graph below shows the number of cars passed through a toll tax
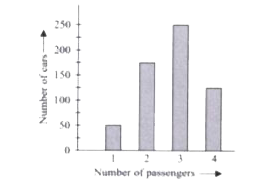
Find the total number of cars passed through the toll taxView Solution
Knowledge Check
- Question 1 - Select One
The given histogram shows the frequency distribution of the speed of cars passing through a particular spot on a highway. Read the graph and answer the following question.
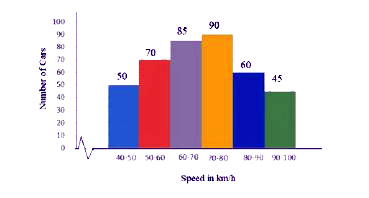
What is the ratio of the number of cars with speed less than 60 km h to the number of cars with speed more than 70 km/h?A13:8B8:5C8:13D5:8
The bar graph below shows the number of cars passed through a toll tax
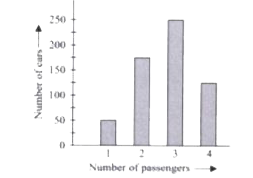
Find the total number of cars passed through the toll taxView SolutionAnswer the questions based on the information given below:
The given cascade bar graph provides the information about the number of girls and boys participated in a dance competition of NH Goel school on five different days of a week and the table give the details about the percentage of students participated on different days who lost the competition.
Total number of students participated in a day = Number of girls participated in a day + Number of boys participated in a day
Total number of students participated = Total number of students who lost the competition participated + Total number of students who won the competition participated
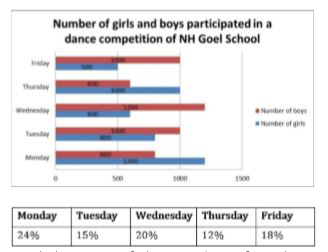
Find the ratio of the number of students who lost the competition on Tuesday to the number of students who won the competition on Wednesday.View SolutionAnswer the questions based on the information given below:
The given cascade bar graph provides the information about the number of girls and boys participated in a dance competition of NH Goel school on five different days of a week and the table give the details about the percentage of students participated on different days who lost the competition.
Total number of students participated in a day = Number of girls participated in a day + Number of boys participated in a day
Total number of students participated = Total number of students who lost the competition participated + Total number of students who won the competition participated
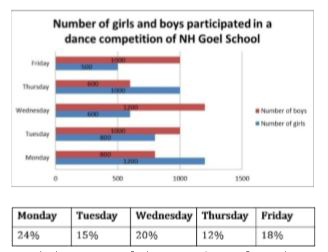
Find the ratio between the number of students who won on Wednesday to the number of students who won on ThursdayView SolutionCatherine threw a dice 40 times and noted the number appearing each time as shown below :

Make a table and enter the data using tally marks. Find the number that appeared.
Find those numbers that appear an equal number of times.View SolutionFollowing table shows a frequency distribution for the speed of cars passing through at a particular spot on a high way.

Draw a histogram and frequency polygon representing the data above.View SolutionThe table given below represents the marks obtained by 5 students in 4 different subjects. Each student was given marks out of 100 in each of the given subjects.

The average marks per student in English is what per cent of the average marks per student in Hindi ?View SolutionA survey was carried out in a certain school to find out the popular school subjects among students of Classes VI to VIII. The data in this regard is displayed as pictograph given below:

Find the number of students who like subjects other than Mathematics and Science.View Solution

