The bar graph below shows the number of cars passed through a toll tax
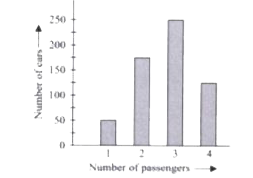
Find the total number of cars passed through the toll tax
9123%
9245%
6713%
4713%
Step by step video & image solution for The bar graph below shows the number of cars passed through a toll tax Find the total number of cars passed through the toll tax by Maths experts to help you in doubts & scoring excellent marks in Class 7 exams.
Updated on:21/07/2023Topper's Solved these Questions
- DATA HANDLINGBOOK - MTG IIT JEE FOUNDATIONCHAPTER - DATA HANDLINGEXERCISE - Exercise (Level - 2) Subjective Problems
10 Videos
- CONGRUENCE OF TRIANGLES BOOK - MTG IIT JEE FOUNDATIONCHAPTER - CONGRUENCE OF TRIANGLES EXERCISE - Olympiad/HOTS Corner
10 Videos
- EXPONENTS AND POWERSBOOK - MTG IIT JEE FOUNDATIONCHAPTER - EXPONENTS AND POWERSEXERCISE - OLYMPIAD/HOTS CORNER
15 Videos
Similar Questions
Knowledge Check
What is the total number of circles passing through the two fixed points?
A1B2C4DInfiniteThe Bar graph given below presents the number of cars parked on ten different days in a parking area
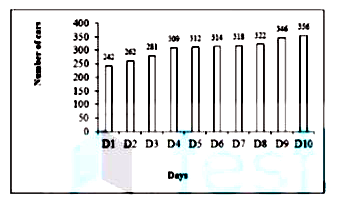
What is the total number of cars parked on all the ten days in the parking area ?AA) 3862BB) 3062CC) 3462DD) 3882The graph of y =x passes through the point
A(52,−52)B(0,52)C(1,1)D(−12,12)
The given bar graph, shows the number of students in different classes.
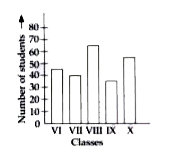
Find the total number of students in the classes VIII to X.
View SolutionThe Bar graph given below presents the number of cars parked on ten different days in a parking area
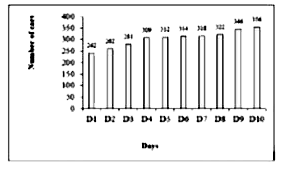
Number of cars parked on D10 how much percentage (correct up to two decimal places) more the number of cars parked on DI ?
View SolutionIf the number of cars sold of model D is 72900, then what is the total number of cars sold of all the models together by the company?
View SolutionThe number of planes passing through 3 non-collinear points is
View SolutionThe table shows the number of cars sold by three showrooms over a period of six year.
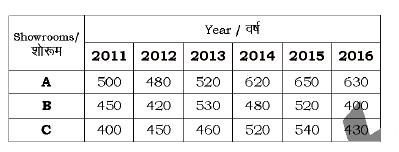
The total number of cars sold by all three showrooms over the years is represented as a pie chart, what is the central angle of the sector representing the total number of cars sold in the year 2013
View Solution

