Draw graph showing the variation of electronic field & electronic potential with distance 'r' due to point change.
To solve the problem of drawing the graphs showing the variation of electric field (E) and electric potential (V) with distance (r) due to a point charge, we will follow these steps:
Step 1: Understand the Formulas
The electric field (E) due to a point charge (q) at a distance (r) is given by:
E=kqr2
where k is the electrostatic constant.
The electric potential (V) due to a point charge (q) at a distance (r) is given by:
V=kqr
Step 2: Analyze the Behavior of E and V
- As r approaches 0, E approaches infinity, and V also approaches infinity.
- As r approaches infinity, both E and V approach 0.
Step 3: Graph the Electric Field (E) vs. Distance (r)
1. Y-axis: Electric Field (E)
2. X-axis: Distance (r)
3. The graph of E vs. r will be a curve that starts from infinity at r=0 and decreases towards 0 as r increases. This is because E is inversely proportional to r2.
Step 4: Graph the Electric Potential (V) vs. Distance (r)
1. Y-axis: Electric Potential (V)
2. X-axis: Distance (r)
3. The graph of V vs. r will also be a curve that starts from infinity at r=0 and decreases towards 0 as r increases. This is because V is inversely proportional to r.
Step 5: Combine Both Graphs
1. Draw both curves on the same graph with E and V on the Y-axis and r on the X-axis.
2. Identify the point where E and V are equal. This occurs at a specific distance r which can be calculated by setting E=V:
kqr2=kqr
Simplifying gives r=1 (assuming kq is constant).
Step 6: Analyze Regions
- For r<1: The electric field (E) is greater than the potential (V).
- For r>1: The potential (V) is greater than the electric field (E).
Final Graph
- The graph will show two curves: one for electric field (E) that decreases faster than the electric potential (V) as r increases.
- At r=1, both curves intersect, indicating that at this point, the electric field and potential are equal.
The electric field (E) due to a point charge (q) at a distance (r) is given by:
E=kqr2
where k is the electrostatic constant.
V=kqr
- As r approaches 0, E approaches infinity, and V also approaches infinity.
- As r approaches infinity, both E and V approach 0.
1. Y-axis: Electric Field (E)
2. X-axis: Distance (r)
3. The graph of E vs. r will be a curve that starts from infinity at r=0 and decreases towards 0 as r increases. This is because E is inversely proportional to r2.
1. Y-axis: Electric Potential (V)
2. X-axis: Distance (r)
3. The graph of V vs. r will also be a curve that starts from infinity at r=0 and decreases towards 0 as r increases. This is because V is inversely proportional to r.
1. Draw both curves on the same graph with E and V on the Y-axis and r on the X-axis.
2. Identify the point where E and V are equal. This occurs at a specific distance r which can be calculated by setting E=V:
kqr2=kqr
Simplifying gives r=1 (assuming kq is constant).
- For r<1: The electric field (E) is greater than the potential (V).
- For r>1: The potential (V) is greater than the electric field (E).
- The graph will show two curves: one for electric field (E) that decreases faster than the electric potential (V) as r increases.
- At r=1, both curves intersect, indicating that at this point, the electric field and potential are equal.
Topper's Solved these Questions
- ELECTROSTATICS AND CURRENT ELECTRICITY BOOK - CBSE COMPLEMENTARY MATERIALCHAPTER - ELECTROSTATICS AND CURRENT ELECTRICITY EXERCISE - SHORT ANSWER QUESTIONS (2 MARKS)
59 Videos
- ELECTROSTATICS AND CURRENT ELECTRICITY BOOK - CBSE COMPLEMENTARY MATERIALCHAPTER - ELECTROSTATICS AND CURRENT ELECTRICITY EXERCISE - SHORT ANSWER QUESTIONS (3 MARKS )
23 Videos
- ELECTRONIC DEVICES BOOK - CBSE COMPLEMENTARY MATERIALCHAPTER - ELECTRONIC DEVICES EXERCISE - NUMERICALS
7 Videos
- SAMPLE QUESTION PAPER 2019BOOK - CBSE COMPLEMENTARY MATERIALCHAPTER - SAMPLE QUESTION PAPER 2019EXERCISE - Section C
19 Videos
Similar Questions
Draw a plot showing the variation of (i) electric field E, and (ii) electric potential V with distance 'r' due to a point charge Q.
View SolutionUsing Gauss' law deduce the expression for the electric field due to uniformaly charged spherical conducting shell of radius R at point (i) outside ,and (ii) inside the shell.
Plot a graph showing variation of electric field as a functions or r for r< R and .(r being the distance from the centre of the shell).
View Solution
Knowledge Check
The diagram showing the variation of gravitational potential of earth with distance from the centre of earth is
A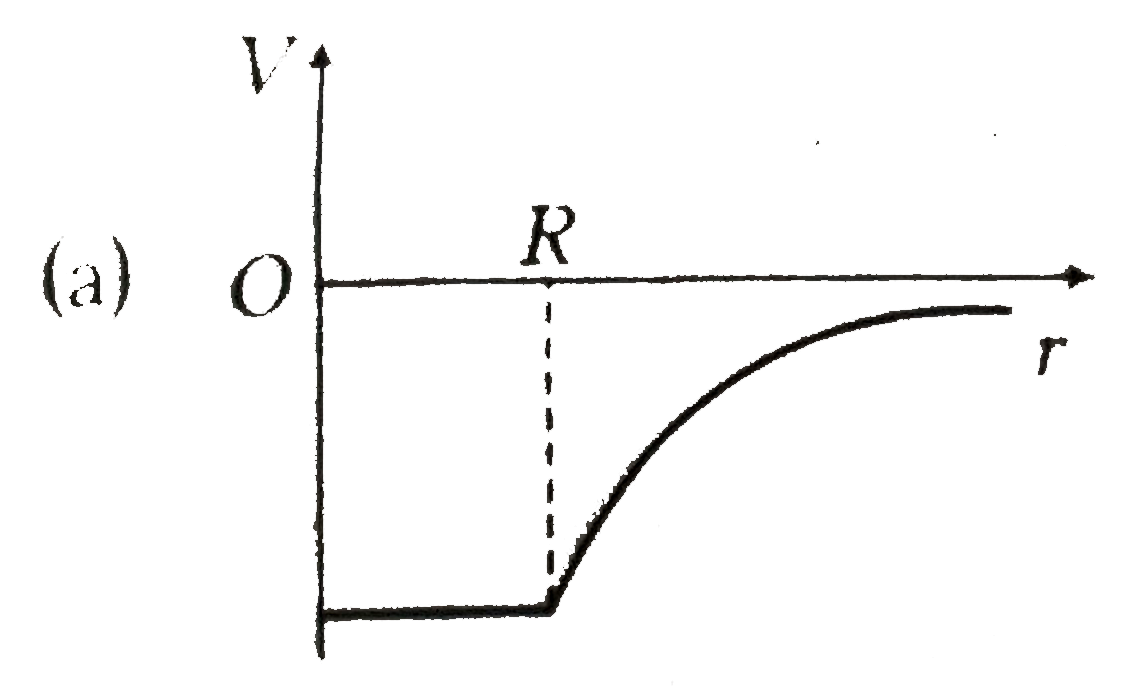 B
B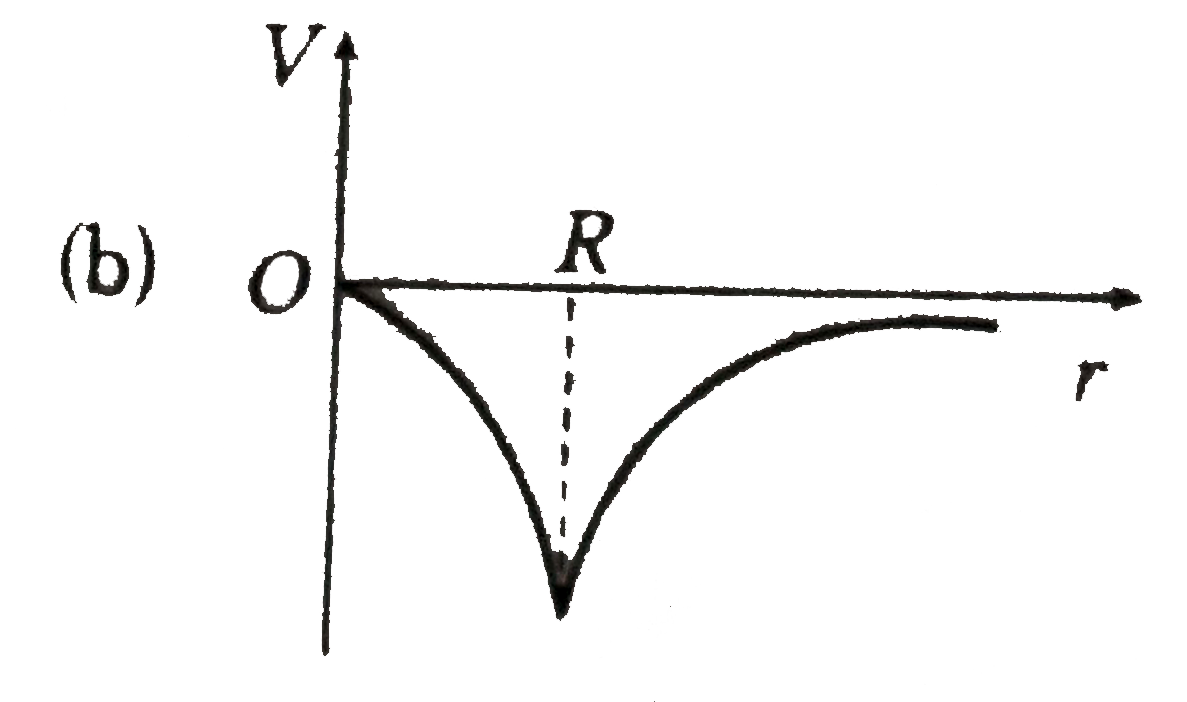 C
C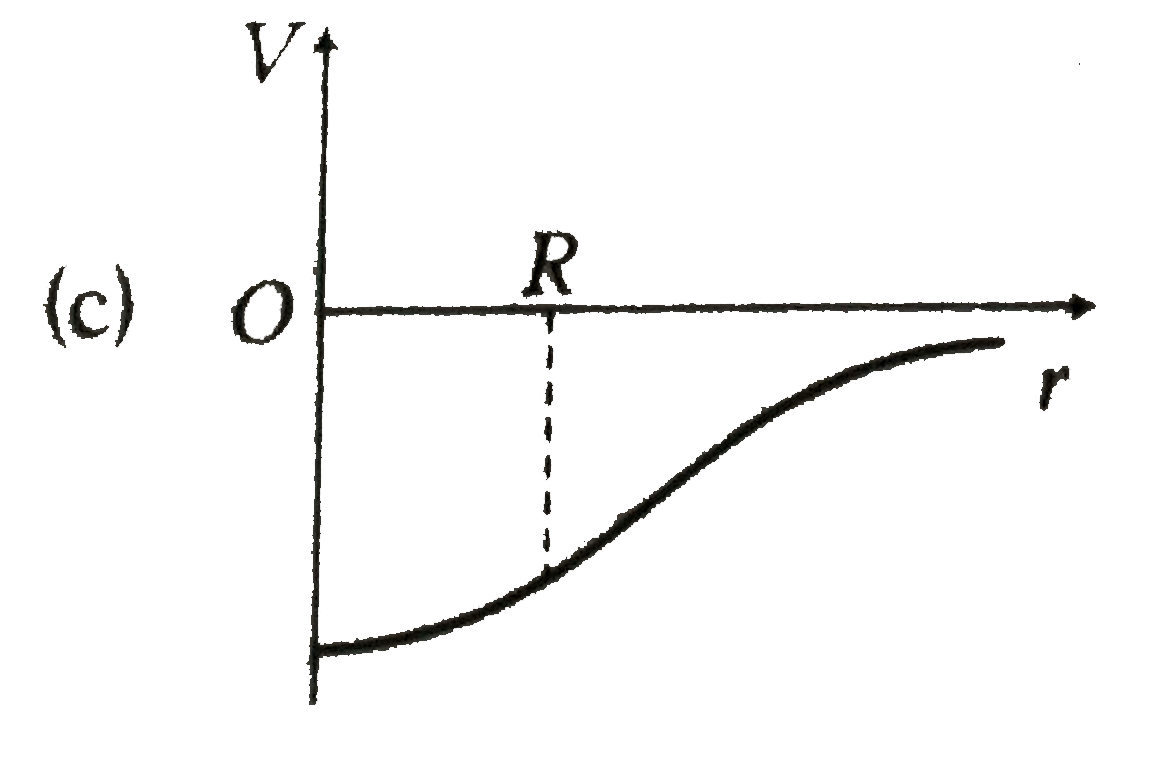 D
D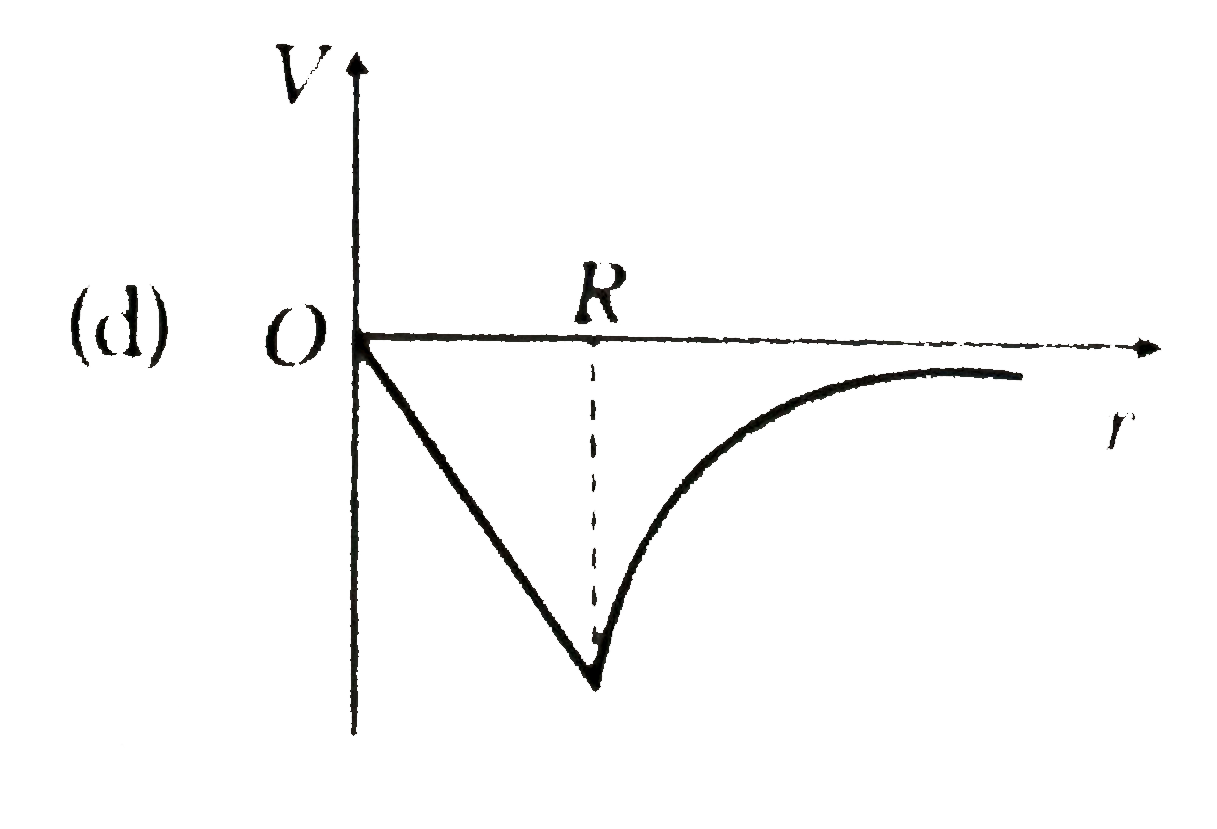
The diagram showing the variation of gravitational potential of earth with distance from the centre of earth is
A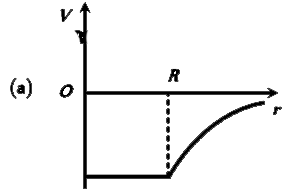 B
B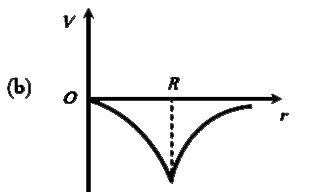 C
C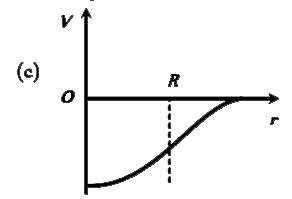 D
D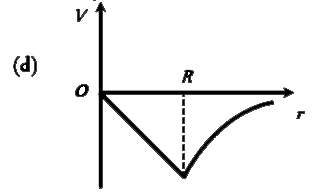
Draw a graph showing the variation of decay rate with number of active nuclei.
View SolutionDraw a graph showing the variation of decay rate with number of active nuclei.
View SolutionThe graph showing the variation of the magnetic field strength (B) with distance (r) from a long current carrying conductor is.

View Solution(a) Use Gauss's law to show that due to a uniformly charged spherical shell of radius R, the electric field at any point situated outside the shell at a distance r from its centre is equal to the electric field at the same point, when the entire charge on the shell were concentrated at its centre. Also plot the graph showing the variation of electric field with r, for r≤R and r≥R. (b) Two point charges of +1μC and +4μC are kept 30 cm apart. How far from the +1μC charge on the line joining the two charges, will the net electric field be zero ?
View SolutionDraw a graph showing the variation of the gravitational acceleration due to the Earth with depth and altitude.
View SolutionDraw graphs showing the variation of acceleration due to gravity with depth below the earth's surface.
View Solution