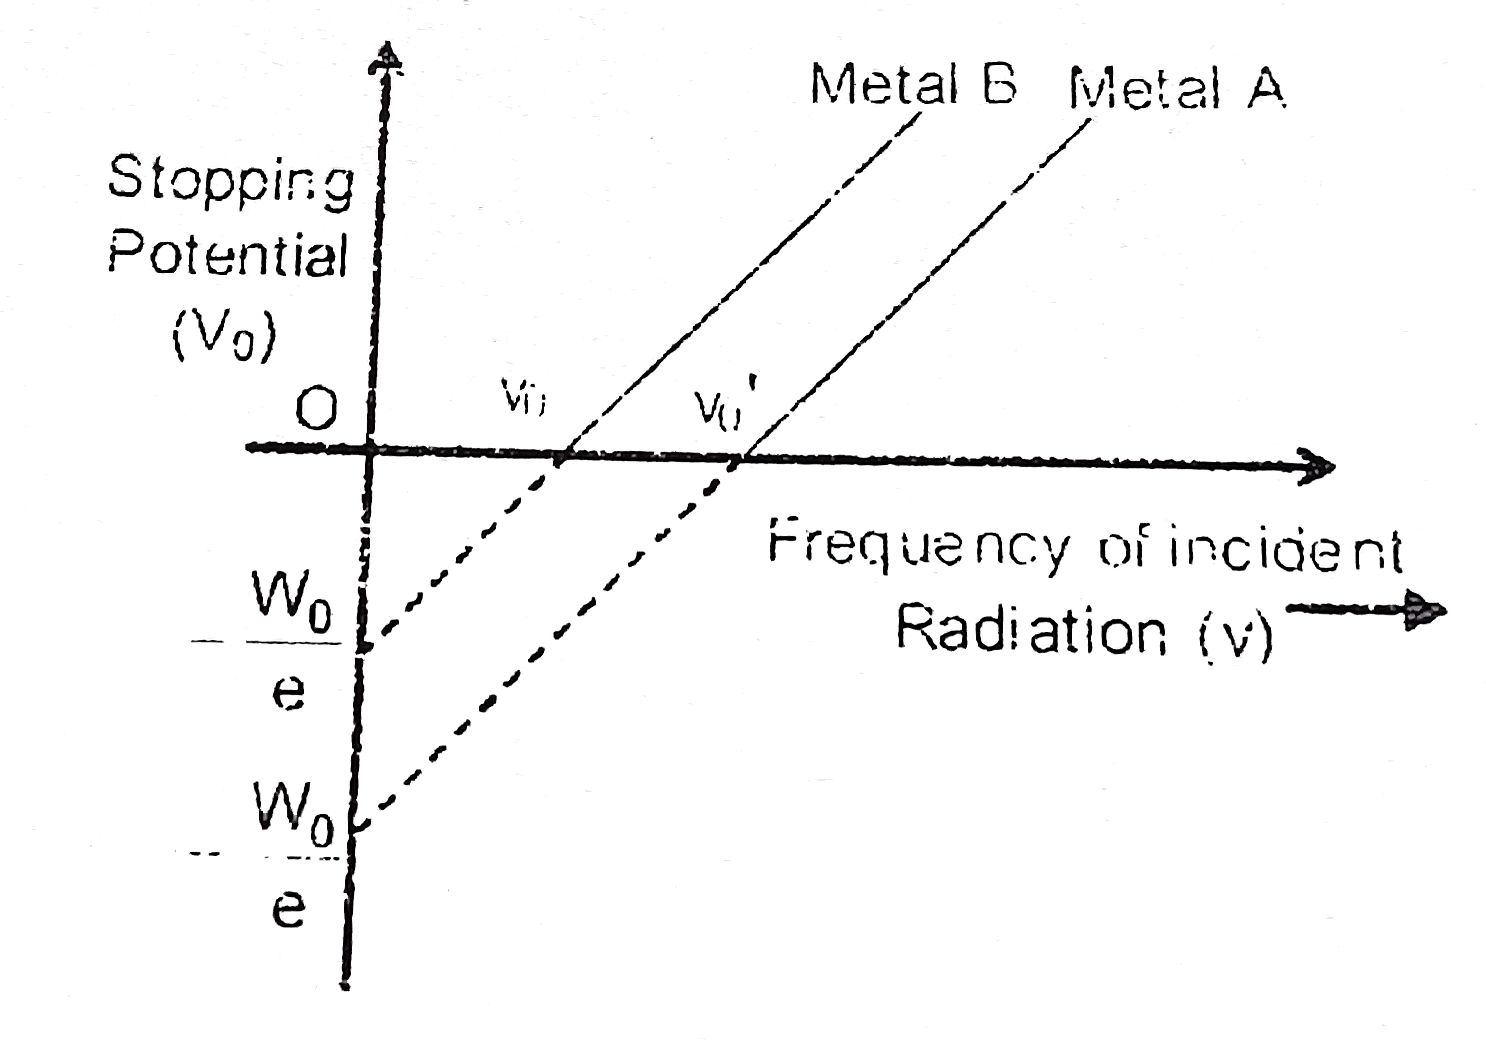
Draw and explain the graph showing the variation of stopping potential with frequency of incident radiation in relation to photoelectric effect.
Step by step video & image solution for Draw and explain the graph showing the variation of stopping potential with frequency of incident radiation in relation to photoelectric effect. by Physics experts to help you in doubts & scoring excellent marks in Class 12 exams.
Updated on:21/07/2023Topper's Solved these Questions
- DUAL NATURE OF MATTER AND RADIATION & ATOMS AND NUCLEIBOOK - CBSE COMPLEMENTARY MATERIALCHAPTER - DUAL NATURE OF MATTER AND RADIATION & ATOMS AND NUCLEIEXERCISE - VERY SHORT ANSWER QUESTIONS (2 mark)
39 Videos
- DUAL NATURE OF MATTER AND RADIATION & ATOMS AND NUCLEIBOOK - CBSE COMPLEMENTARY MATERIALCHAPTER - DUAL NATURE OF MATTER AND RADIATION & ATOMS AND NUCLEIEXERCISE - VERY SHORT ANSWER QUESTIONS (3 mark)
22 Videos
- DUAL NATURE OF MATTER AND RADIATION & ATOMS AND NUCLEIBOOK - CBSE COMPLEMENTARY MATERIALCHAPTER - DUAL NATURE OF MATTER AND RADIATION & ATOMS AND NUCLEIEXERCISE - Long Answer Question
22 Videos
- CBSE EXAMINATION PAPER, DELHI REGION - 2015 (CODE NO. 55/1/1/D)BOOK - CBSE COMPLEMENTARY MATERIALCHAPTER - CBSE EXAMINATION PAPER, DELHI REGION - 2015 (CODE NO. 55/1/1/D)EXERCISE - SECTION E
6 Videos
- ELECTROMAGNETIC WAVES AND OPTICSBOOK - CBSE COMPLEMENTARY MATERIALCHAPTER - ELECTROMAGNETIC WAVES AND OPTICSEXERCISE - 1 mark question
11 Videos
Similar Questions
Draw a graph showing the variation of stopping potential with frequency of the incident radiation. What does the slope of the line with frequency axis indicate? What information can be obtained from the values of intercept on the potential axis?
View SolutionDefine photoelectric effect. Draw a graph to show the variation of stopping potential with frequency of incident radiation on a metal plate.
View Solution
Knowledge Check
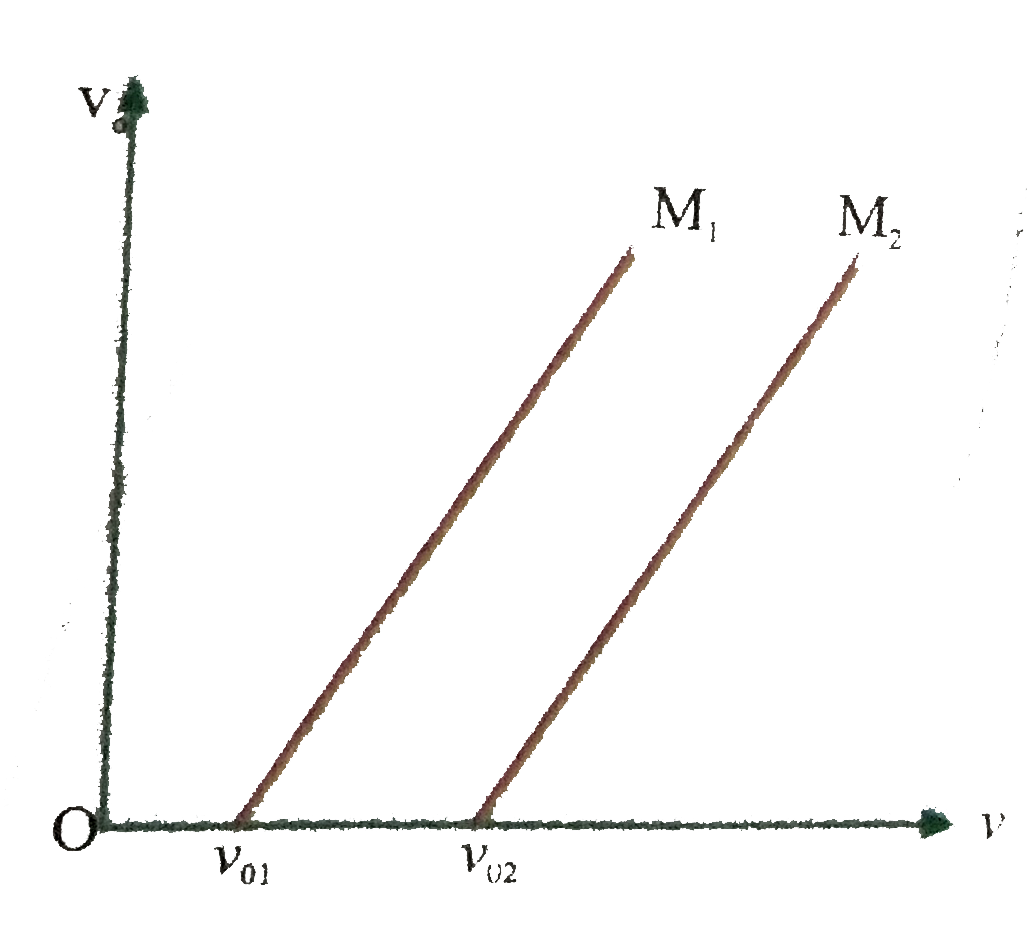
Figure show the variation of the stopping potential (V0) with the frequency (v) of the incident radiations for two different photosensitive matererial M1 and M2 What are the values of work functions for M1 and M2 respectively
 Ahv01,hv02Bhv02,hv01Chv01,hv01Dhv02,hv02
Sketch the graphs showing variation of stopping potential with frequency of incident radiations for two photosensitive materials A and B having threshold frequencies vA>vB.
(i) In which case is the stopping materials A and B having threshold frequencies vA>VB.
(i) In which case is the stopping potential more and why?
(ii) Does the slope of the graph depend on the nature of the materials used ? Explain.
View SolutionDraw a graph showing the variation of stopping potential with frequency of the incident on a metal plate. How can the value of Planck's constant be determined from this graph?
View SolutionPlot a graph showing variation of stopping potential (V0) with the frequency (v) of the incident radiation for a given photosensitive material. Hence, state the significance of the threshold frequency in photoelectric emission.
Using the principle of energy conservation, write the equation relating the energy of incident photon, threshold frequency and the maximum kinetic energy of the emitted photoelectrons.
View SolutionDefine the term 'stopping potential' in relation to photoelectric effect.
View SolutionDefine the term 'stopping potential' in relation to photoelectric effect.
View SolutionThe figure shows the variation of stopping potential VQ with the frequency v of the incident radiations for two photosensitive metals P and
Which metal has smaller threshold wavelength ? Justify your answer.
View SolutionThe graph shows variation of stopping potential V0 versus frequency of incident radiation v for two photosensitive metals A and B. Which of two metals has higher threshold frequency and why?

View Solution
