The modes of travelling to school by 160 students are given below:

Draw a pictograph.
Step by step video & image solution for The modes of travelling to school by 160 students are given below: Draw a pictograph. by Maths experts to help you in doubts & scoring excellent marks in Class 6 exams.
Updated on:21/07/2023Topper's Solved these Questions
Similar Questions
Knowledge Check
The following bar diagram, represents the use of different modes of travel to school by students in a certain locality of the town. Study the graph and answer the questions.
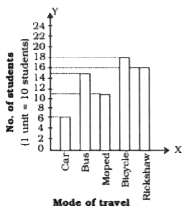
How many students are coming from that locality ?A500B600C560D660The following bar diagram, represents the use of different modes of travel to school by students in a certain locality of the town. Study the graph and answer the questions.
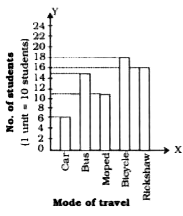
What is the percentage of students using Bus from that locality ?A221433%B1823%C22811%D0.22The following bar diagram, represents the use of different modes of travel to school by students in a certain locality of the town. Study the graph and answer the questions.
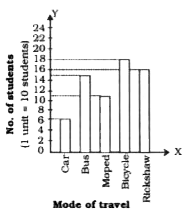
How many students use Bicycle and Rickshaw combined ?A240B340C140D440
70 students from a locality use different modes of transport to go to school as given below:
 Draw the bar graph representing the above data.
View Solution51 students from a locality use different modes of transport to school, as shown by the bar graph given below:
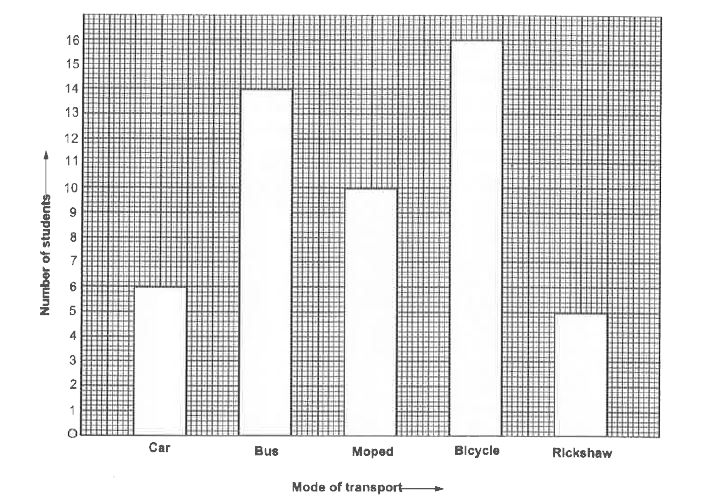
Look at the bar graph given above and answer the question given below:
What does the above bar graph show ?
Which mode of transport is used by maximum number of students ?
How many students use bus for going to school ?
How many students of the locality do not use bus for going to school ?
View SolutionDraw a histogram for the marks of students given below:

View SolutionIn the time table of a school, periods allotted per week to different teaching subjects are given below:

Draw a pie chart for this data.
View SolutionThe following bar diagram, represents the use of different modes of travel to school by students in a certain locality of the town. Study the graph and answer the questions.
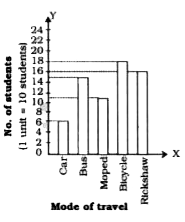
What is the ratio of the students using their means of transport as Car with those using Rickshaw ?
View Solution

