If a graph is plotted between T2 and r3 for a planet then, its slope will be

4π2GM
GM4π2
4πGM
Zero
The correct Answer is:A
Slope =T2R3=4π2GM (From Kepler.s 3rd law)
Topper's Solved these Questions
- GRAVITATIONBOOK - NARAYNACHAPTER - GRAVITATIONEXERCISE - EXERCISE -II (H.W.)
34 Videos
- GRAVITATIONBOOK - NARAYNACHAPTER - GRAVITATIONEXERCISE - EXERCISE -III
42 Videos
- GRAVITATIONBOOK - NARAYNACHAPTER - GRAVITATIONEXERCISE - EXERCISE -I (H.W.)
56 Videos
- FRICTIONBOOK - NARAYNACHAPTER - FRICTIONEXERCISE - Passage type of questions I
6 Videos
- KINETIC THEORY OF GASESBOOK - NARAYNACHAPTER - KINETIC THEORY OF GASESEXERCISE - LEVEL-III(C.W)
52 Videos
Similar Questions
If a graph is plotted between log(a−x) and t, the slope of the straight line is equal to −0.03. The specific reaction rate will be
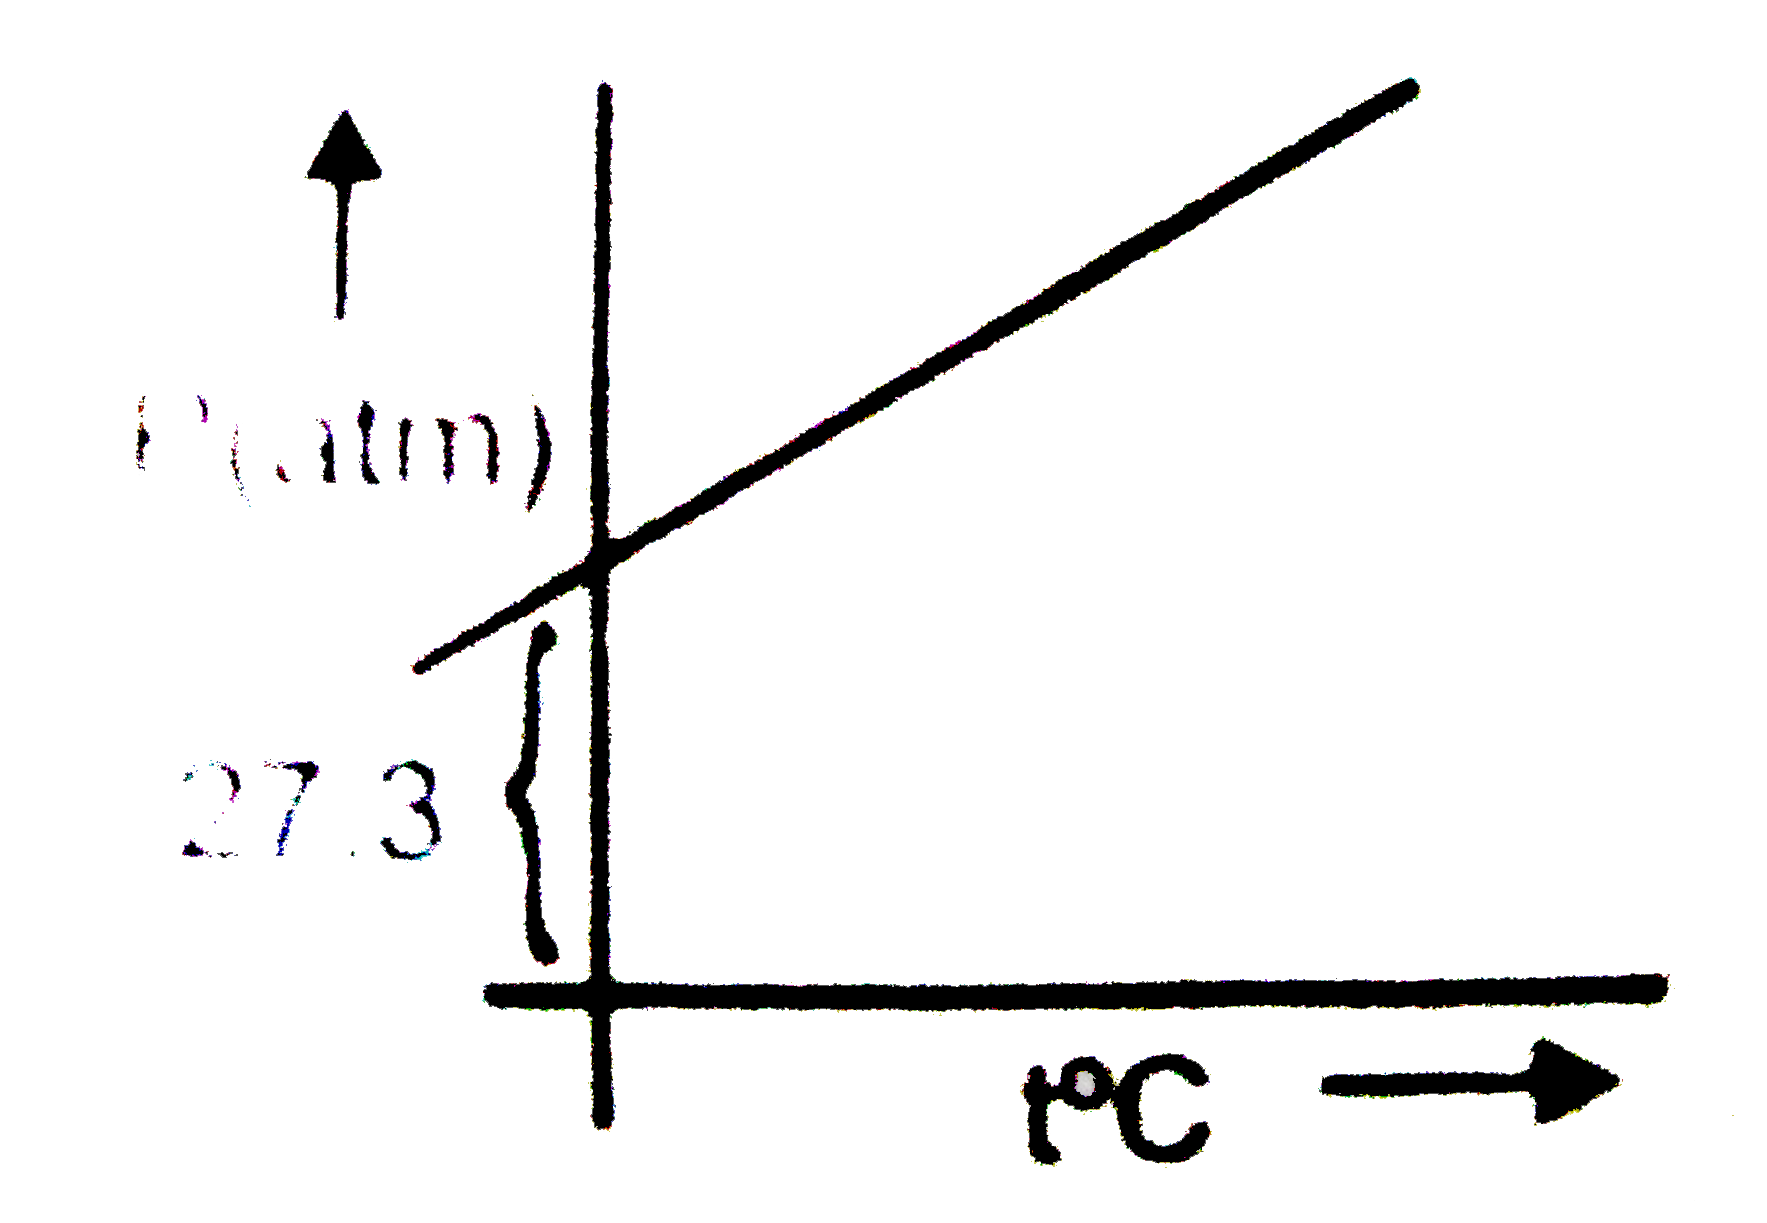
View SolutionA graph is plotted between p (atm) vs t∘C for 10 mol of an ideal gas as follows:
Then slope of curve and volume of container (L) respectively, are:

View Solution
Knowledge Check
If a graph is plotted between log(a−x) and t, the slope of the straight line is equal to −0.03. The specific reaction rate will be
A6.9×10−2B6.9C0.69D6.9×10−4In Arrehenius equation if a graph is plotted between logK and 1/T, the slope of the curve will be:
A−EaRB−Ea2.303RCEaRDEa2.303RIf a graph is plotted between ln k and 1/T for the first order reaction, the slope of the straight line so obtained is given by
A−EaRB−Ea2.303RC−2.303EaRD−Ea2.303
In Searl's experiment a graph is plotted between
View SolutionA graph is plotted between p (atm) vs t∘C for 10 mol of an ideal gas as follows:
Then slope of curve and volume of container (L) respectively, are:

View SolutionMoment of inertia of a sphere of mass M and radius R is I. Keeping M constant if a graph is plotted between I and R, then its form would be
View SolutionIn Searl's experiment a graph is plotted between
View Solutionif a graphs is plotted between the length of a pendulum (l) and its time period (T) then the two guanttities are plotted as _______
(A) l along X-axis
(B) T along Y-axis
View Solution
