In Searl's experiment a graph is plotted between
load on hanger and radius of wire
load on hanger and mean value of spherometer screw reading
radius of the wire and spherometer screw reading
none of these
The correct Answer is:B
To solve the question regarding Searl's experiment and the graph plotted, we can break it down into the following steps:
1. Understanding Searl's Experiment:
- Searl's experiment involves measuring the deformation of a wire when a load is applied. The wire is subjected to a force, and the resulting elongation or displacement is measured.
2. Identifying the Variables:
- In this experiment, the two main variables involved are the load applied on the hanger (F) and the displacement measured by the spherometer (ΔL).
3. Establishing the Relationship:
- The relationship between the applied force (F), the area (A), Young's modulus (Y), and the displacement (ΔL) is given by the formula:
Y=F/AΔL/L
- Rearranging this gives us a direct relationship between the force and the displacement.
4. Plotting the Graph:
- We plot a graph of the applied load (F) on the x-axis against the mean value of the spherometer screw reading (ΔL) on the y-axis. This graph helps us visualize how the displacement changes with varying loads.
5. Conclusion:
- Therefore, in Searl's experiment, the graph is plotted between the load on the hanger (F) and the mean value of the spherometer screw reading (ΔL).
Final Answer:
The graph in Searl's experiment is plotted between the load on the hanger (F) and the mean value of the spherometer screw reading (ΔL).
---
- Searl's experiment involves measuring the deformation of a wire when a load is applied. The wire is subjected to a force, and the resulting elongation or displacement is measured.
- In this experiment, the two main variables involved are the load applied on the hanger (F) and the displacement measured by the spherometer (ΔL).
- The relationship between the applied force (F), the area (A), Young's modulus (Y), and the displacement (ΔL) is given by the formula:
Y=F/AΔL/L
- Rearranging this gives us a direct relationship between the force and the displacement.
- We plot a graph of the applied load (F) on the x-axis against the mean value of the spherometer screw reading (ΔL) on the y-axis. This graph helps us visualize how the displacement changes with varying loads.
- Therefore, in Searl's experiment, the graph is plotted between the load on the hanger (F) and the mean value of the spherometer screw reading (ΔL).
The graph in Searl's experiment is plotted between the load on the hanger (F) and the mean value of the spherometer screw reading (ΔL).
Topper's Solved these Questions
- GENERAL PHYSICSBOOK - DC PANDEY ENGLISHCHAPTER - GENERAL PHYSICSEXERCISE - MCQ_TYPE
17 Videos
- GENERAL PHYSICSBOOK - DC PANDEY ENGLISHCHAPTER - GENERAL PHYSICSEXERCISE - MATCH THE COLUMN
6 Videos
- FLUID MECHANICSBOOK - DC PANDEY ENGLISHCHAPTER - FLUID MECHANICSEXERCISE - Medical entranes gallery
49 Videos
- GRAVITATIONBOOK - DC PANDEY ENGLISHCHAPTER - GRAVITATIONEXERCISE - (C) Chapter Exercises
45 Videos
Similar Questions
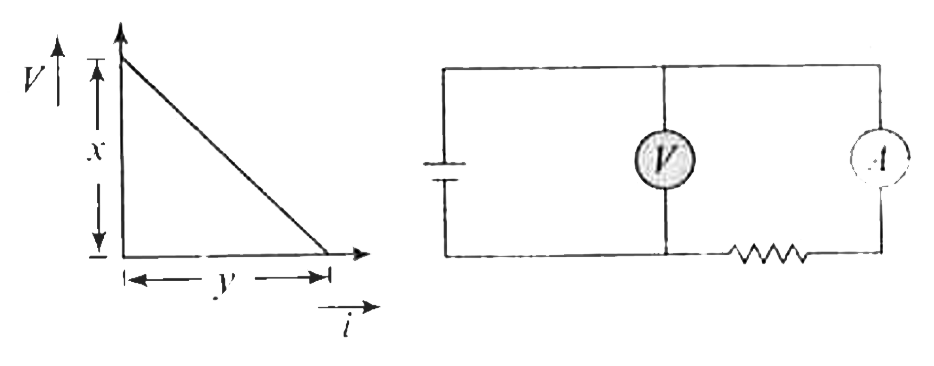
In an experiment, a graph was plotted of the potential difference V between the terminals of a cell against the circuit current "I" by varying load rheostat, internal conductance of the cell is given by

View SolutionIn determining the angle of minimum deviation for a given prism, a graph is plotted between the angle of incidence (j) and the angle of deviation (δ). Which of the following graphs will correctly
View SolutionFor an ideal solution, if a graph is plotted between 1PT and yA (mole fraction of A in vapour phase) where p0A>p0B then
View SolutionFor a simple pendulum, a graph is plotted between itskinetic energy (KE) and potential energy (PE)against its displacement d. Which one of the following represents these correctly? (graph are schematic and not drawn to scale)
View SolutionAt constant temperature if a graph plotted between logP and log(1V) has an intercept of unity then what will be the value of constant (k)
View SolutionIn an experiment, a boy plots a graph between (vmax)2and(amax)2 for a simple pendulum for different values of (small) amplitudes, where vmaxand amax is the maximum velocity and the maximum acceleration respectively. He found the graph to be a straight line with a negative slope, making an angle of 30∘ when the experiment was conducted on the earth surface. When the same experiment was conducted at a height h above the surface, the line was at an angle of 60∘. The value of h is [radius of the earth = R]
View SolutionFor sperical mirros graph plotted between −1V and −1uis .
View SolutionIn the searle's experiment, after every step of loading, why should we wait for two minutes before taking the reading?( More than one options may be correct).
View SolutionIn the searle's experiment, after every step of loading, why should we wait for two minutes before taking the reading?( More than one options may be correct).
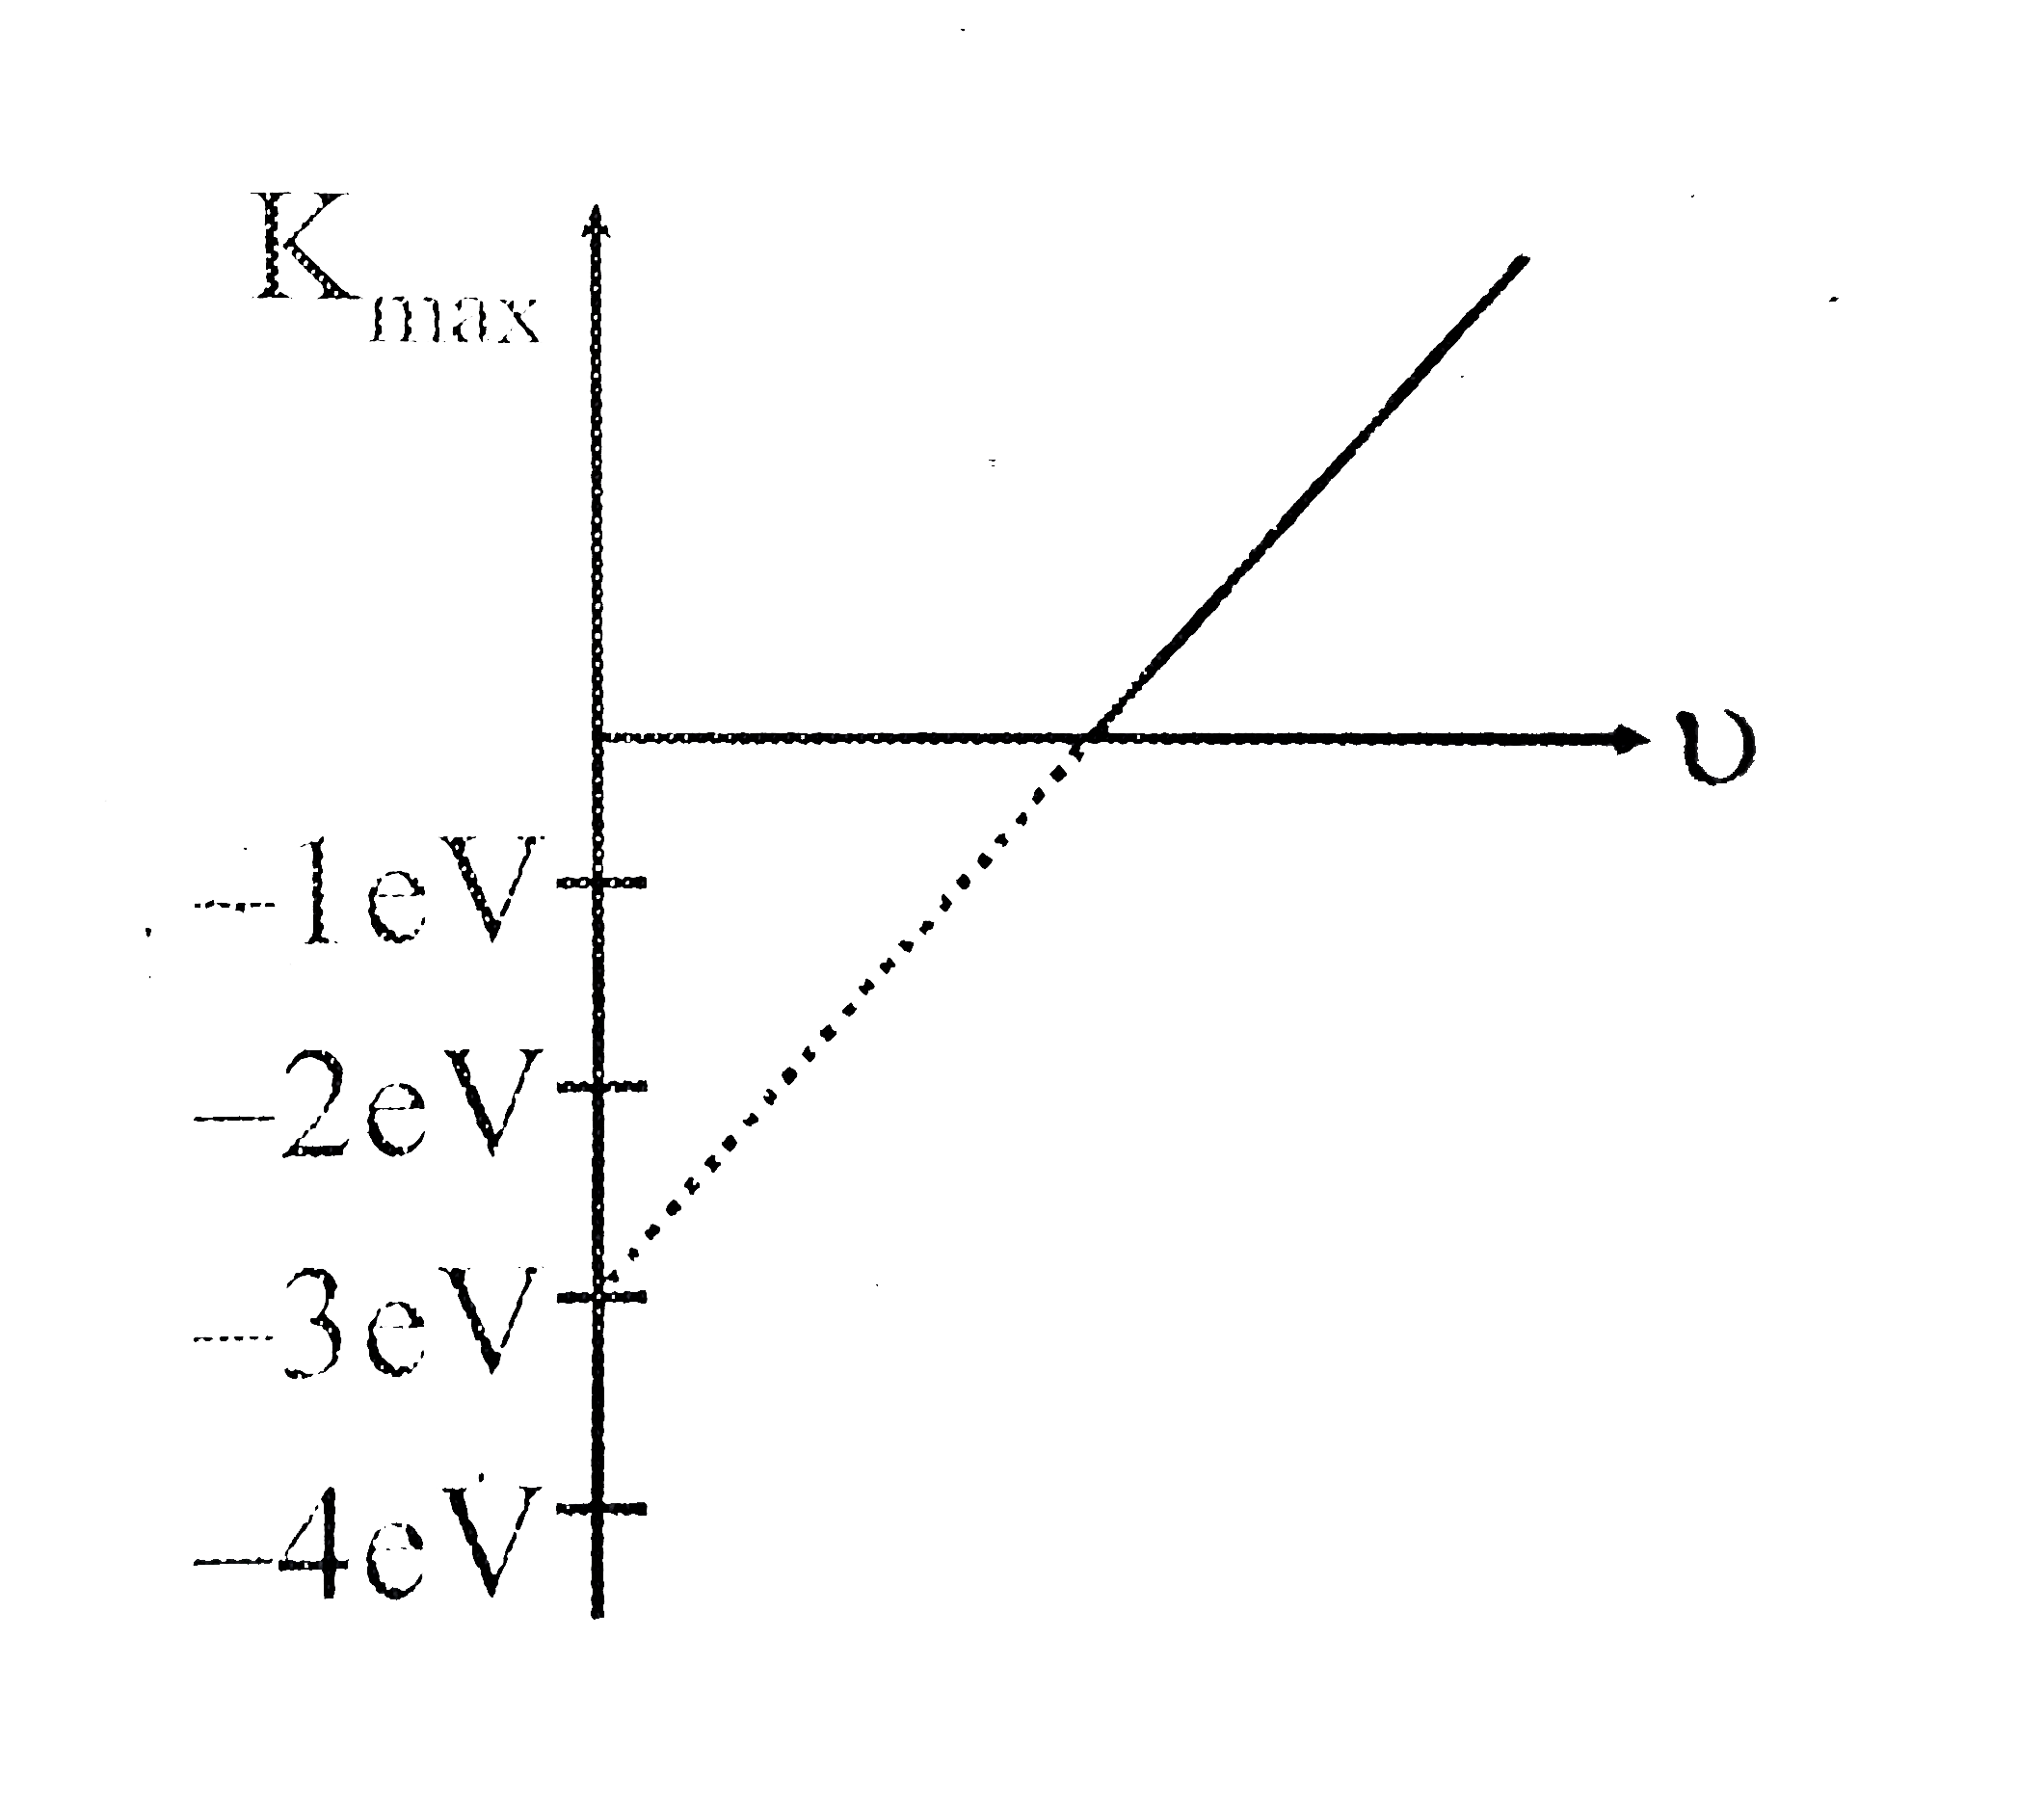
View SolutionFor a photoelectric experiment graph between kinetic energy of fastest electron and frequency of light is plotted find threshold wavelength of metal.

View Solution
