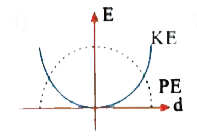
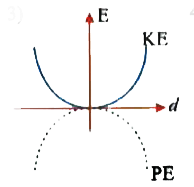
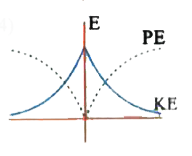
For a simple pendulum, a graph is plotted between itskinetic energy (KE) and potential energy (PE)against its displacement d. Which one of the following represents these correctly? (graph are schematic and not drawn to scale)
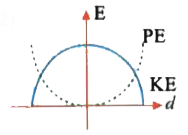
The correct Answer is:B
K.E is maximum at mean position, where as P.E is minimum
At extreme position, K.E is minimum and P.E is maximum
Topper's Solved these Questions
- OSCILLATIONSBOOK - NARAYNACHAPTER - OSCILLATIONSEXERCISE - EXERCISE - II (H.W)
19 Videos
- OSCILLATIONSBOOK - NARAYNACHAPTER - OSCILLATIONSEXERCISE - EXERCISE - III
29 Videos
- OSCILLATIONSBOOK - NARAYNACHAPTER - OSCILLATIONSEXERCISE - EXERCISE - I (H.W)
66 Videos
- NEWTONS LAWS OF MOTIONBOOK - NARAYNACHAPTER - NEWTONS LAWS OF MOTIONEXERCISE - PASSAGE TYPE QUESTION
6 Videos
- PHYSICAL WORLDBOOK - NARAYNACHAPTER - PHYSICAL WORLDEXERCISE - C.U.Q
10 Videos
Similar Questions
Knowledge Check
For a simple pendulum, a graph is plotted its kinetic energy (KE) and potential energy (PE) against its displacement d. Which one of the following represents these correctly?
A(a) (##JMA_CHMO_C10_068_O01##).B(b) (##JMA_CHMO_C10_068_O02##).C(c ) (##JMA_CHMO_C10_068_O03##).D(d) (##JMA_CHMO_C10_068_O04##).The potential energy in given according to the following graph.

Which of the following graph represent the force?A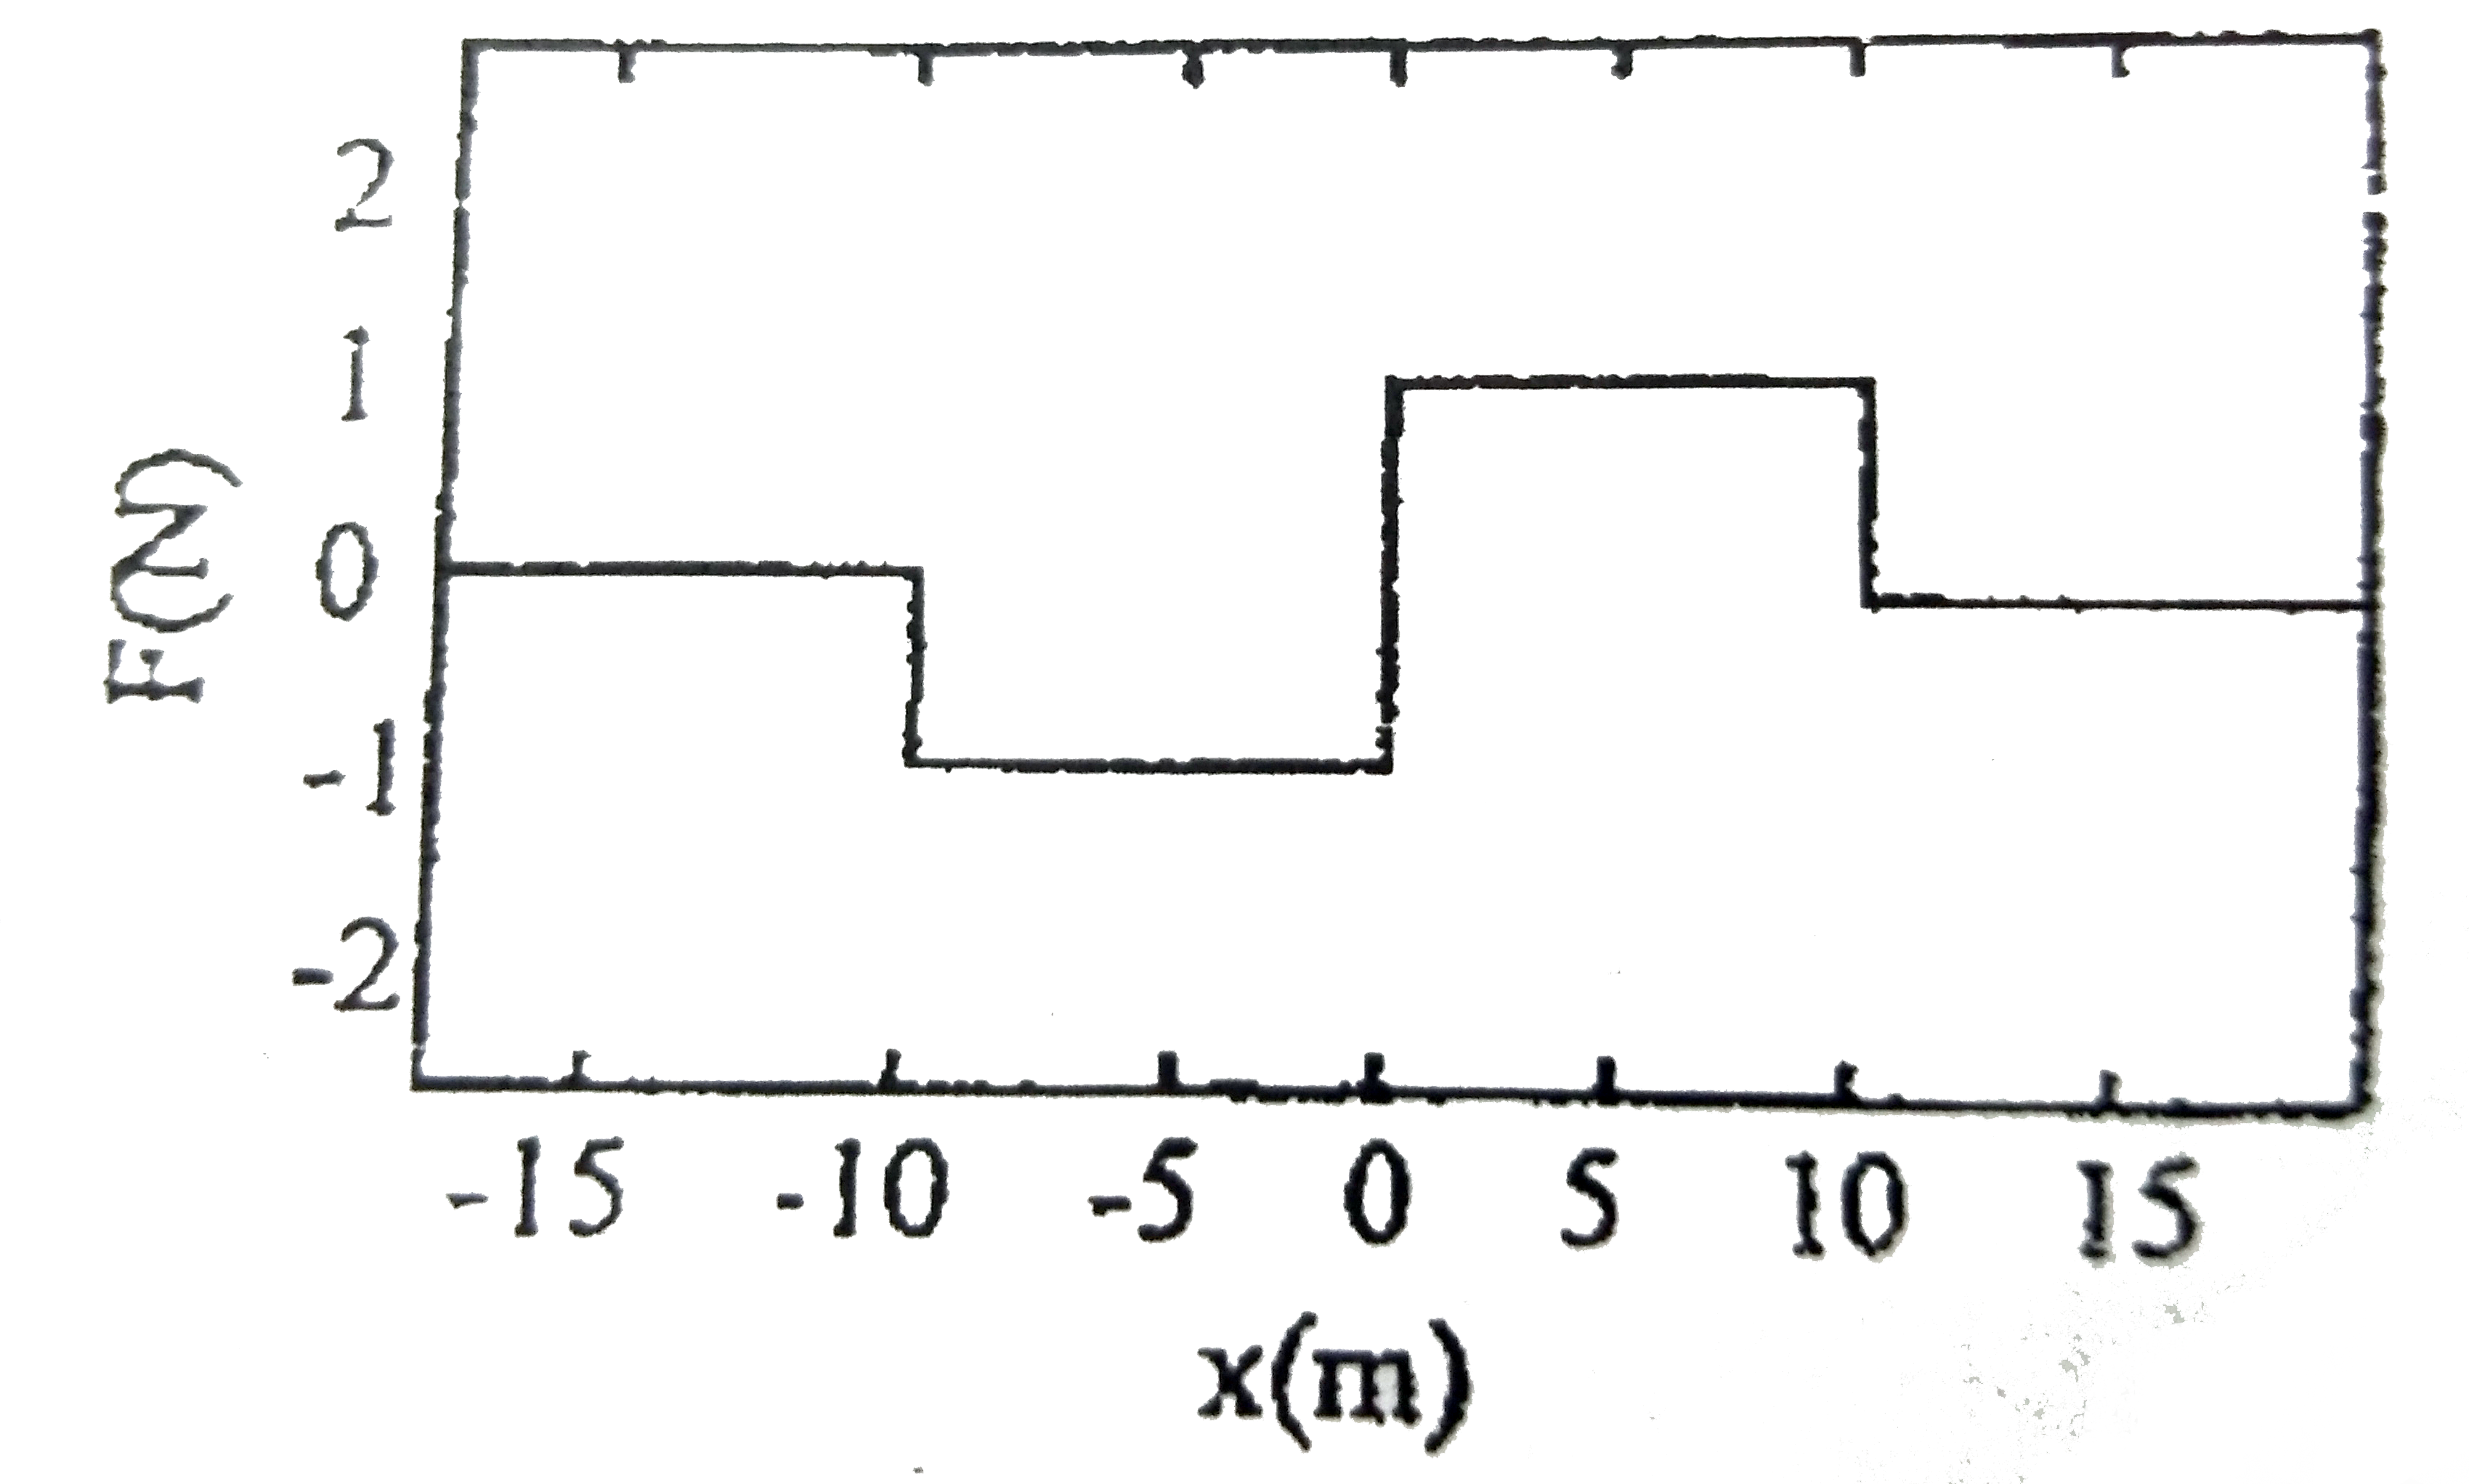 B
B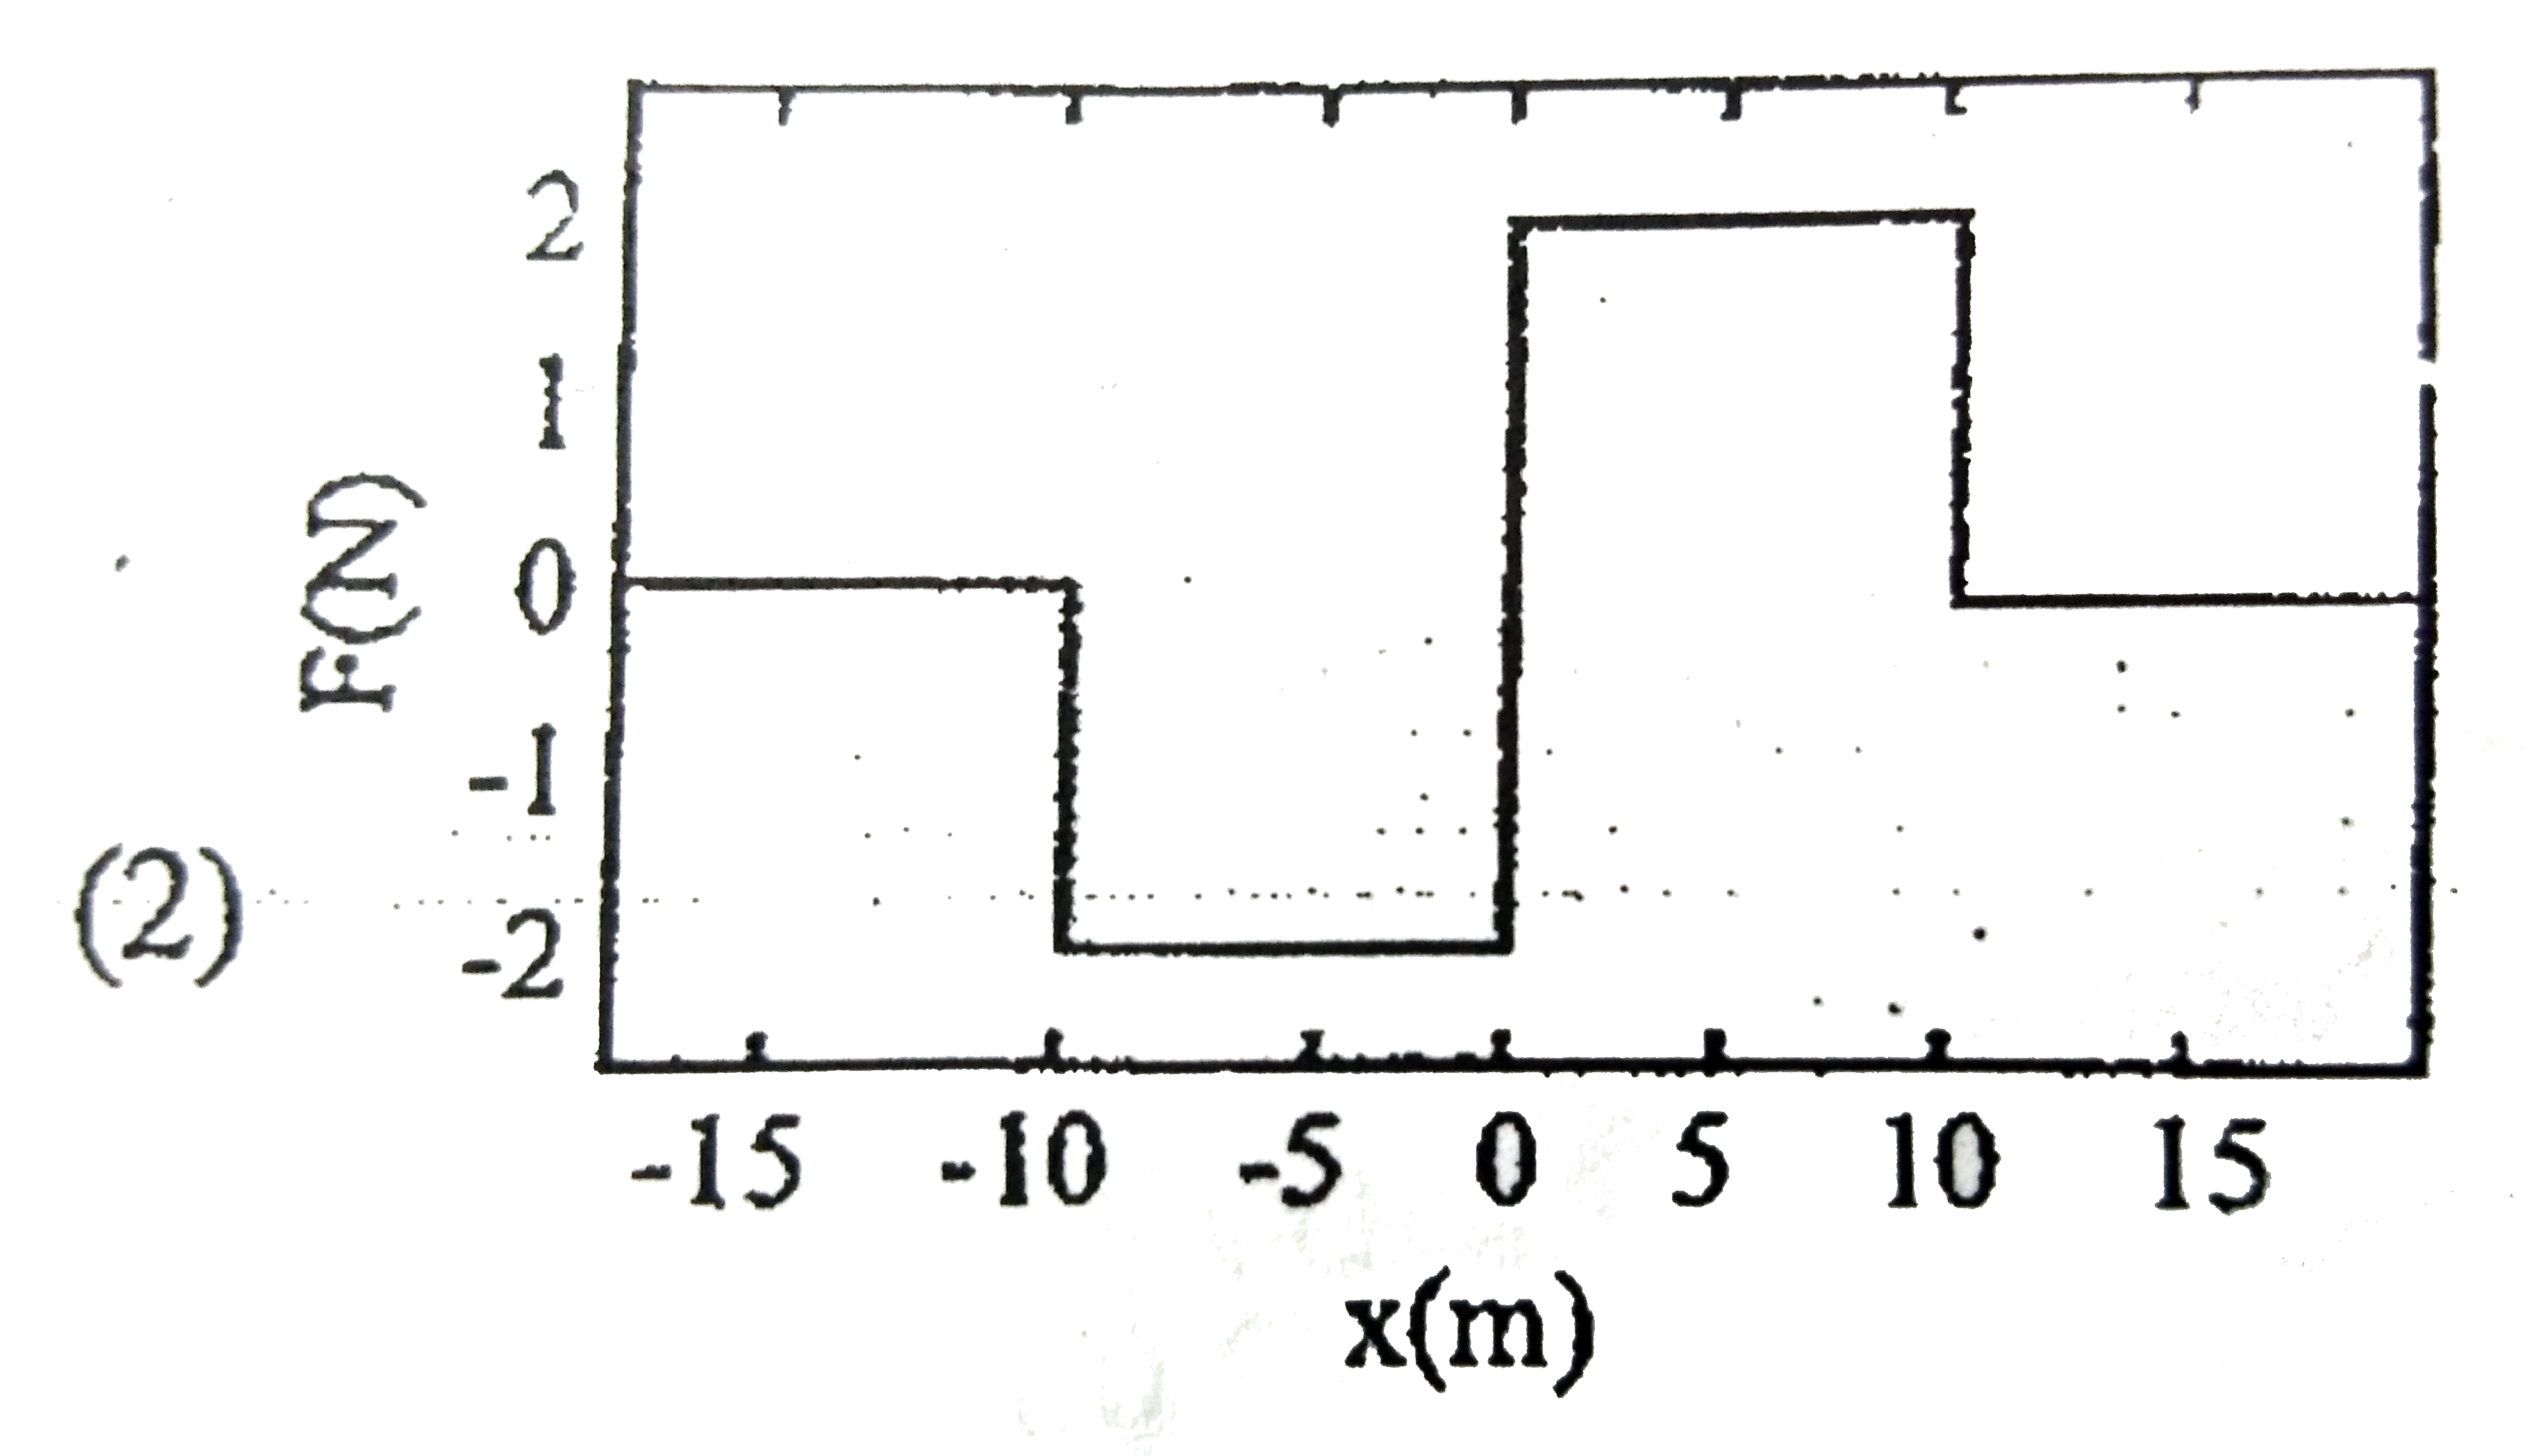 C
C D
D
Which of the following graph is correct between kinetic energy E, potential energy (U) and height (h) from the ground of the partical
A B
B C
C D
D
In the fig. The potential energy U of a particle plotted against its position x from origin. Which of the following statement is correct
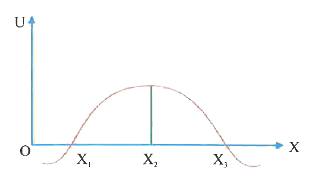
View SolutionA body executes simple harmonic motion. The potential energy (P.E), the kinetic energy (K.E) and energy (T.E) are measured as a function of displacement x. Which of the following staements is true?
View SolutionThe graph between potential energy and displacement of a particle performing S.H.M. is
View SolutionA graph is plotted by taking translational kinetic energy of body as ordinate and velocity as abscissa. Slope of the graph at an instant represents its
View SolutionAn LCR circuit is equivalent to a damped pendulum In an LCR circuit the capacitor is charged to Q0 and then connected to the L and R as shown below : Thus potential energy stored in the capacitor and that in the inductor also oscillates between maximum value an zero with double the frequency.
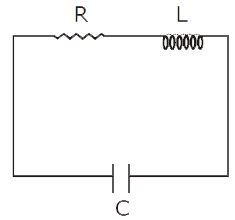
If a student plots graphs of the square of maximum charge (Q2max) on the capacitor with time (t) for two different values L1andL2(L1>L2) of L then which of the following reprersent this graph correctly ? (Plots are shematic and not drawn to scale )
View Solution
