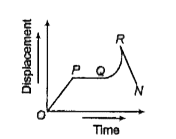
The graph between displacement and time in a motion along straight line is depicted below. Which interval indicates that no force is acting on the particle?
RS
QR
PQ
OP
The correct Answer is:C
PQ is a horizontal line parallel to time axis. So, velocity is zero, hence acceleration and therefore force is zero.
Similar Questions
Kinetic energy of a particle moving in a straight line is proportional to the time t. The magnitude of the force acting on the particle is :
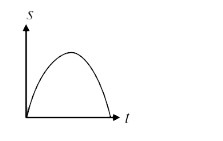
View SolutionThe graph of displacement vs time for a particle moving along a straight line is as shown. The best option for the corresponding velocity - time graph will be:
 View Solution
Knowledge Check
- Question 1 - Select One
The graph between the displacement x and time t for a particle moving in a straight line is shown in the figure. During the interval OA,AB,BC and CD the acceleration of the particle is
OA,AB,BC,CD
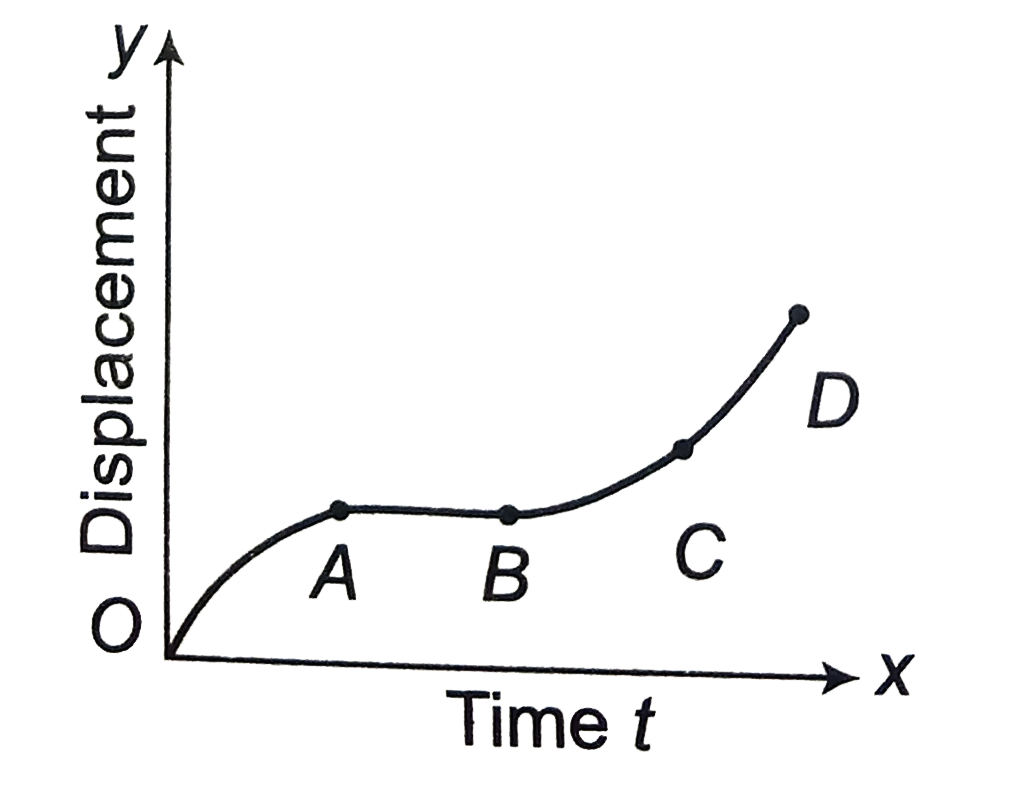 A+,0,+,+B−,0,+,0C+,0,−,+D−,0,−,0
 - Question 2 - Select One or More
Displacement time graph of a particle moving in a straight line is a shown in figure.
 Ain region A acceleration is positiveBin region B acceleration is negativeCin region C acceleration is positiveDin region D acceleration is negative
 - Question 3 - Select One or More
Velocity displacement graph of a particle moving in a straight line is as shown in figure.
 Amagnitude of acceleration of particle is decreasingBmagnitude of acceleration of particlre is increasingCacceleration versus displacement graph straight lineDacceleration versus displacement graph is parabola
The displacement of a particle of mass 2kg moving in a straight line varies with times as x=(2t3+2)m. Impulse of the force acting on the particle over a time interval between t = 0 and t = 1 s is
View SolutionKinetic energy of a particle moving in a straight line varies with time t as K=4t2. The force acting on the particle
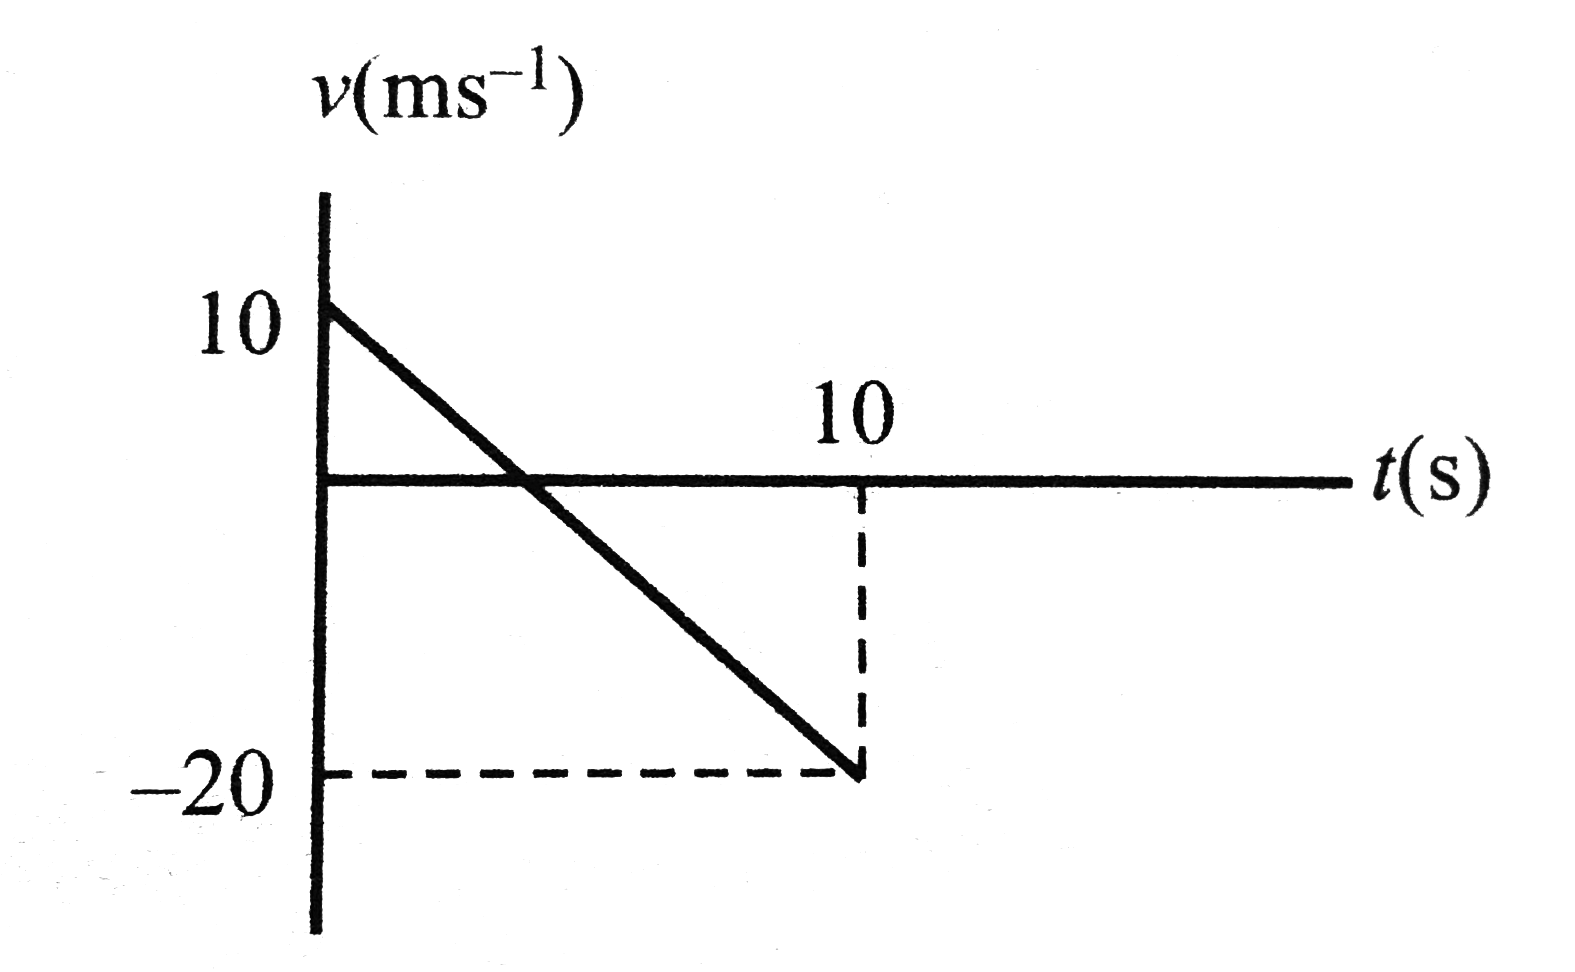
View SolutionThe velocity-time graph of a particle moving in a straight line is shown in figure. The mass of the particle is 2kg. Work done by all the forces acting on the particle in time interval between t=0 to t=10s is
 View Solution
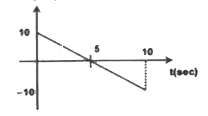
Velocity-time graph of a particle moving in a straight line is shown in the figure. Mass of the particle is 2 kg. Work done by all the forces acting on the particle in time interval t = 0 to t = 10 sec is
 View Solution
A graph between time (t) and the substance consumed at any time is found to be a straight line passing through the orginal This indicates that the reaction is of :
View Solution

