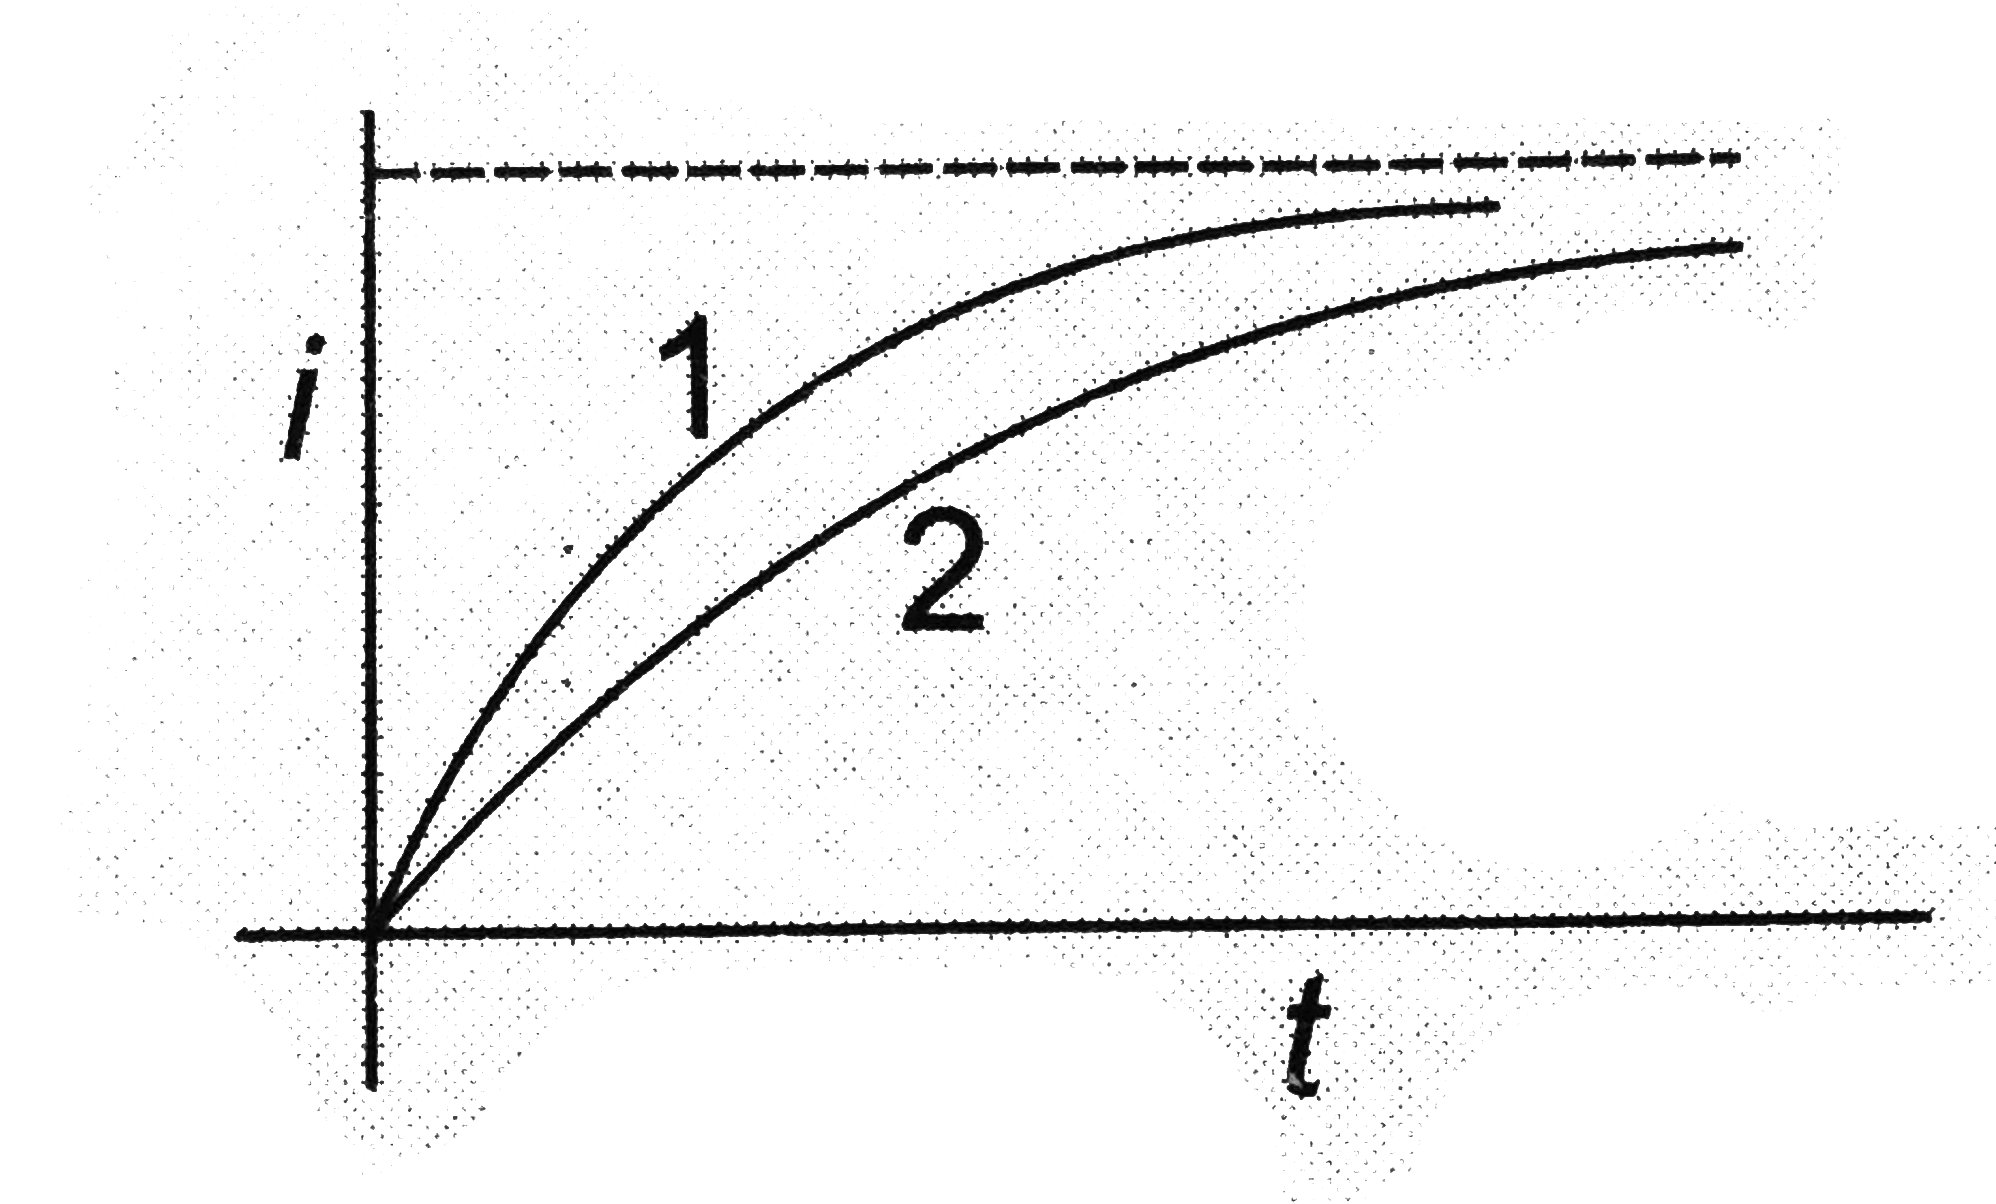
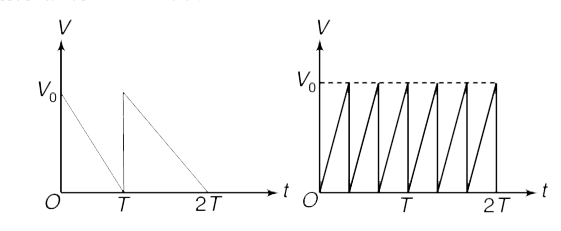
Which of the two curves shown below has lesser time constant.
Video Solution
Text Solution
curve 1
|
Topper's Solved these Questions
- ELECTROMAGNETIC INDUCTIONBOOK - RESONANCECHAPTER - ELECTROMAGNETIC INDUCTIONEXERCISE - Exercis-1
63 Videos
- ELECTROMAGNETIC INDUCTIONBOOK - RESONANCECHAPTER - ELECTROMAGNETIC INDUCTIONEXERCISE - Exercis-1 PART 2
51 Videos
- ELECTROMAGNETIC INDUCTIONBOOK - RESONANCECHAPTER - ELECTROMAGNETIC INDUCTIONEXERCISE - A.l.P
19 Videos
- ELECTRODYNAMICSBOOK - RESONANCECHAPTER - ELECTRODYNAMICSEXERCISE - Advanced level problems
31 Videos
- ELECTROSTATICSBOOK - RESONANCECHAPTER - ELECTROSTATICSEXERCISE - HLP
39 Videos
Similar Questions
Knowledge Check
Which of the compound shown below are isomers?
A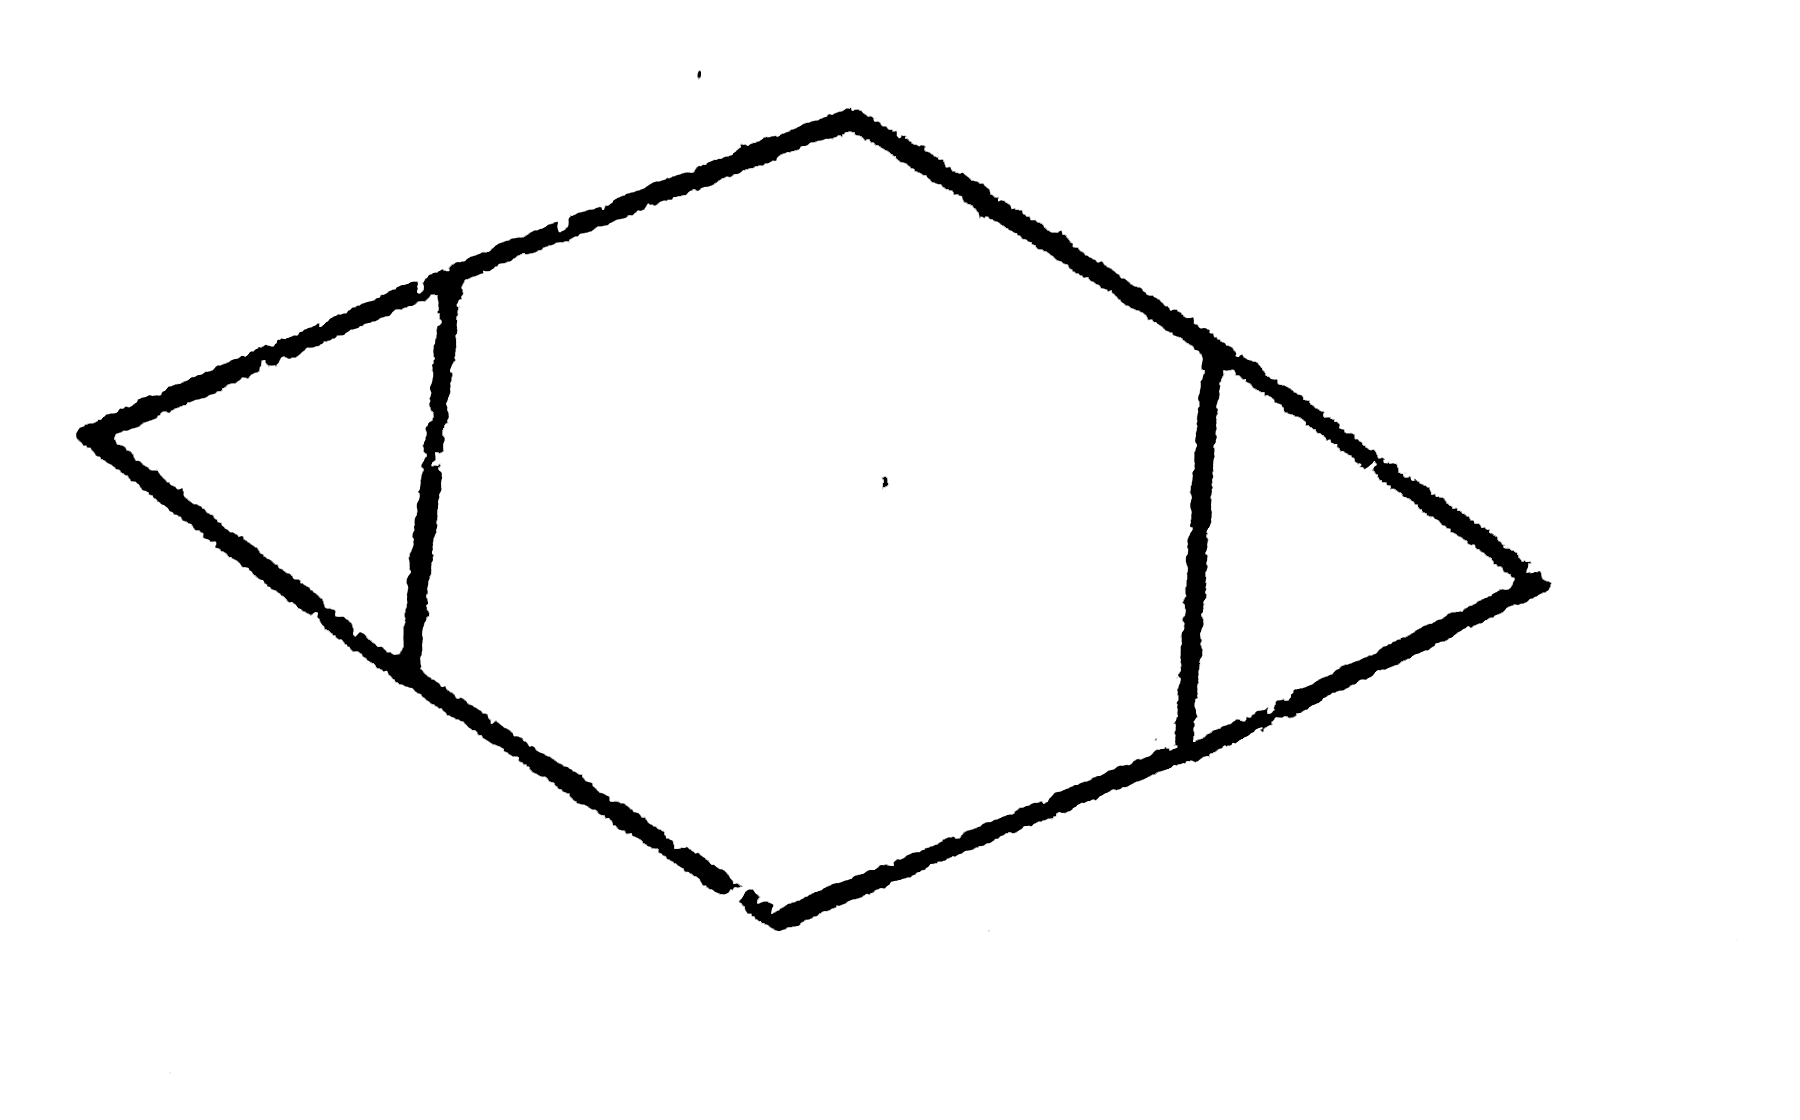 B
B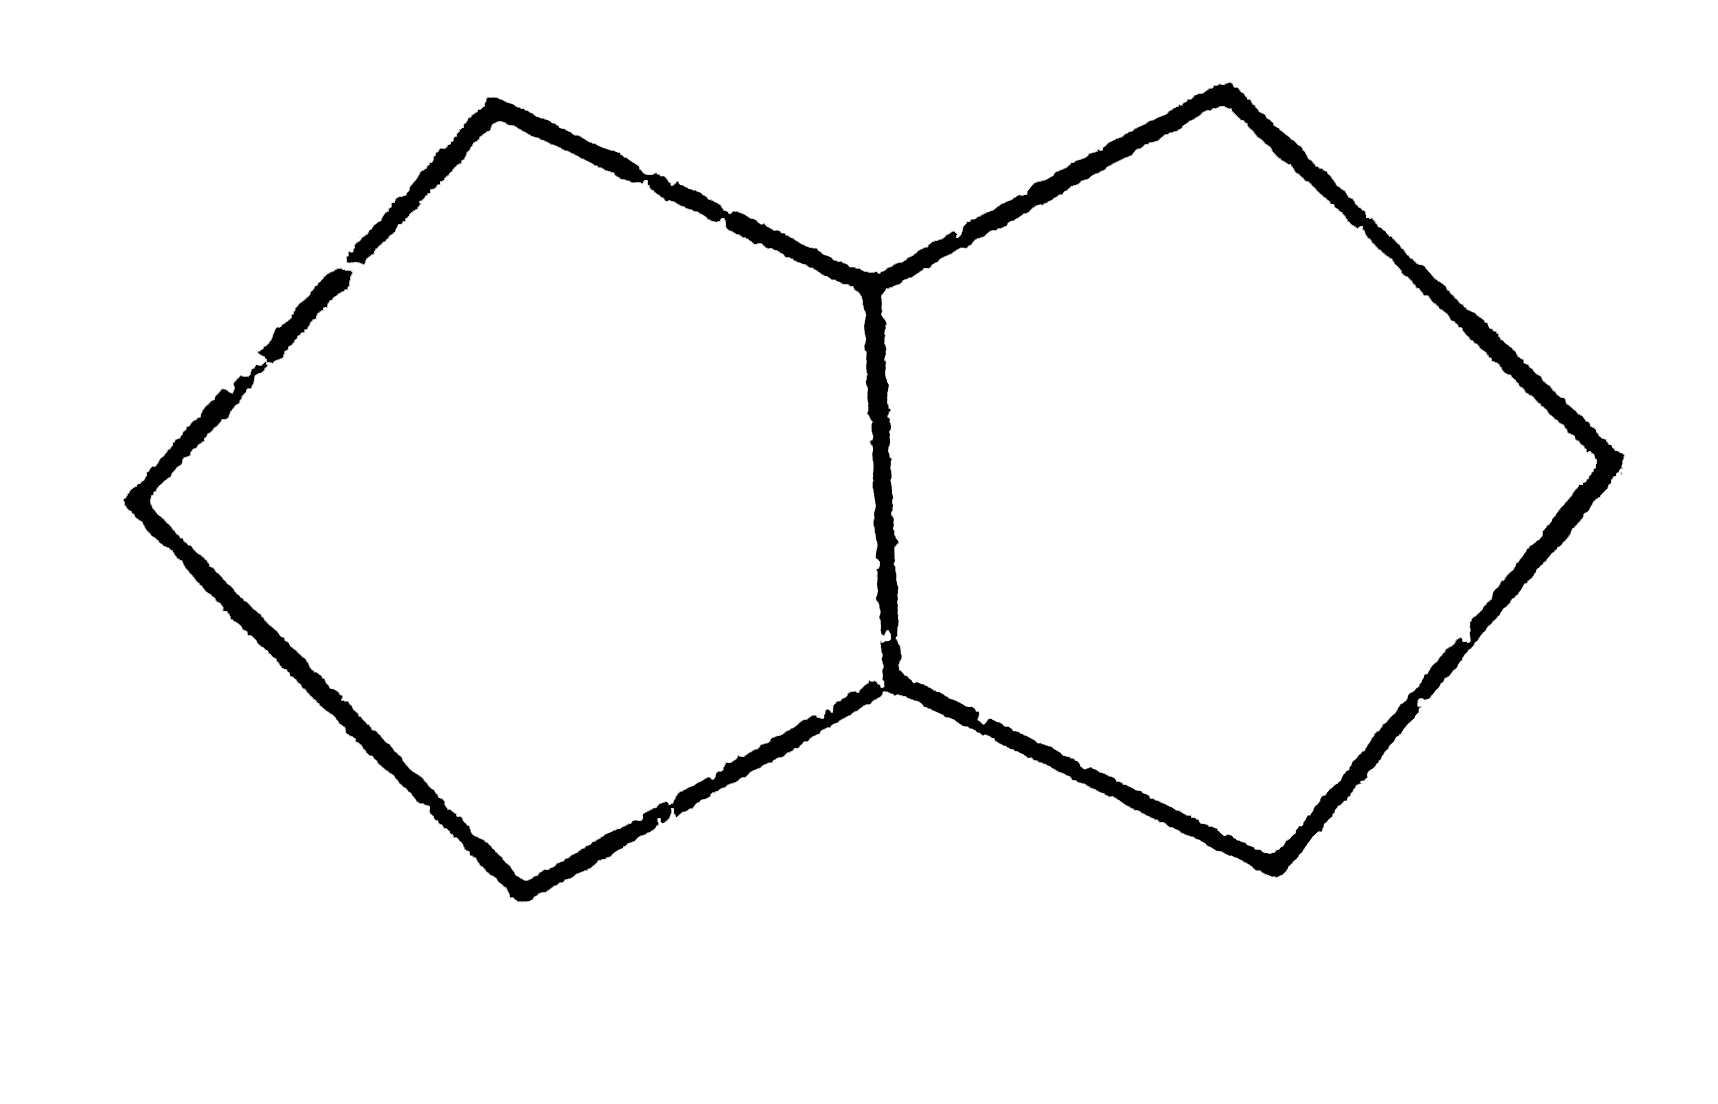 C
C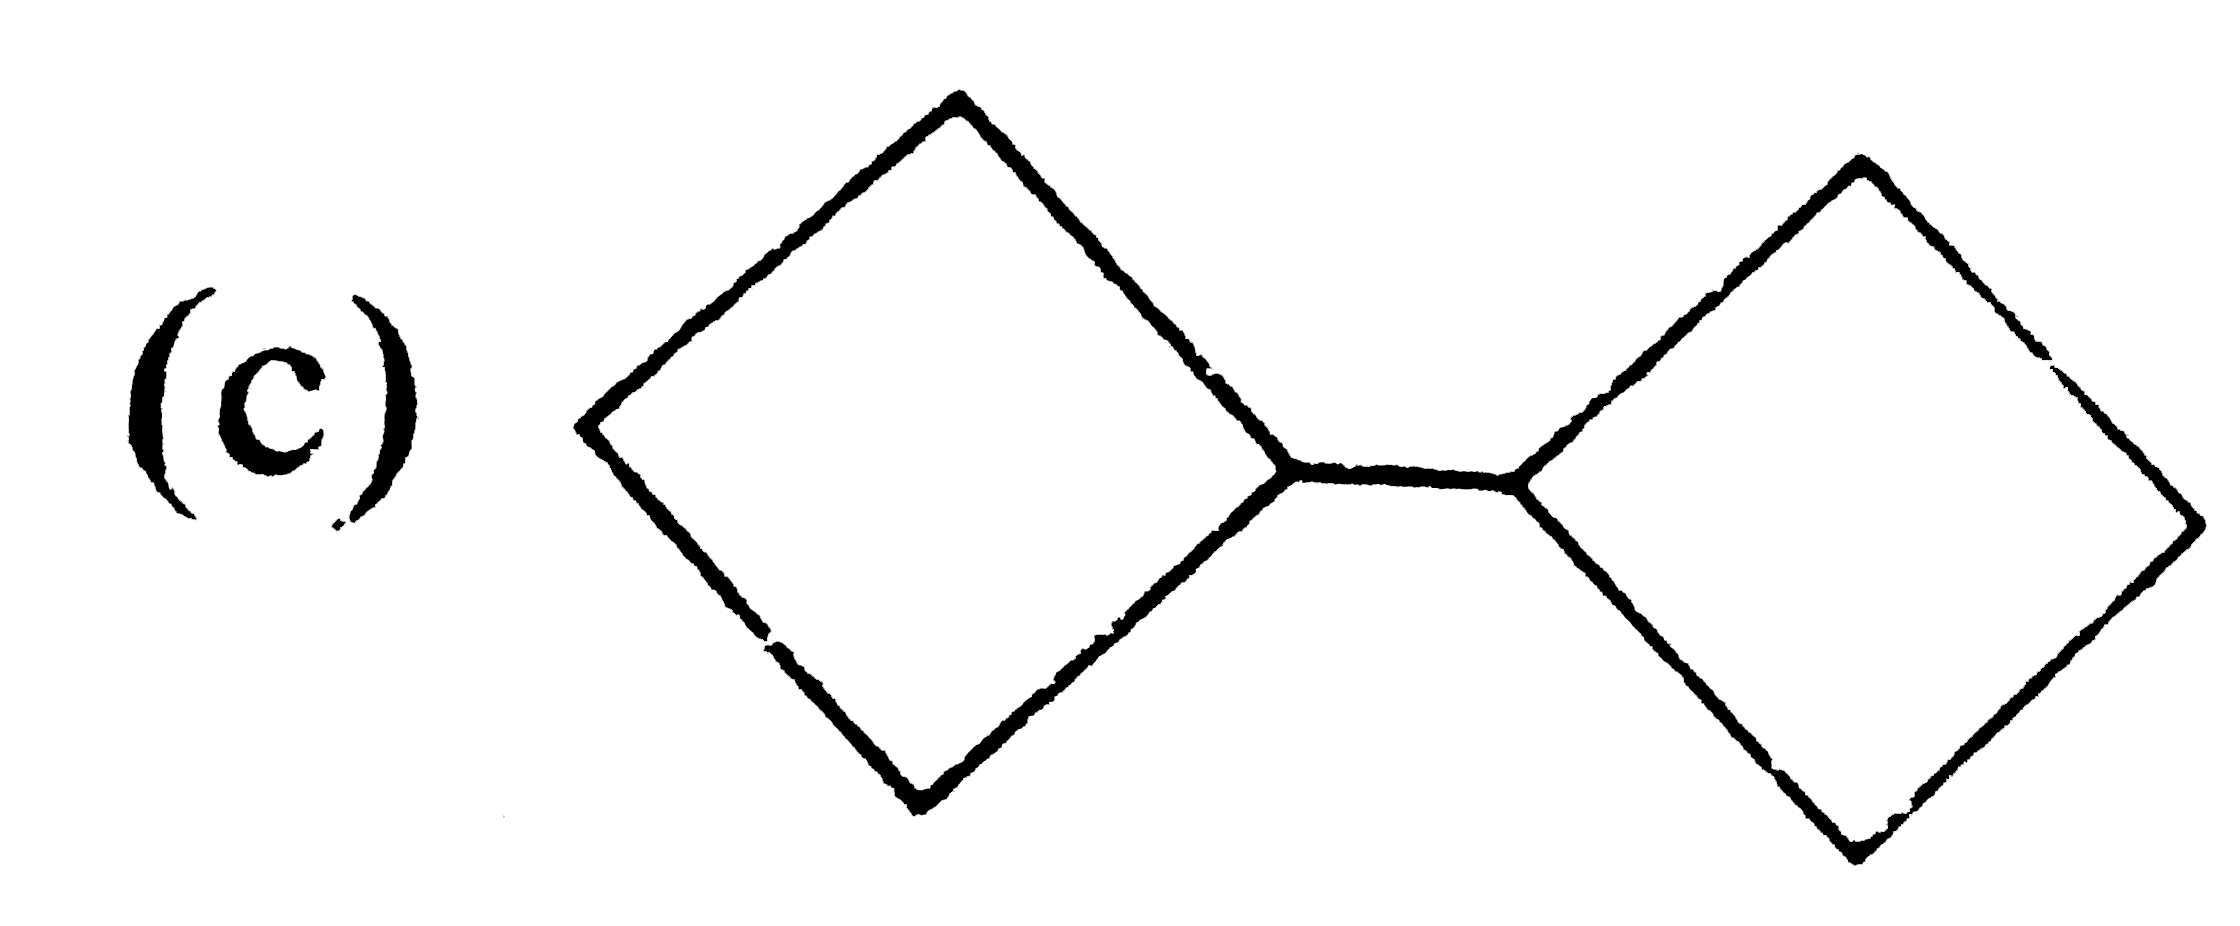 D
D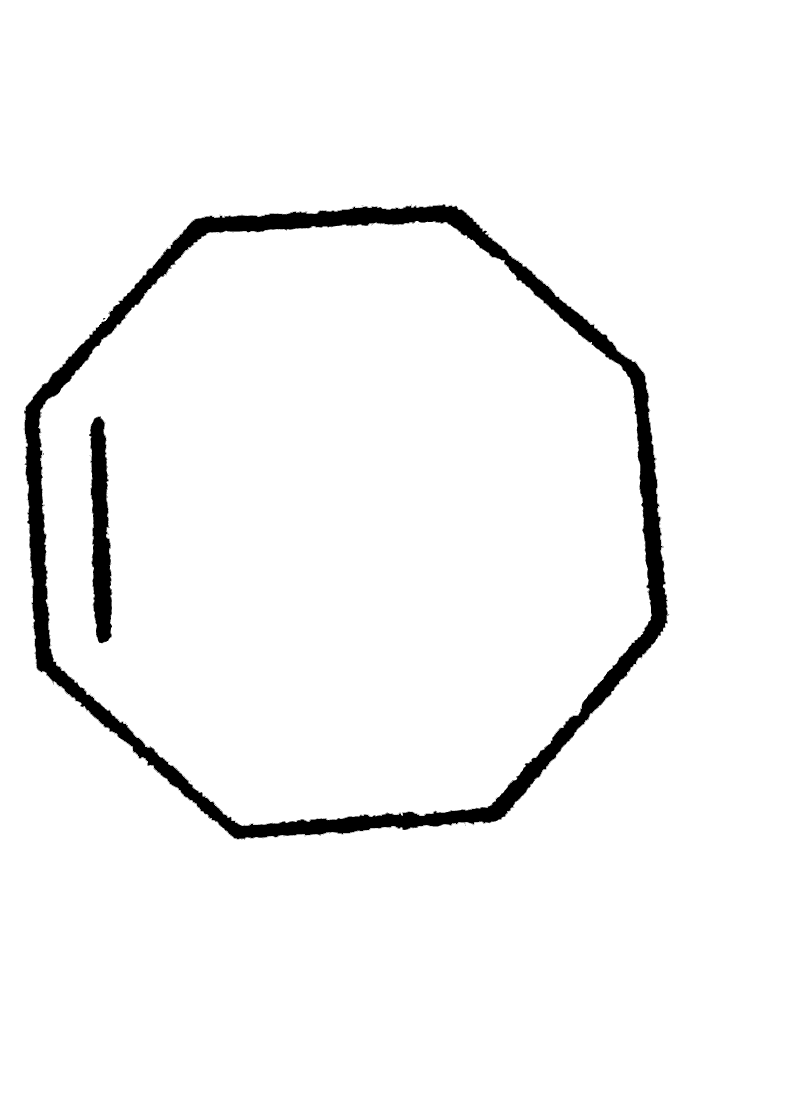
The two compounds shown below are :
 ADiastereomersBenantiomersCepimersDregiomers
Which compounds shown below has six isomers?
AC2F2Cl2BC2FClBrICC2F2ClBrDC3H4Cl2
At the point of intersection of the two curves shown for the reaction
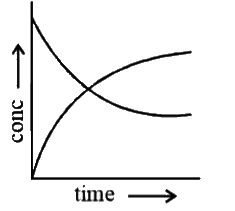
A→nB time →
then concentration of B is given by :
View SolutionWhich of the two waveforms shown in Figure has a higher rms value?
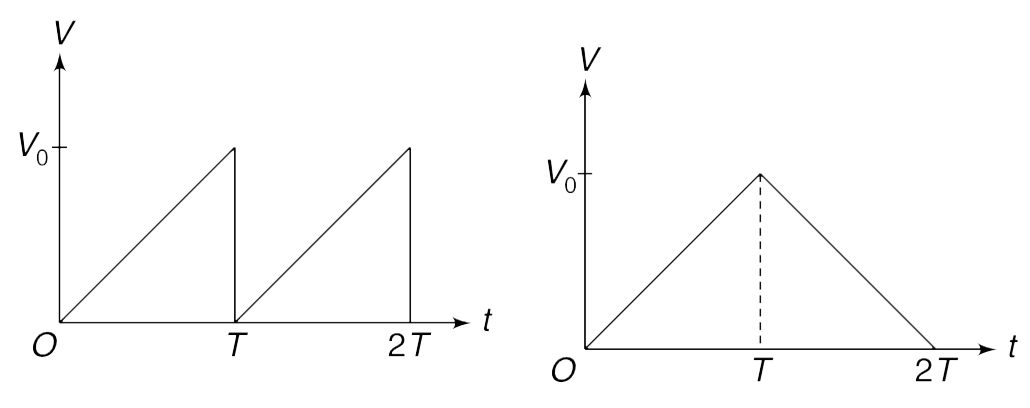
View SolutionWhich of the two waveforms shown in Figure has a higher average value?
View SolutionWhich of the following curves shown below cannot possibly represent electrostatic field lines?
View SolutionAmong the structure shown below, which has lowest potential energy ?
View Solution

