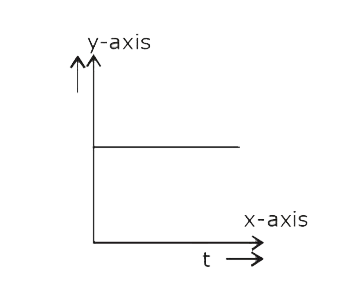
In the graph shown in figure, which quanitity associated with projectile motion is plotted along y-axis ?
Kinetic energy
Momentum
Horizontal velocity
None of these
The correct Answer is:C
Step by step video, text & image solution for In the graph shown in figure, which quanitity associated with projectile motion is plotted along y-axis ? by Physics experts to help you in doubts & scoring excellent marks in Class 12 exams.
Updated on:21/07/2023Similar Questions
Knowledge Check
In the graph shown in fig. the time is plotted along x-axis. Which quantity associated with the projectile motion is plotted along the y -axis:-
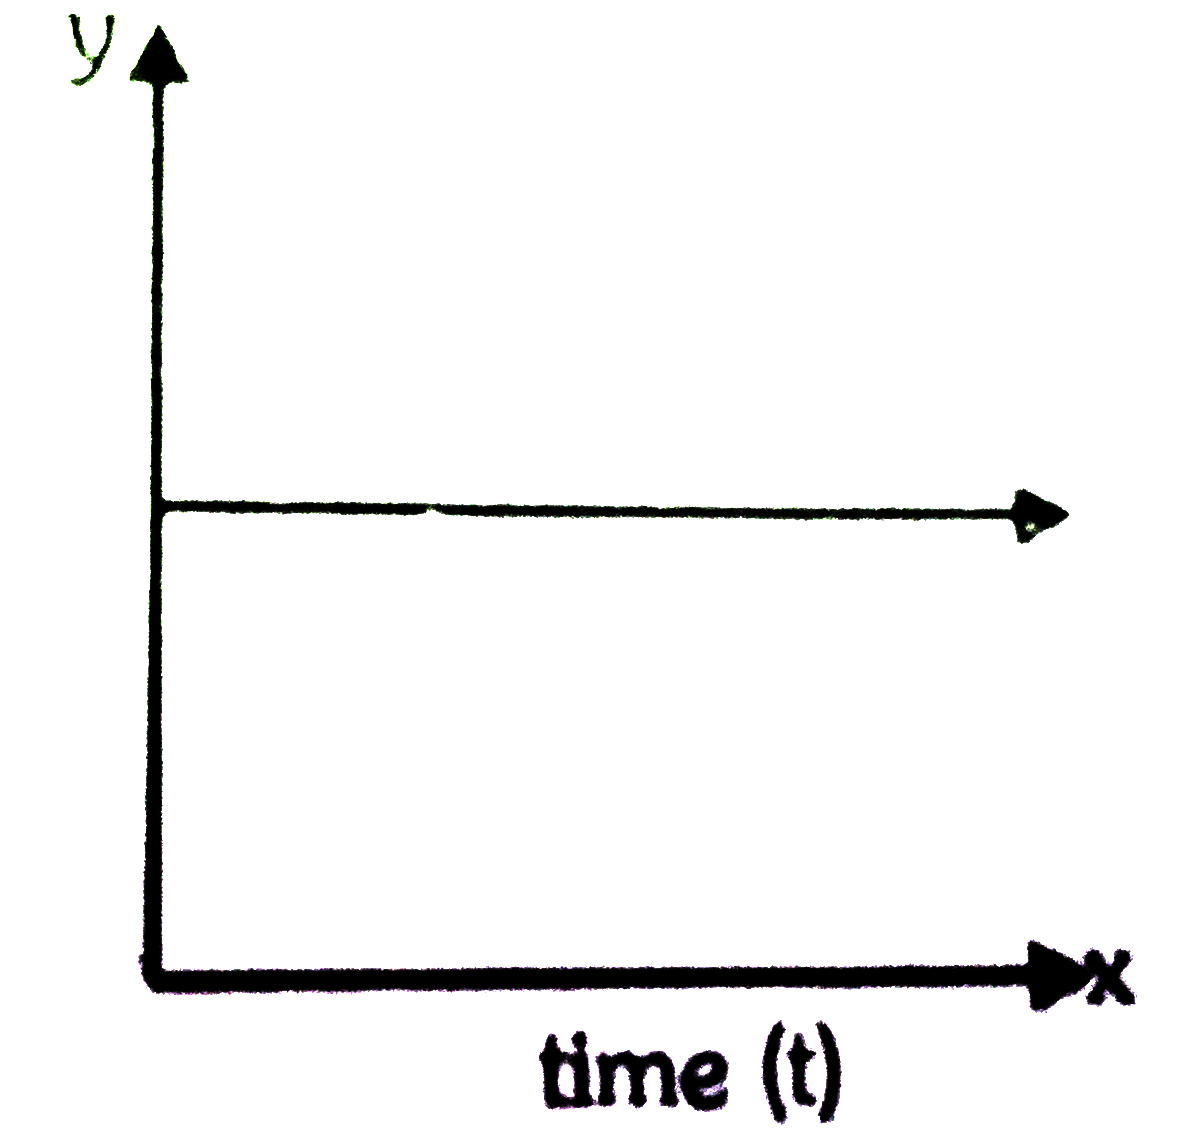 Akinetic energyBmomentumChorizontal velocityDnone of the above
Which quantity associated with the projectile motion remains constant during entire motion?
Akinetic energyBmomentumChorizontal velocityDvertical velocityThe acceleration - time graph for a particle moving along x - axis is shown in figure, If the initial velocity of particle is −5m/s, the velocity at t = 8 s is
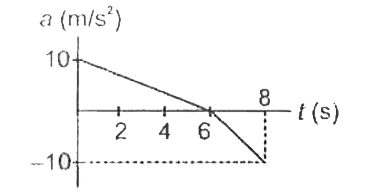 A+15m/sB+20m/sC−15m/sD−20m/s
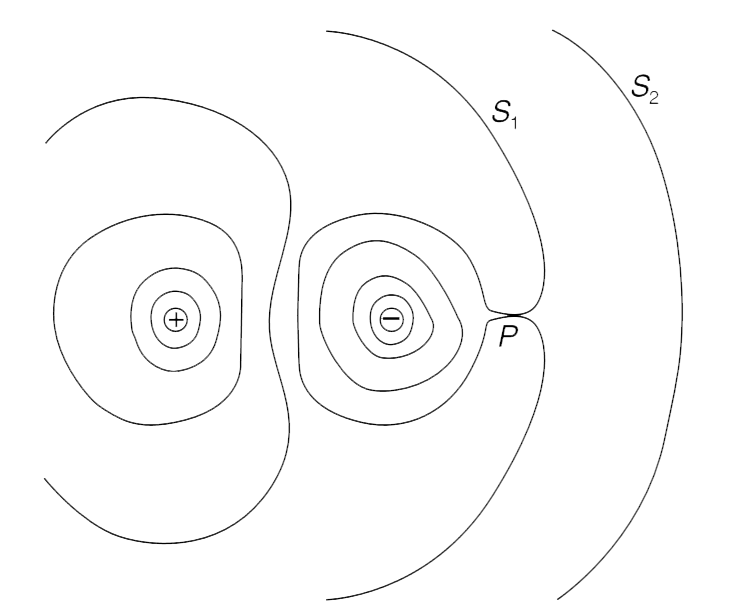
Three point charge have been placed along the x axis at points A, B and C. Distance AB = BC. The field lines generated by the system is shown in figure. (a) Plot the variation of electric potential along x axis. Show potential on y axis of your graph. (b) Plot the variation of electric potential along y axis with B as origin. Shows potential on x axis in your graph.
View SolutionIf graph of y= f(x) is as shown in figure, then which of the following options is/are correct?
View SolutionPlot a graph of the de-Broglie wavelength associated with a photon versus its momentum.
View SolutionPlot a graph of the de - Broglie wavelength associated with a proton versus its momentum .
View SolutionWhich of the velocity-time (v - 1) graphs shown in figure can possibly represent one-dimensional motion of a particle? (A) (B)
View Solution

