An ideal gas is initially at temperature T and volume V. Its volume increases by DV due to an increase in Temperature.dT, while pressure remains constant
Here What will be the nature of the graph between and l?
In case an ideal gas
When pressure remains constant, we have
i.e., =constant
So the graph will be a rectangular hyperbola [Fig.6.20]

Topper's Solved these Questions
- EXPANSION OF GASESBOOK - CHHAYA PUBLICATIONCHAPTER - EXPANSION OF GASESEXERCISE - EXERCISE (MULTIPLE CHOICE QUESTION)
20 Videos
- EXPANSION OF GASESBOOK - CHHAYA PUBLICATIONCHAPTER - EXPANSION OF GASESEXERCISE - EXERCISE (Very Short Answer Type Question)
6 Videos
- EXPANSION OF GASESBOOK - CHHAYA PUBLICATIONCHAPTER - EXPANSION OF GASESEXERCISE - CBSE Scanner
1 Videos
- ELASTICITY BOOK - CHHAYA PUBLICATIONCHAPTER - ELASTICITY EXERCISE - CBSE SCANNER
10 Videos
- EXPANSION OF SOLIDS AND LIQUIDSBOOK - CHHAYA PUBLICATIONCHAPTER - EXPANSION OF SOLIDS AND LIQUIDSEXERCISE - CBSE SCANNER
2 Videos
Similar Questions
An ideal gas is initially at temperature T and volume V. Its volume is increased by ΔV due to an increase in temperature ΔT, pressure remaining constant. The quantity δ=ΔVVΔT varies with temperature as
View SolutionBy increasing temperature of a gas by 6∘C its pressure increases by 0.4%, at constant volume. Then initial temperature of gas is
View Solution
Knowledge Check
An ideal gas is initially at temperature T and volume V. It's volume increases by ΔV due to an increase in temperature of ΔT, pressure remaining constant. The quantity μ=ΔVVΔT varies with temperature as -
A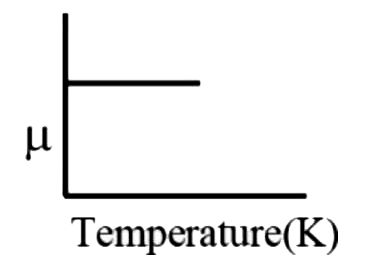 B
B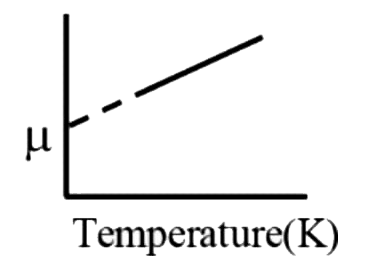 C
C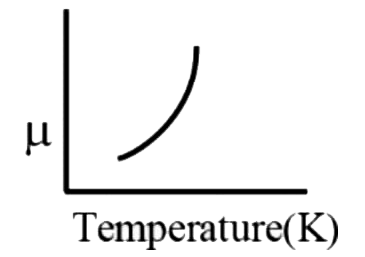 D
D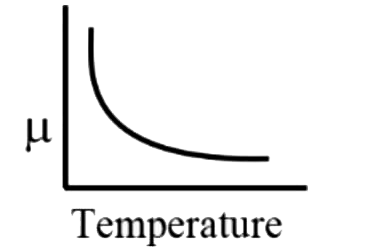
An ideal gas is initially at temperature T and volume V. Its volume is increased by ΔV due to an increase in temperature ΔT, pressure remaining constant. The quantity δ=ΔVVΔT varies with temperature as
A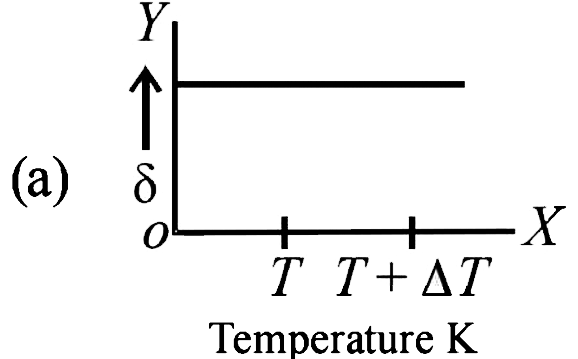 B
B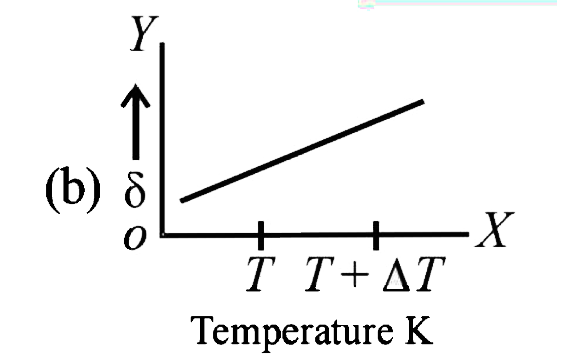 C
C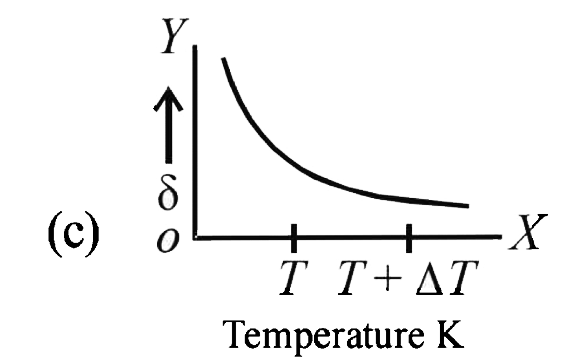 D
D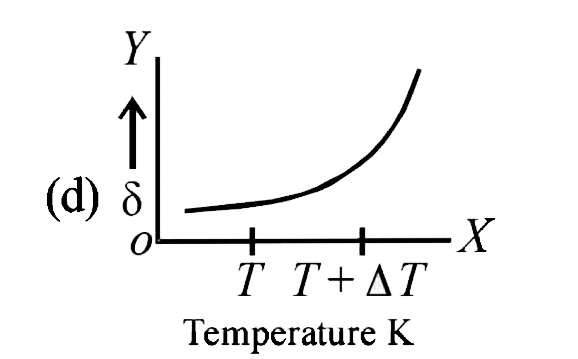
An ideal gas is initially at temperature T and volume V . Its volume is increased by ΔV due to an increase in temperature Δ , pressure remaining constant . The quantity δ=ΔV/VΔT varies with temperature as
A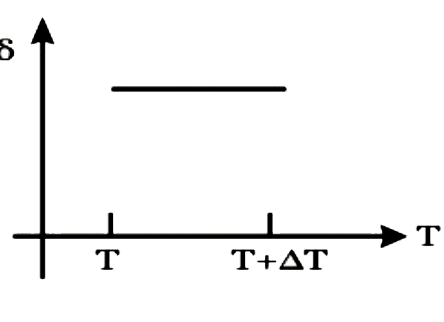 B
B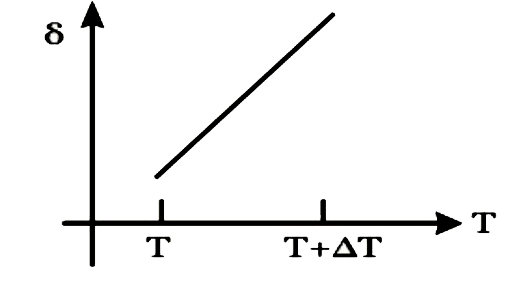 C
C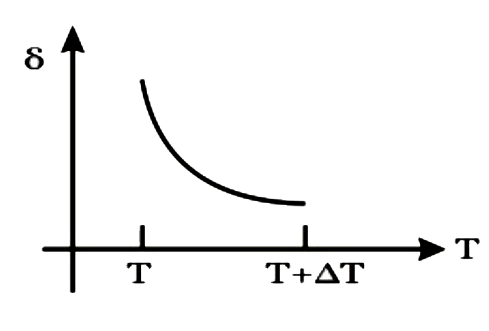 D
D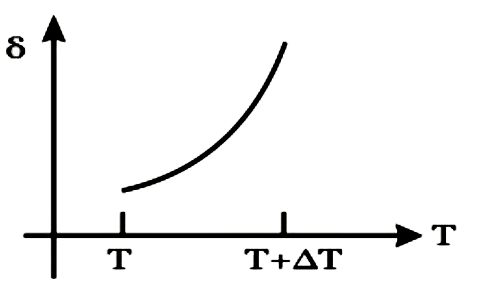
An ideal gas is initially at temperature T and volume V. ITS volume is increased by ΔV due to an increase in temperature ΔT, pressure remaining constant. The quantity δ=ΔV/VΔT varies with temperature as
View SolutionAn ideal gas is initially at temperature T and volume V. Its volume is increased by ΔV due to an increase in temperature ΔT, pressure remaining constant. The quantity δ=ΔVVΔT varies with temperature as
View SolutionBy increasing temperature of a gas by 6∘C its pressure increases by 0.4%, at constant volume. Then initial temperature of gas is
View SolutionWhat is the effect on the pressure of a gas if its temperature is increased at constant volume ?
View SolutionWhat is the effect on the pressure of a gas if its temperature is increased at constant volume ?
View Solution
