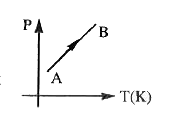
Draw p-T graph for masses m and 2m of the same gas, when heated in a container of constant volume. Interpret the slopes.Solution in Bengali
The desired graphs are shown in fig.6.17.
The equation of state for mass m of a gas of molecular weight M is
pV=mMRTor,p=mRMVT
Given V=constant, so for any fixed mass, p= constant × T.
Thus, the p-T graph is a straight line passing through the origin [FIg.6.17].
Also the slope mRMV is higher for a higher m.
∴ The slope of the graph for mass 2m is more than that for mass m.
For any temperature the value of p in the first case will be half of second case. (BC=12AC)

Topper's Solved these Questions
- EXPANSION OF GASESBOOK - CHHAYA PUBLICATIONCHAPTER - EXPANSION OF GASESEXERCISE - EXERCISE (MULTIPLE CHOICE QUESTION)
20 Videos
- EXPANSION OF GASESBOOK - CHHAYA PUBLICATIONCHAPTER - EXPANSION OF GASESEXERCISE - EXERCISE (Very Short Answer Type Question)
6 Videos
- EXPANSION OF GASESBOOK - CHHAYA PUBLICATIONCHAPTER - EXPANSION OF GASESEXERCISE - CBSE Scanner
1 Videos
- ELASTICITY BOOK - CHHAYA PUBLICATIONCHAPTER - ELASTICITY EXERCISE - CBSE SCANNER
10 Videos
- EXPANSION OF SOLIDS AND LIQUIDSBOOK - CHHAYA PUBLICATIONCHAPTER - EXPANSION OF SOLIDS AND LIQUIDSEXERCISE - CBSE SCANNER
2 Videos
Similar Questions
Both the volume and the pressure of a definite mass of gas are observed to increase. This is possible when the temperature of the gas
View SolutionAt what celcius temperature does the volume of a gas become zero according to Charle's law?
View SolutionExplain why air pressure in a car tyre increases during driving.
View SolutionWhich substances are called elastomers? Given one example.
View SolutionShow that the coefficient of superficial expansion of a rectangular sheet of the solid is twice its coefficient of linear expansion.
View SolutionTwo different masses m and 3 m of an ideal gas are heated separately in a vessel of constant volume, the pressure P and absolute temperature T , graphs for these two cases are shown in the figure as A and B . The ratio of slopes of curves B to A is
View SolutionThe slope of T-P graph for a given mass of a gas increases, the volumn of the gas
View SolutionThe P-T graph for the given mass of an ideal gas is shown in figure. Then the volume
View SolutionAt pressure P and absolute temperature T a mass M of an ideal gas fills a closed container of volume V. An additional mass 2M of the same gas is added into the container and the volume is then reduced to V/3 and the temperature to T/3 . The pressure of the gas will now be:
View SolutionTwo identical vessels A and B contain masses m and 2m of same gas. The gases in the vessels are heated keeping their volumes constant and equal. The temperature-pressure curve for mass 2m makes angle alpha with T-axis and that and for mass m makes an angle beta with T-axis then
View Solutionयदि P,V,M,T तथा R क्रमशः दाब, आयतन मोलर द्रव्यमान, ताप तथा गैस स्थिरांक है तो एक आदर्श गैस का घनत्व होगा :
View SolutionFor a fixed mass of an ideal gas draw the following graphs:
(i) P/T vs T (volume remaining constant)
(ii) d (density) vs P (temperature remaining constant)
View SolutionThe graph between (P/T) and T for a gas at constant volume will be:
View Solutionयदि P,V,M,T तथा R क्रमशः दाब, आयतन मोलर द्रव्यमान, ताप तथा गैस स्थिरांक है तो एक आदर्श गैस का घनत्व होगा :
View SolutionThe P-T graph for the given mass of an ideal gas is shown in figure. Then the volume

View Solution
