How is an amount of work in connection with a thermodynamic system, represented on a pV -diagram?Solution in Bengali
Step by step video & image solution for How is an amount of work in connection with a thermodynamic system, represented on a pV -diagram? by Physics experts to help you in doubts & scoring excellent marks in Class 11 exams.
Updated on:21/07/2023Topper's Solved these Questions
- FIRST AND SECOND LAW OF THERMODYNAMICSBOOK - CHHAYA PUBLICATIONCHAPTER - FIRST AND SECOND LAW OF THERMODYNAMICSEXERCISE - Higher Order Thinking Skill (HOTS) Questions
35 Videos
- FIRST AND SECOND LAW OF THERMODYNAMICSBOOK - CHHAYA PUBLICATIONCHAPTER - FIRST AND SECOND LAW OF THERMODYNAMICSEXERCISE - Exercise - Multiple Choice Questions (Mark 1)
31 Videos
- FIRST AND SECOND LAW OF THERMODYNAMICSBOOK - CHHAYA PUBLICATIONCHAPTER - FIRST AND SECOND LAW OF THERMODYNAMICSEXERCISE - CBSE SCANNER
18 Videos
- EXPANSION OF SOLIDS AND LIQUIDSBOOK - CHHAYA PUBLICATIONCHAPTER - EXPANSION OF SOLIDS AND LIQUIDSEXERCISE - CBSE SCANNER
2 Videos
- FRICTION BOOK - CHHAYA PUBLICATIONCHAPTER - FRICTION EXERCISE - CBSE SCANNER
7 Videos
Similar Questions
Water falls from the top to the bottom of a waterfall. Why does the temperature at the bottom become slightly higher?
View SolutionWhen a bullet of 6g mass hits a target at a speed of 400m⋅s−1, 70% of its energy is converted into heat. The value of heat generated is
View SolutionWrite the second law of thermodynamics.
View SolutionShow that the coefficient of superficial expansion of a rectangular sheet of the solid is twice its coefficient of linear expansion.
View SolutionDefine angle of friction. The inclination θ of a rough plane is increased gradually. The ply on the plane just comes into motion when inclination θ becomes 30∘. Find coefficient of friction. If the inclination is further increased to 45∘ then find acceleration of the body along the plane. (g = 10 m.s−2)
View SolutionThe state of a thermodynamic system is represented by
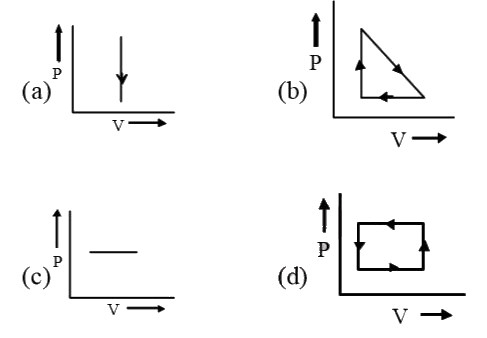
View SolutionThe figure shows P - V diagram of a thermodynamic cycle Identify the diagram which correctly represents the heat inflow and outflow of the system
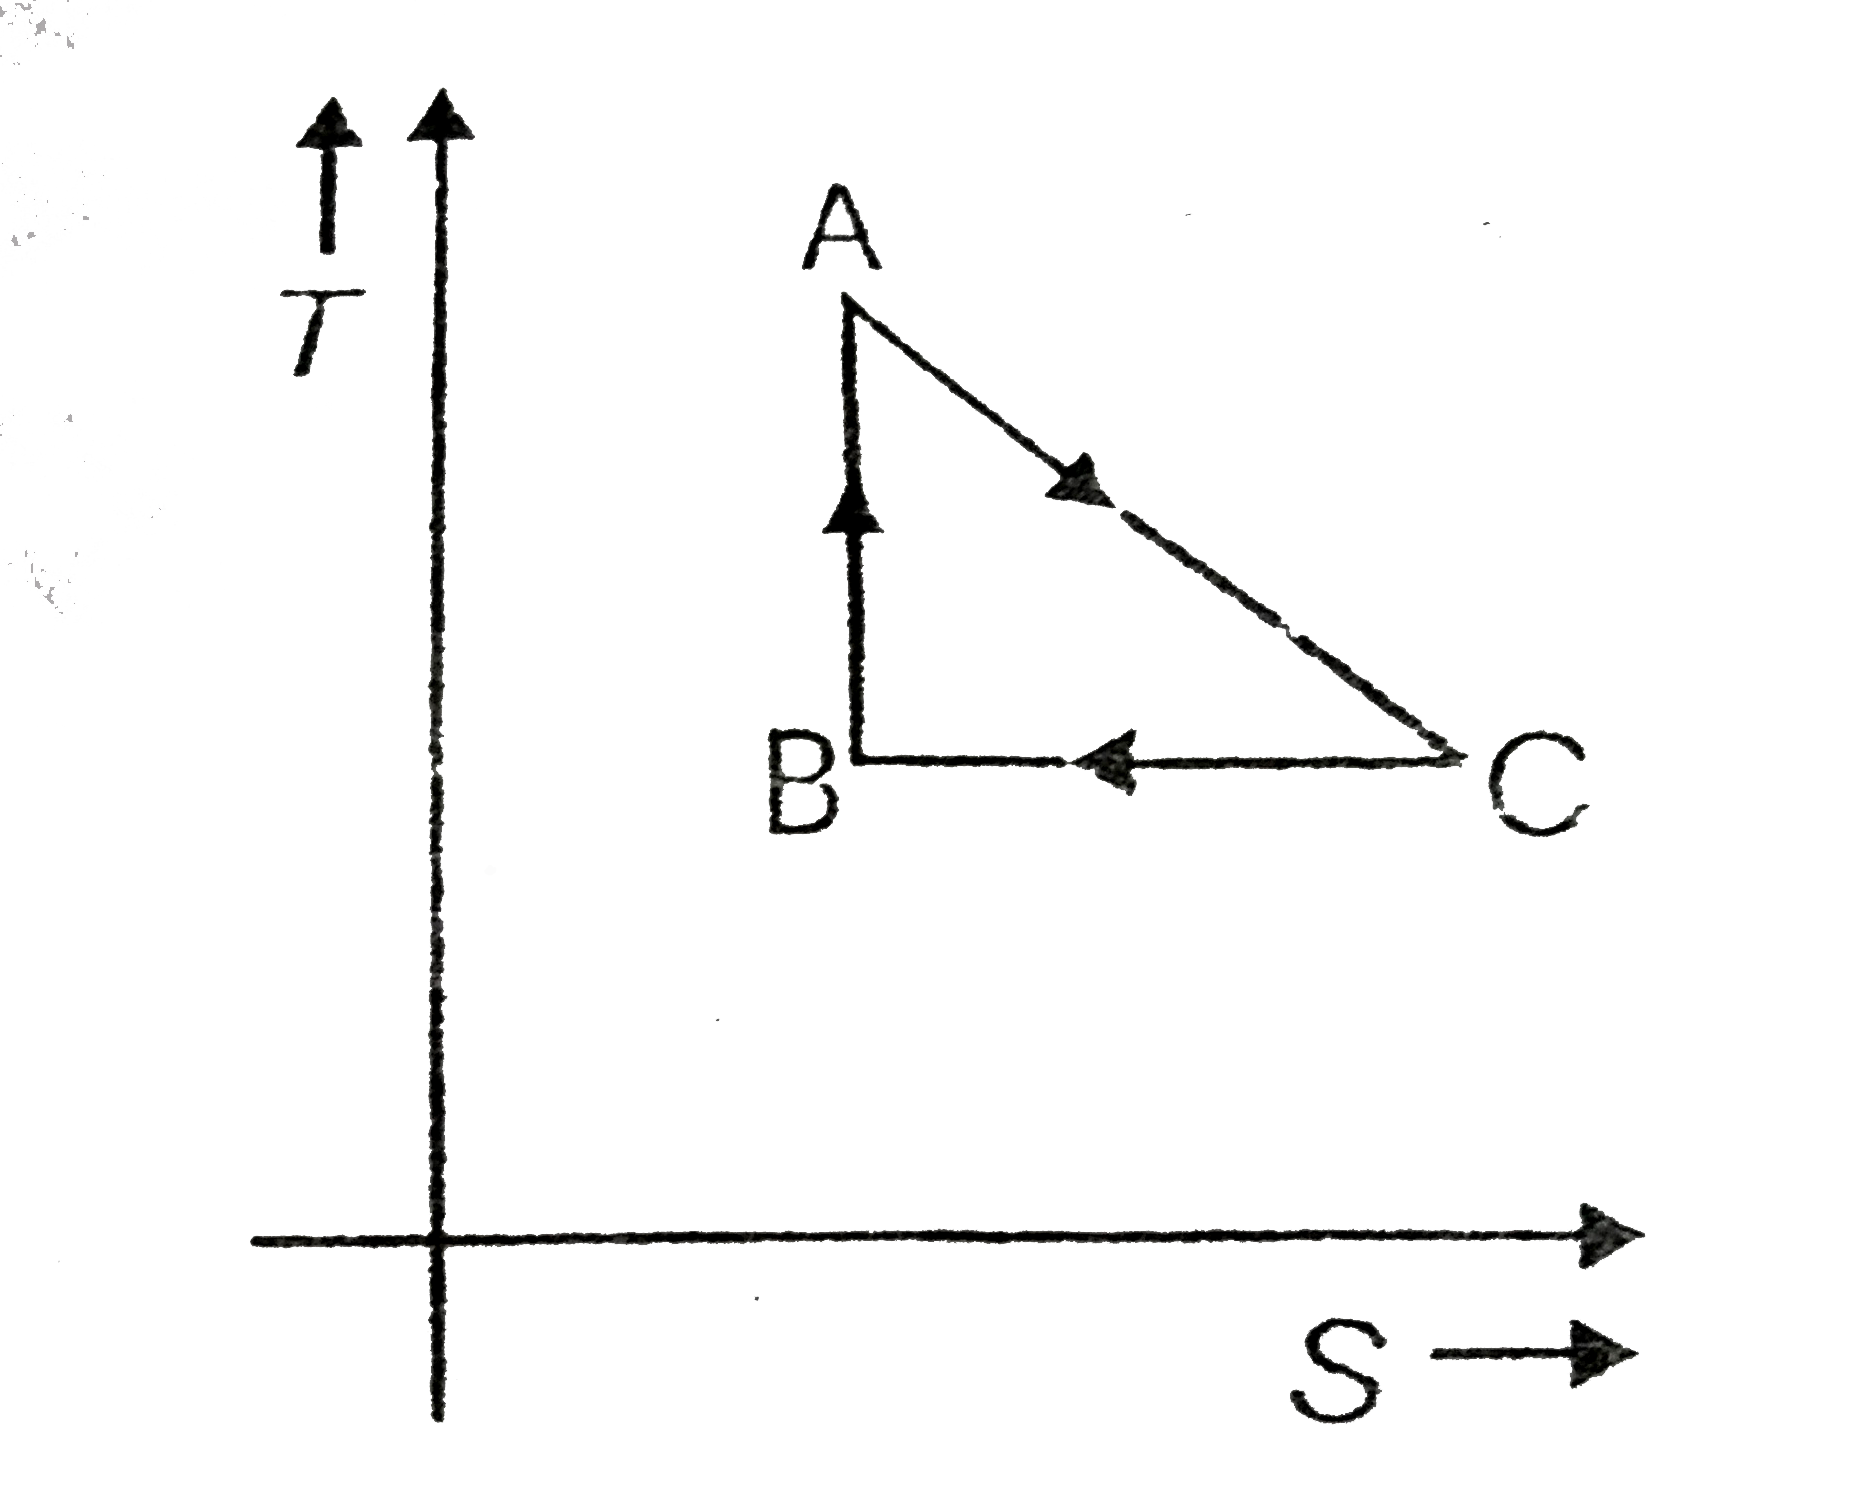
View SolutionAs area under P-V diagram represent work done by gas in a thermodynamic process, area under temperature (T) entropy (S) graph represents heat supplied to the thermodynamic system. Consider the following graph

View SolutionThe indicator diagrams representing minimum and maximum amounts of work done are respectively

View SolutionDuring which of the following thermodynamic process represented by PV diagram the heat energy absorbed by system may be equal to area under PV graph?
View SolutionRepresent PV indicator diagram for a cyclic process.
View SolutionDuring which of the following thermodynamic process represented by PV diagram the heat energy absorbed by system may be equal to area under PV graph?
View SolutionHow is an equilibrium state. represented on a pV -diagram?
View SolutionHow is a process represented on a pV -diagram?
View SolutionThe pV-diagram is a consequence of the fact that a thermodynamic system has only two independent properties' - explain.
View Solution
