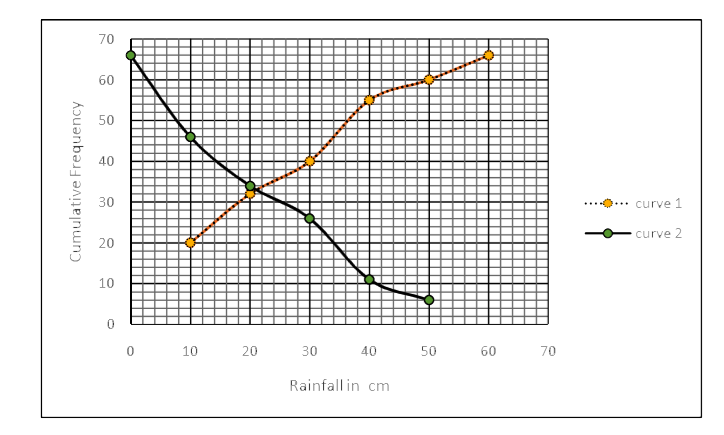
A TV reporter was given a task to prepare a report on the rainfall of the city Dispur of India in a particular year. After collecting the data, he analyzed the data and prepared a report on the rainfall of the city. Using this report, he drew the following graph for a particular time period of 66 days

Based on the above graph, answer the following questions
(i) Identify less than type ogive and more than type ogive from the given graph.
(ii) Find the median rainfall of Dispur
(iii) Obtain the Mode of the data if mean rainfall is 23.4cm
(i) Curve 1 – Less than ogive, Curve2 – More than ogive
(ii) (ii) Median Rainfall = 21 cm
(iii) 3 Median = Mode + 2 mean
∴ Mode = 16.2 cm
Similar Questions
A TV reporter was given a task to prepare a report on the rainfall of the city Dispur of India in a particular year. After collecting the data, he analyzed the data and prepared a report on the rainfall of the city. Using this report, he drew the following graph for a particular time period of 66 days

Based on the above graph, answer the following questions
(i) Identify less than type ogive and more than type ogive from the given graph.
(ii) Find the median rainfall of Dispur
(iii) Obtain the Mode of the data if mean rainfall is 23.4cmView SolutionPrepare a bar graph of the data given in question 28.
View Solution
Knowledge Check
- Question 1 - Select One
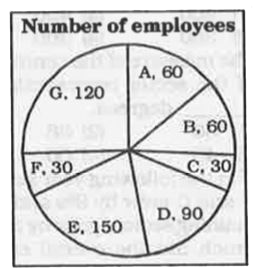
The HR department of a company prepared a report. The pie chart from the report shows number of employees in all the departments that thew company has. Study the diagram and answer the following questions.

What is the total number of employees of the company?A400B600C480D540 - Question 2 - Select One
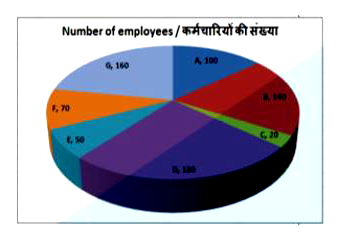
The HR department of an MNC prepared a report. The pie chart from this report represents all the employees of the MNC and the languages that they speak. Study the diagram and answer the following questions.

What is the language the most number of employees speak?
(a)F
(b)C
(c)D
(d)GAFBCCDDG - Question 3 - Select One
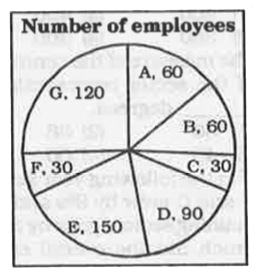
The HR department of a company prepared a report. The pie chart from the report shows number of employees in all the departments that thew company has. Study the diagram and answer the following questions.

The most number of employees belong to which department?AEBFCGDA
Who prepared the H.D. report in India ? What are its units of analysis ?
View SolutionRainfall (in cm) recorded in 50 cities on a particular day. Find the mean rainfall by direct method.
 View Solution
The rainfall (in mm) in a city on 7 days of a certain week was recorded as follows: (i) Find the range of the rainfall in the above data. (ii) Find the mean rainfall for the week. (iii) On how many days was the rainfall less than the mean rainfal
View Solution
Report your answer as XYView Solution
Report your answer as XYView Solution
