During a phase transition of a substance the temperature (T) verse heat energy (Q) graph is shown below. Identify the regions of the graph which show an increase in only PE.
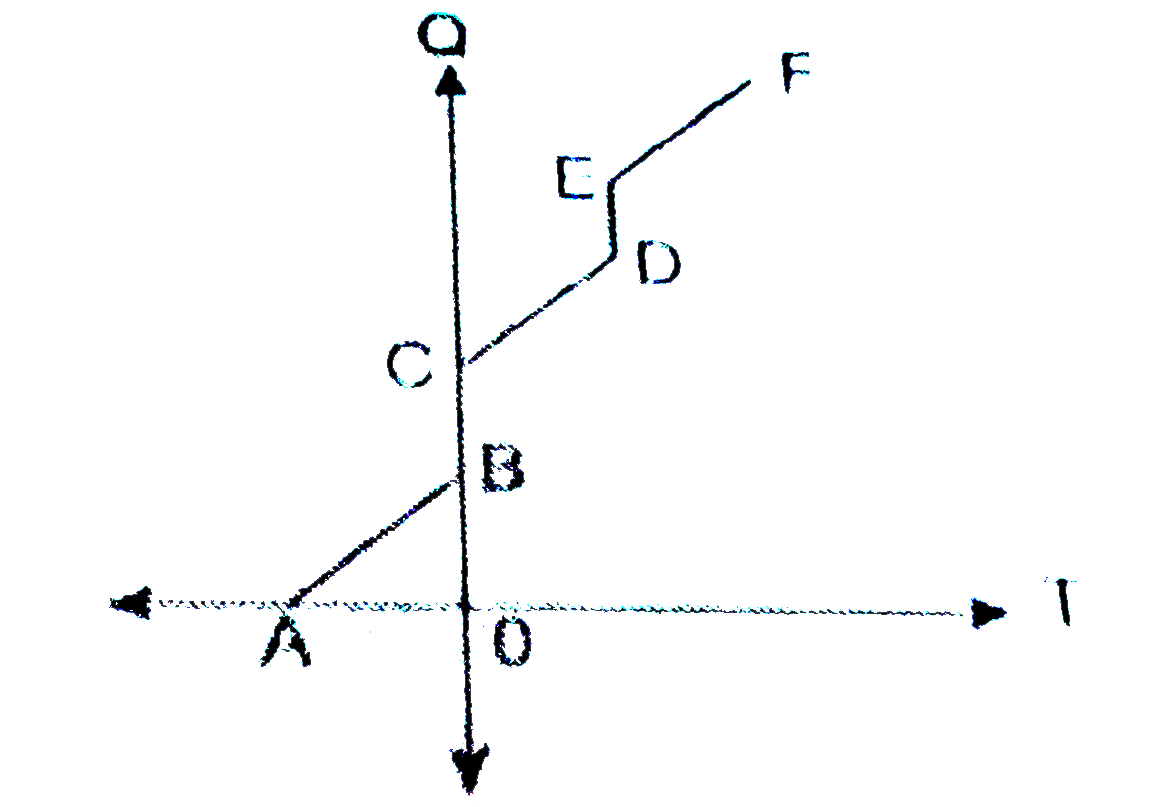
AB, BC
BC, DE
CD, EF
all the regions in the given graph
b
Topper's Solved these Questions
- NATURE OF MATTER BOOK - PEARSON IIT JEE FOUNDATIONCHAPTER - NATURE OF MATTER EXERCISE - LEVEL 2
22 Videos
- NATURE OF MATTER BOOK - PEARSON IIT JEE FOUNDATIONCHAPTER - NATURE OF MATTER EXERCISE - LEVEL 3
10 Videos
- NATURE OF MATTER BOOK - PEARSON IIT JEE FOUNDATIONCHAPTER - NATURE OF MATTER EXERCISE - ESSAY TYPE QUESTIONS
4 Videos
- METALS AND NON-METALSBOOK - PEARSON IIT JEE FOUNDATIONCHAPTER - METALS AND NON-METALSEXERCISE - Level-3 Concept Application
10 Videos
- Organic ChemistryBOOK - PEARSON IIT JEE FOUNDATIONCHAPTER - Organic ChemistryEXERCISE - Level 3
9 Videos
Similar Questions
Knowledge Check
Identify P,Q, and R in the graph shown below
 A P Q RChlorophyll b Chlorophyll a CarotenoidsB P Q RChlorophyll a Chlorophyll b CarotenoidsC P Q RChlorophyll a Carotenoids Chlorophyll bD P Q RChlorophyll b Carotenoids Chlorophyll a
Which of the substances A, B or C has the highest specific heat ? The temperature vs time graph is shown
 AABBCCDAll have equal specific heat
The distribution of molecular kinetic energy at two temperature is as shown in the following graph:

Which is the following concluison is/are correct?AThe number of molecules with energy Ea or greater is proportional to the shaded area for each temperature.BThe number of molecules with energy Ea or less is proportional to the shaded area for each temperature.CThe number of molecules with energy Ea is the mean of all temperatures.DThe graph follows the Maxwell-Boltzmann energy distribution law.
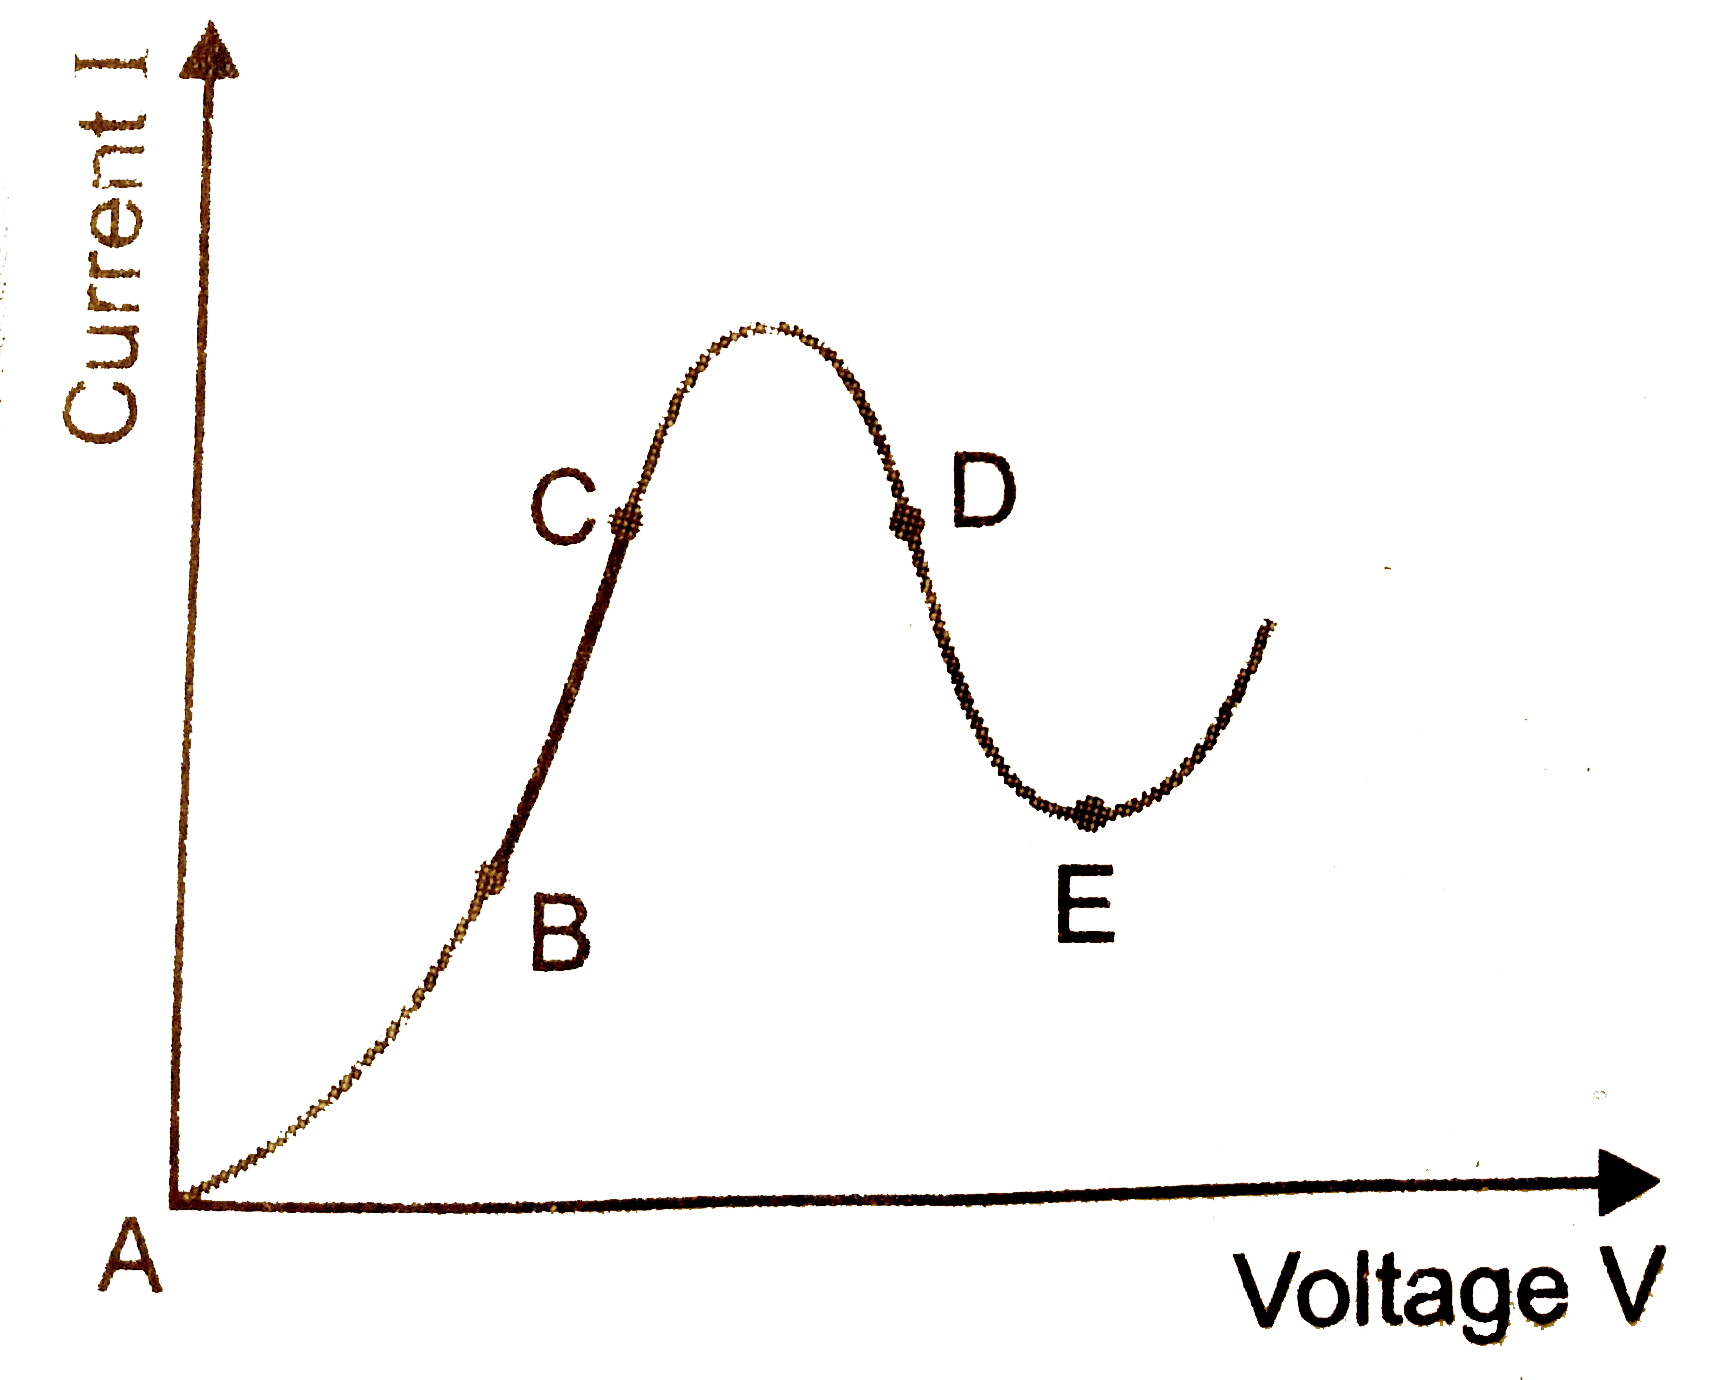
Graph showing the variation of current versus voltage for a material GaAs is shown in figure. Identify the region of (i) negative resistance (ii) where Ohm's law is obeyed.
View Solution(a) Draw graph showing the variation of current versus voltage in an electroyte when an external resistance is also connceted.
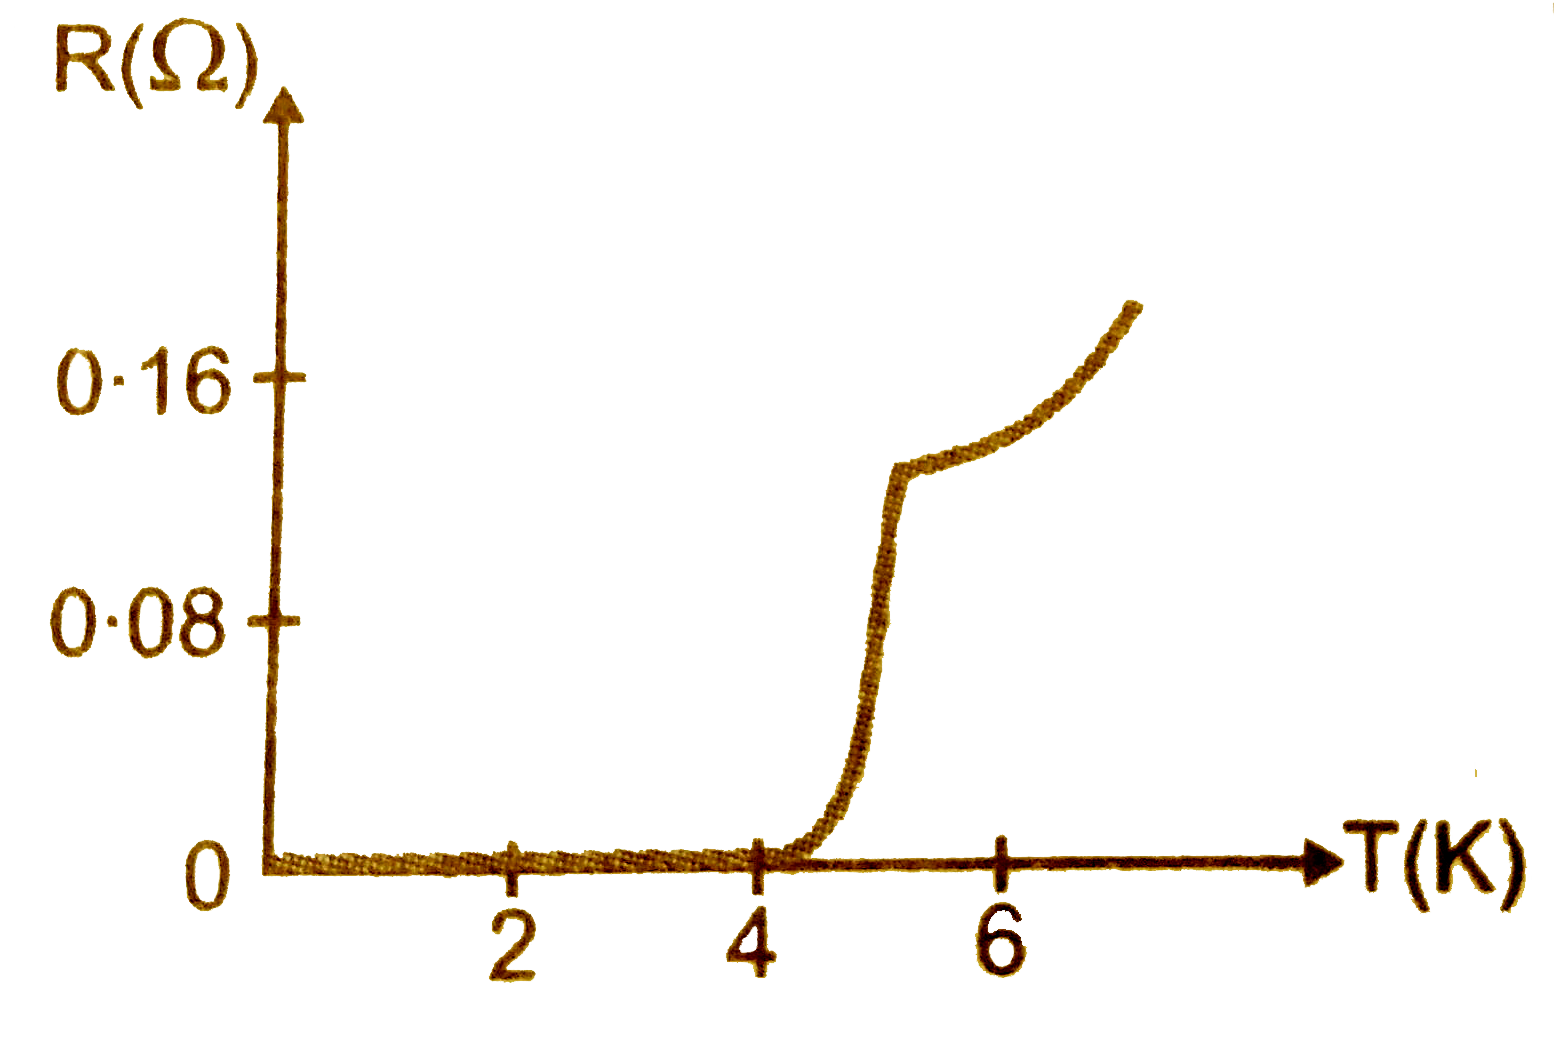
(b) (i) The graph between resistance (R ) and temperature (T) for Hg is shown in the figure (a). Explain the behaviour of Hg near 4k.
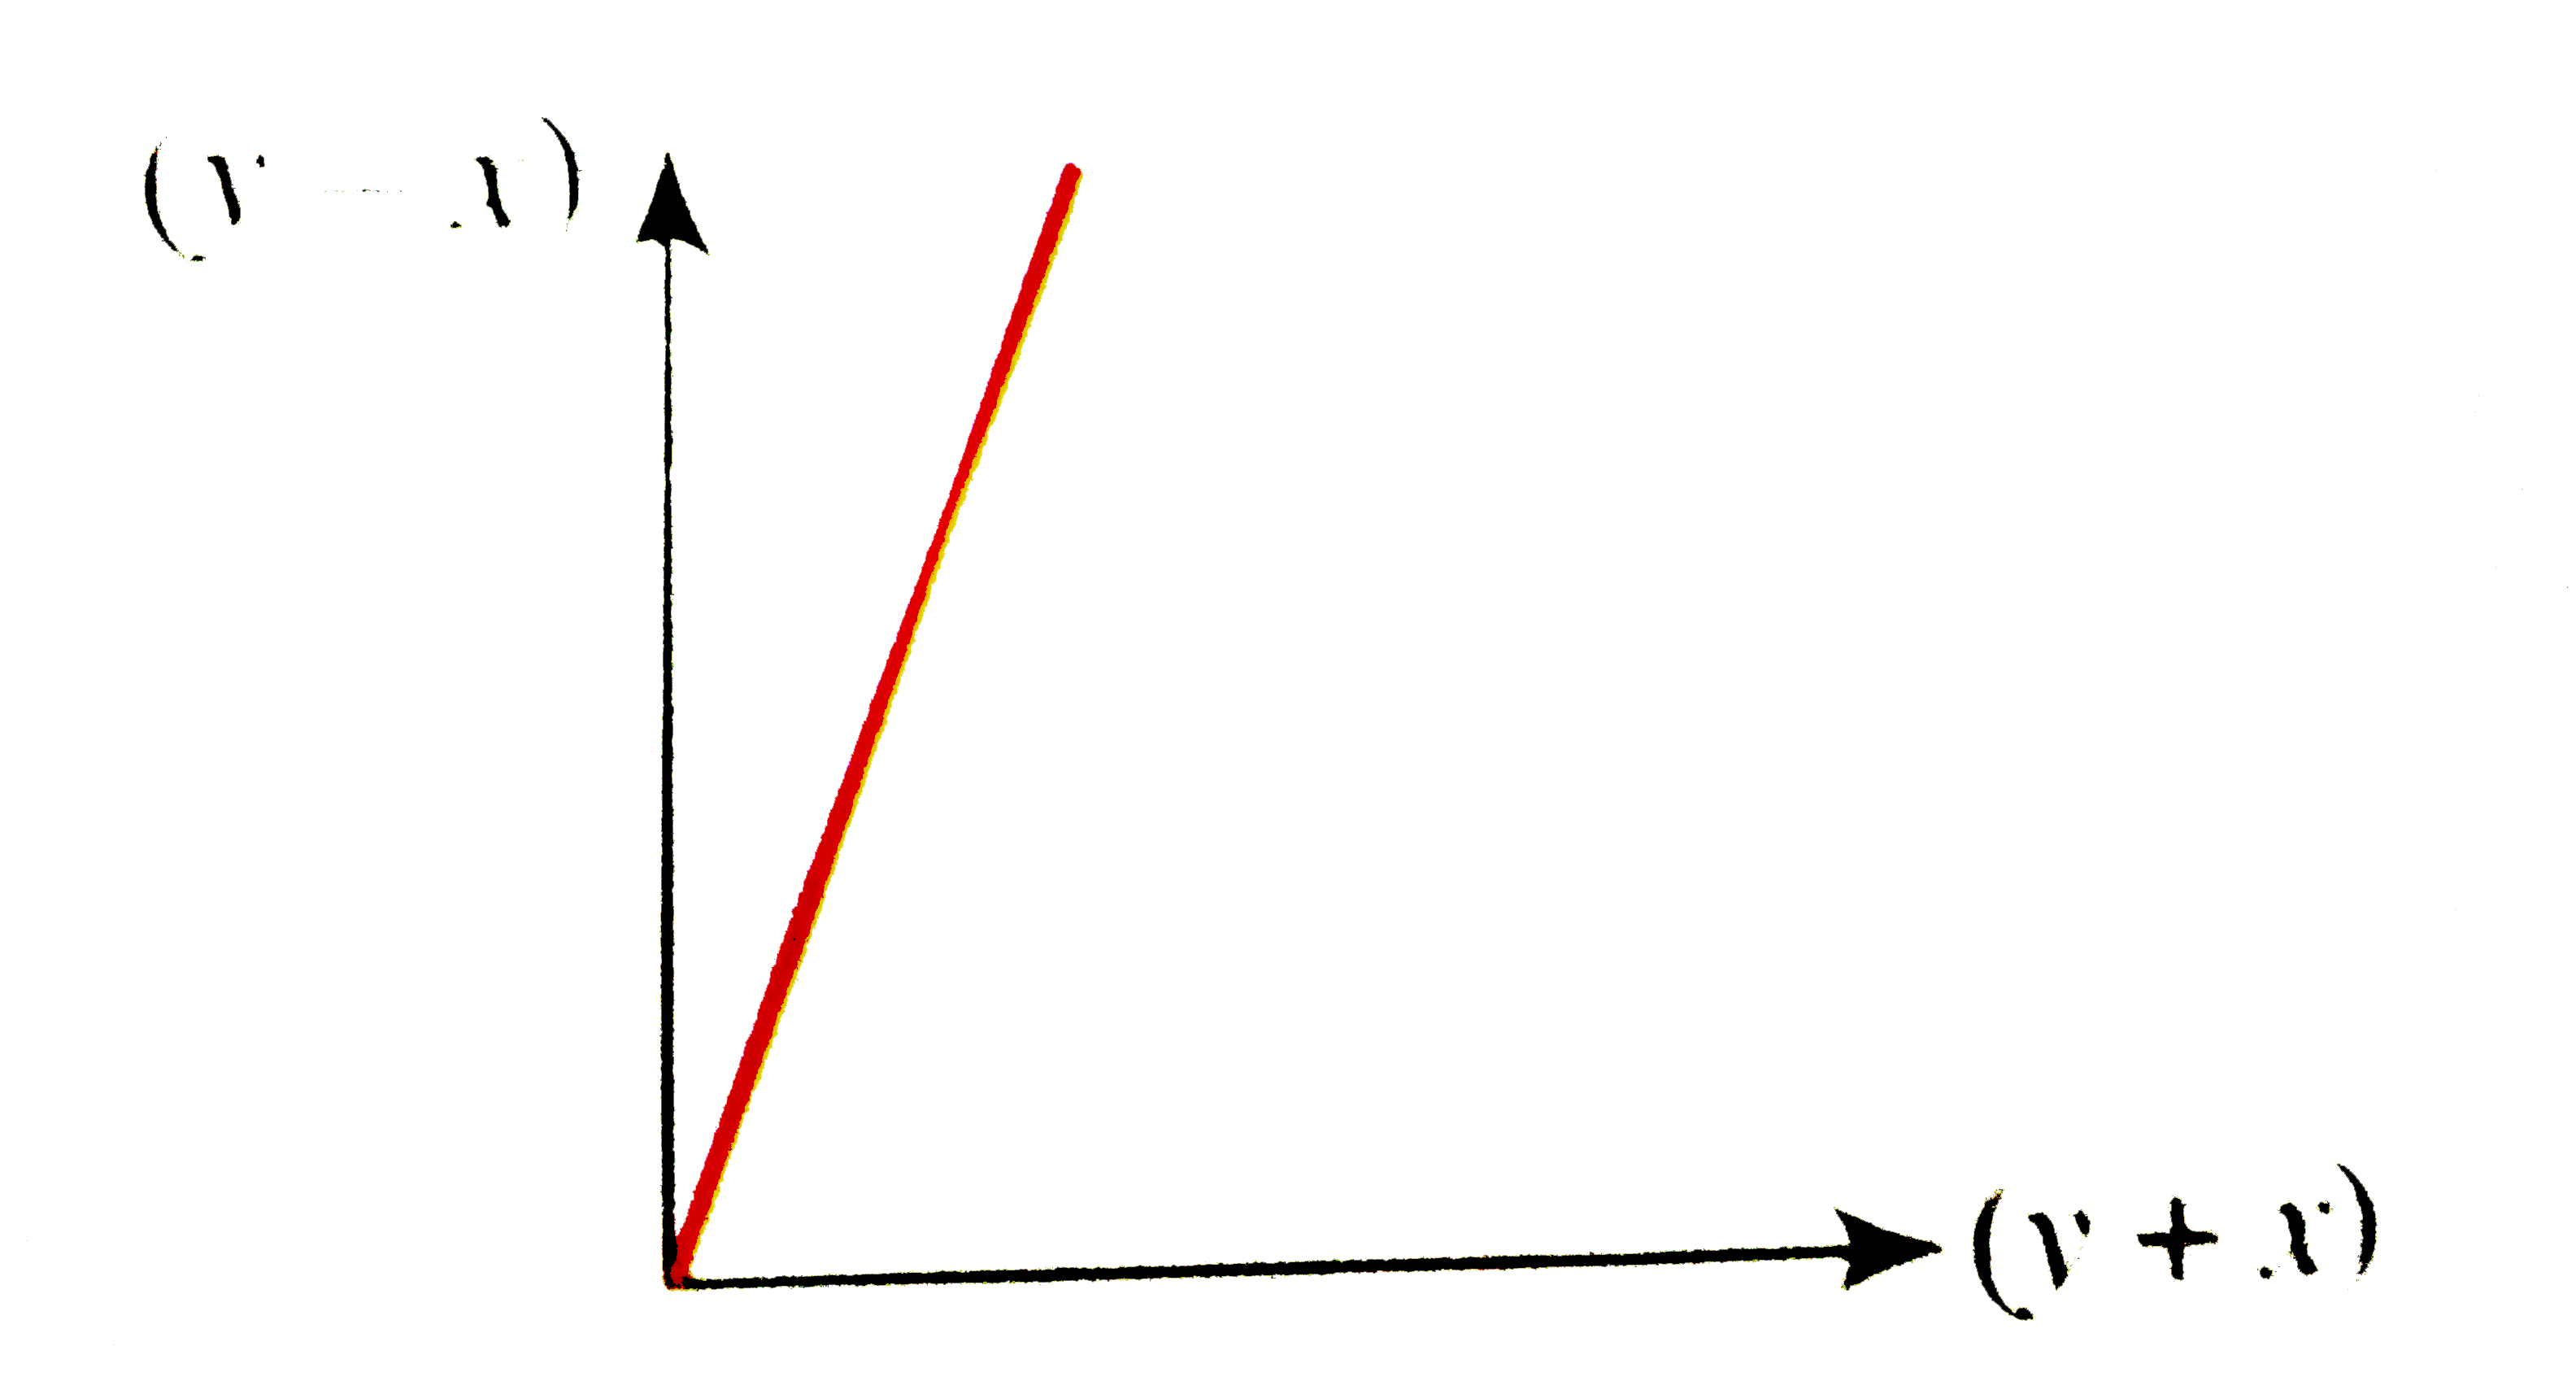
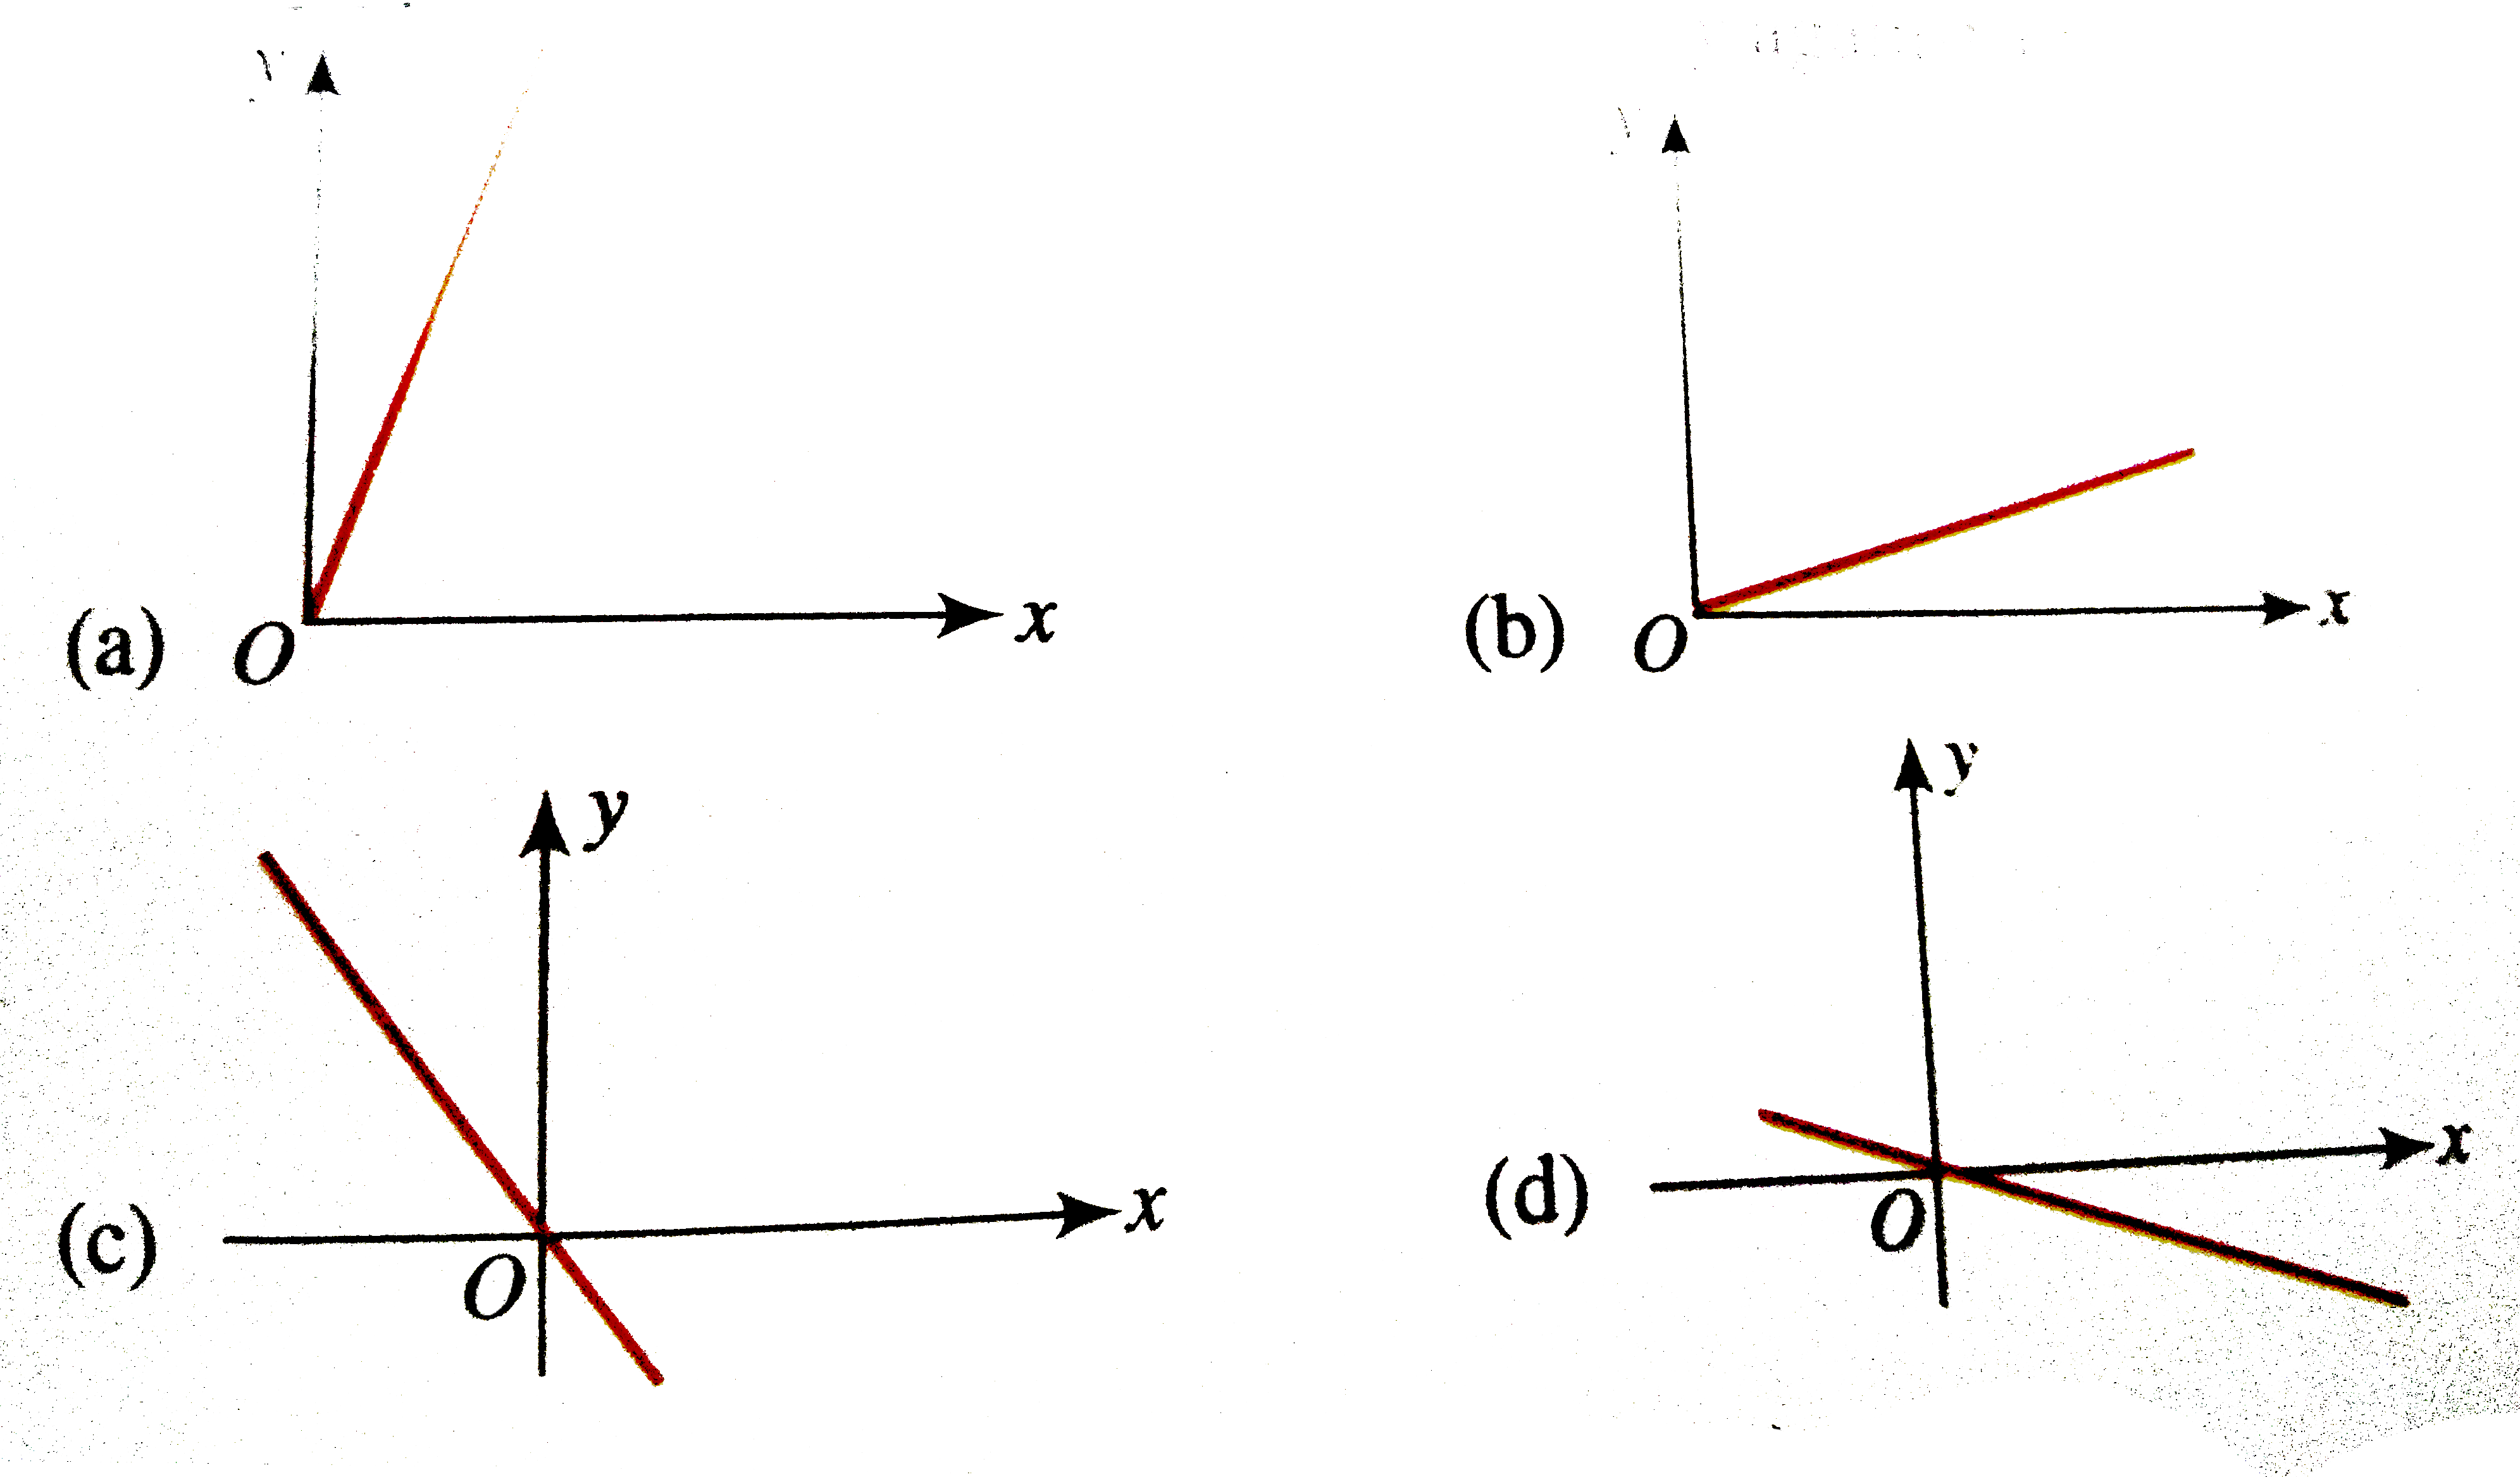
(ii) In which region of the graph shown in the figure (b) is the resistance negative and why?

View SolutionIf an object at absolute temperature (1) radiates energy at rate R, then select correct graph showing the variation of loge R with loge (T).
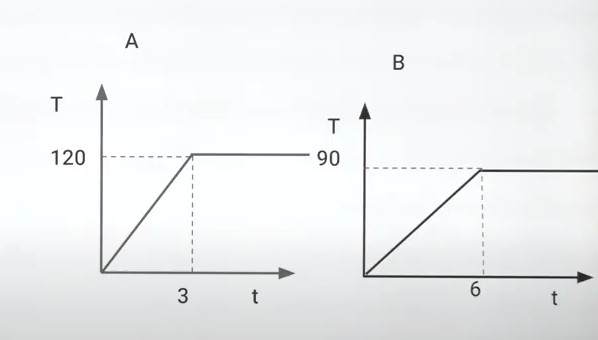
View SolutionTemperature vs. time graphs are given below for 2 substances. Compare specific heat capacity
View SolutionThe given graph shows the heating curve for a pure substance. The temperature rises with time as the substance is heated :
(a) What is the physical state of the substance at the points A, B, C and D ?
What is the melting point of the substance ?
(c ) What is its boiling point ?
(d) What happens to the temperature while the substance is changing state ?
(e ) The substance is not water. How can you judge from the graph ?
View Solution

