This graph explains ……………… .
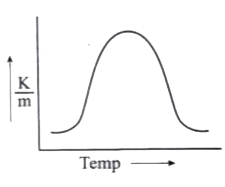
Absorption
Physical adsorption
Chemical adsorption
Desorption
The correct Answer is:C
Chemical adsorption
Topper's Solved these Questions
- SAMPLE PAPER - 19 ( UNSOLVED)BOOK - FULL MARKSCHAPTER - SAMPLE PAPER - 19 ( UNSOLVED)EXERCISE - PART - II
9 Videos
- SAMPLE PAPER - 19 ( UNSOLVED)BOOK - FULL MARKSCHAPTER - SAMPLE PAPER - 19 ( UNSOLVED)EXERCISE - PART - III
4 Videos
- SAMPLE PAPER - 18 (UNSOLVED)BOOK - FULL MARKSCHAPTER - SAMPLE PAPER - 18 (UNSOLVED)EXERCISE - PART - IV
5 Videos
- SAMPLE PAPER - 20 (UNSOLVED)BOOK - FULL MARKSCHAPTER - SAMPLE PAPER - 20 (UNSOLVED)EXERCISE - PART - IV
1 Videos
Similar Questions
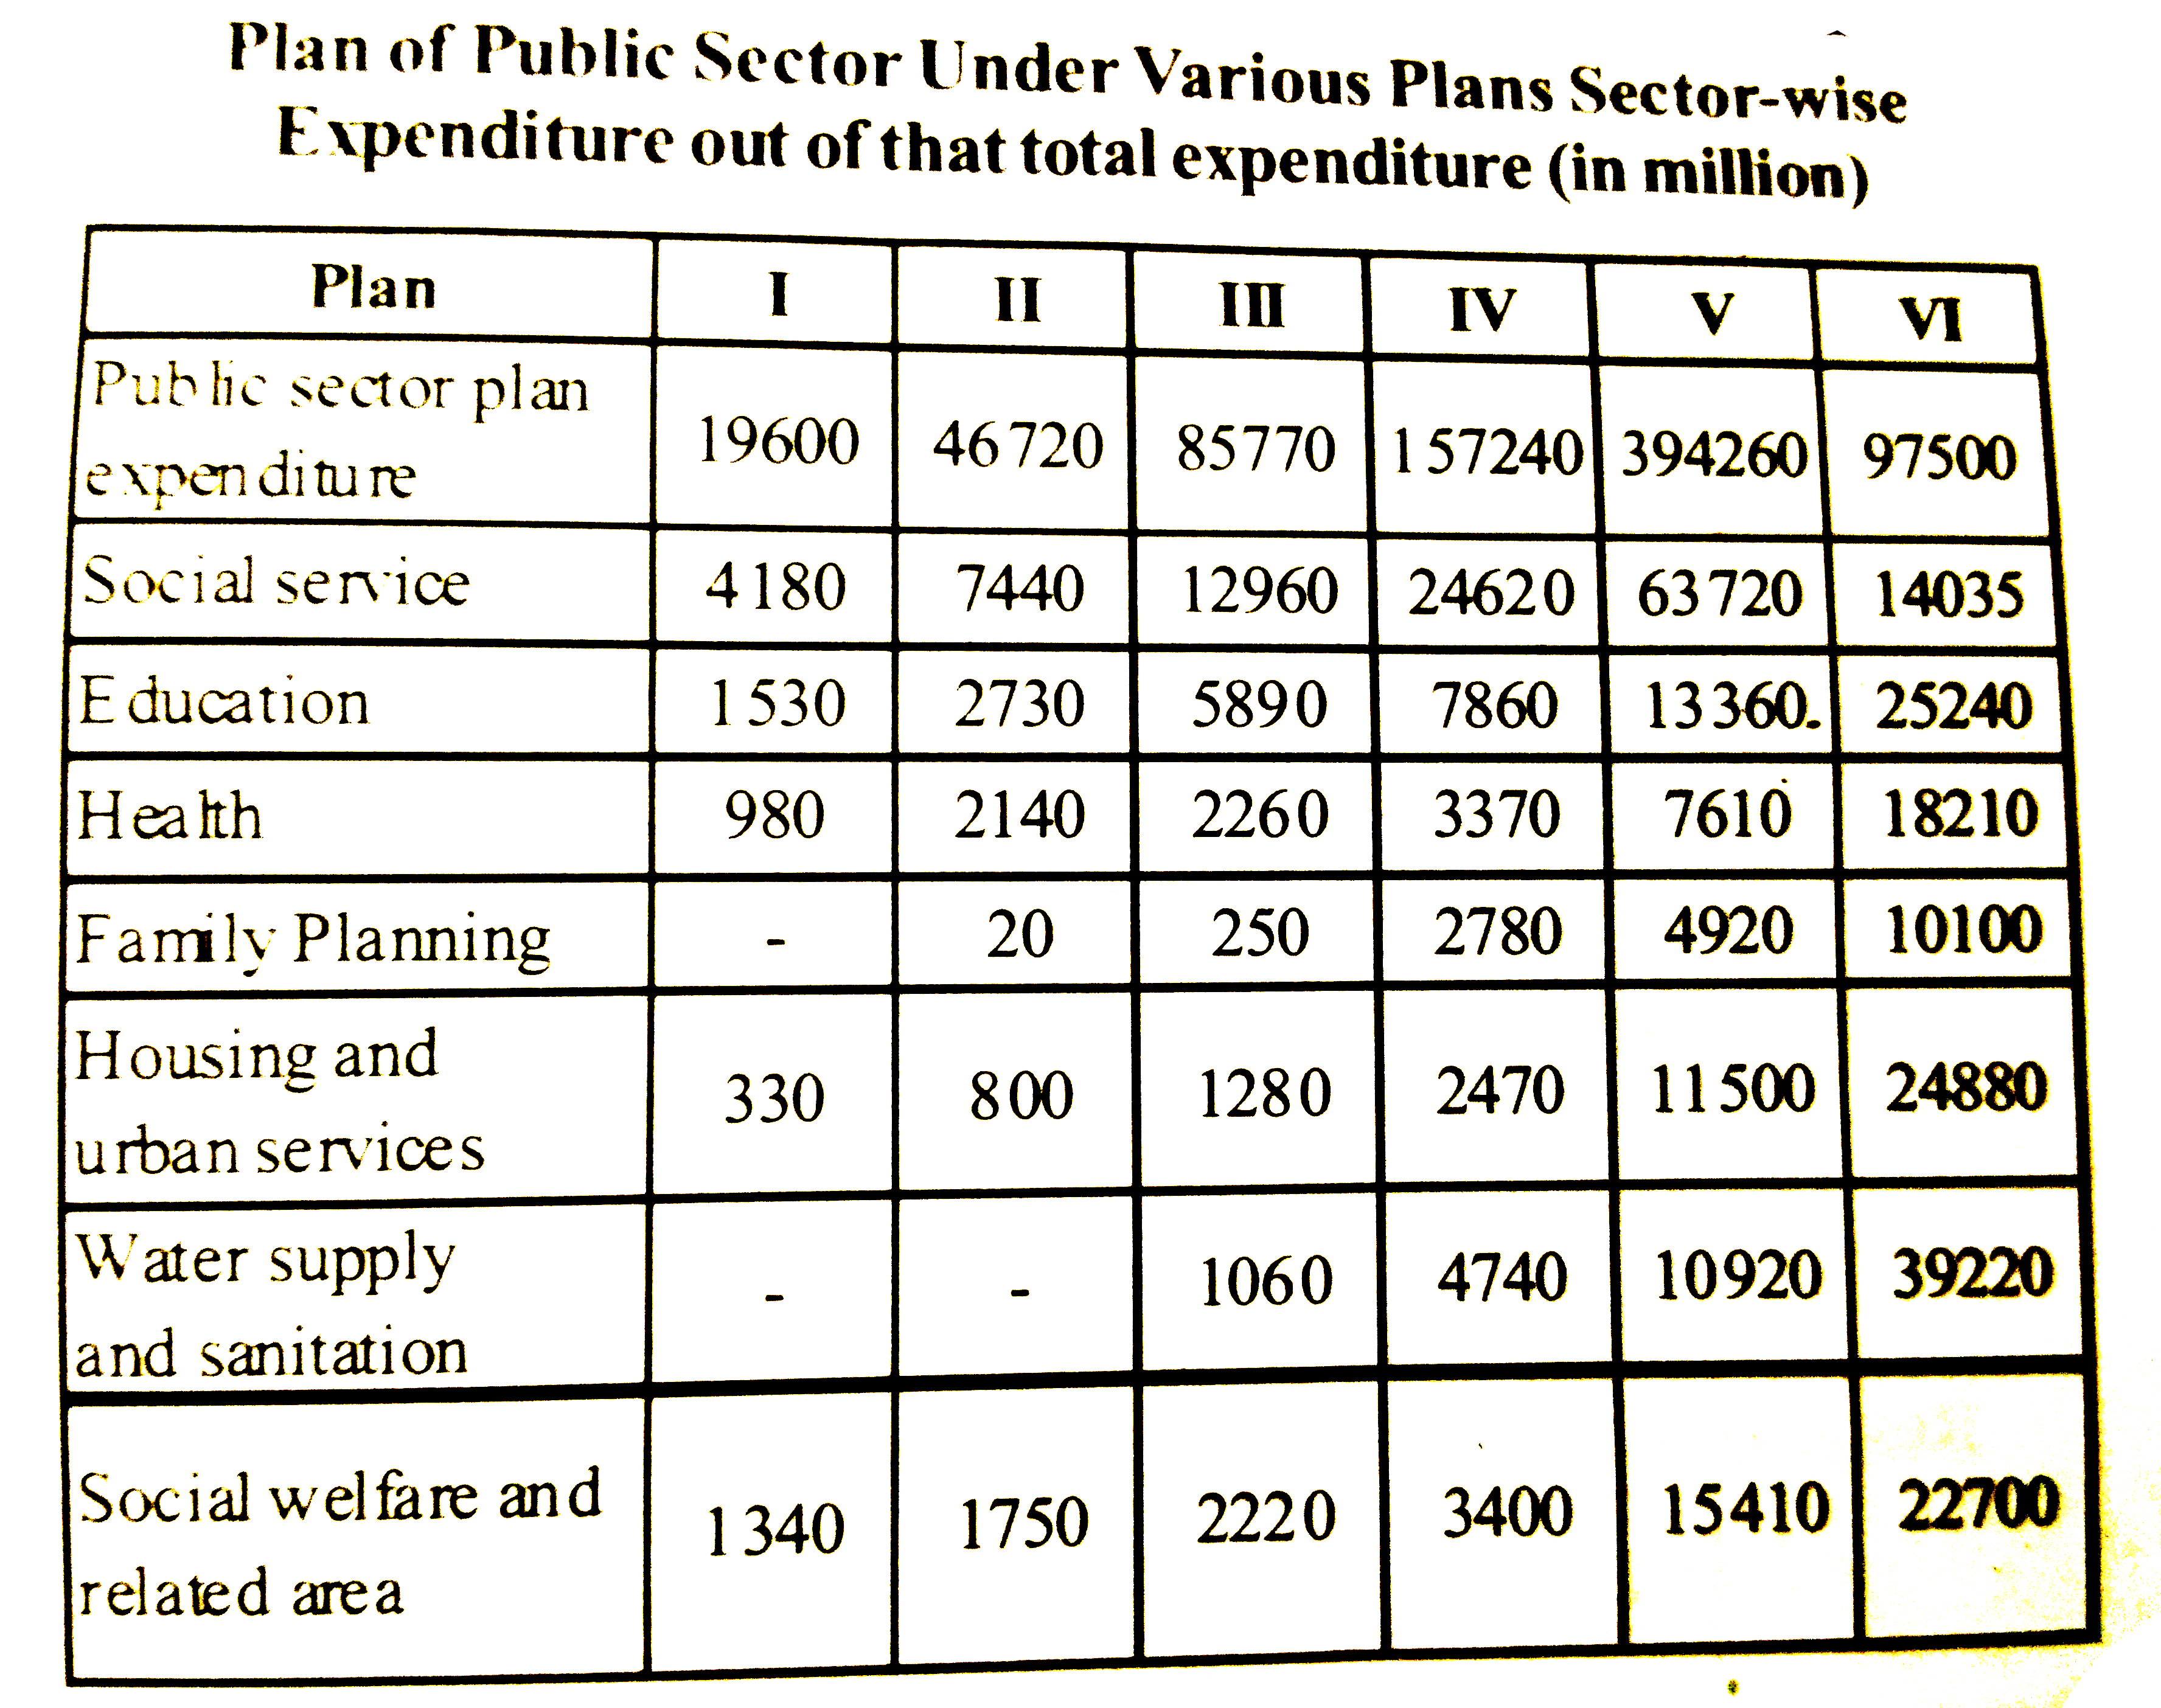
In various plans in the ratio of expenditure on public sector, which of the following graphs explain best the expenditure on water supply and sanitation ?
View SolutionDraw the circuit diagram for studying the characteristics of a transistor in common emitter configuration. Explain briefly and show how input and output characteristics are drawn.
View Solution
Knowledge Check
Which among the following graphs explains the photoelectric effect?
A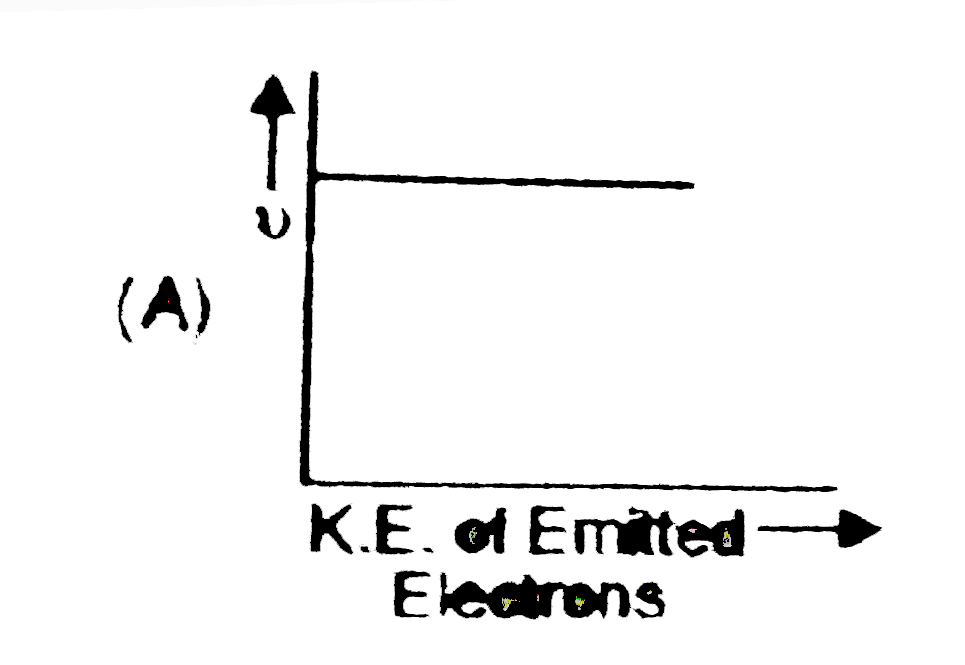 B
B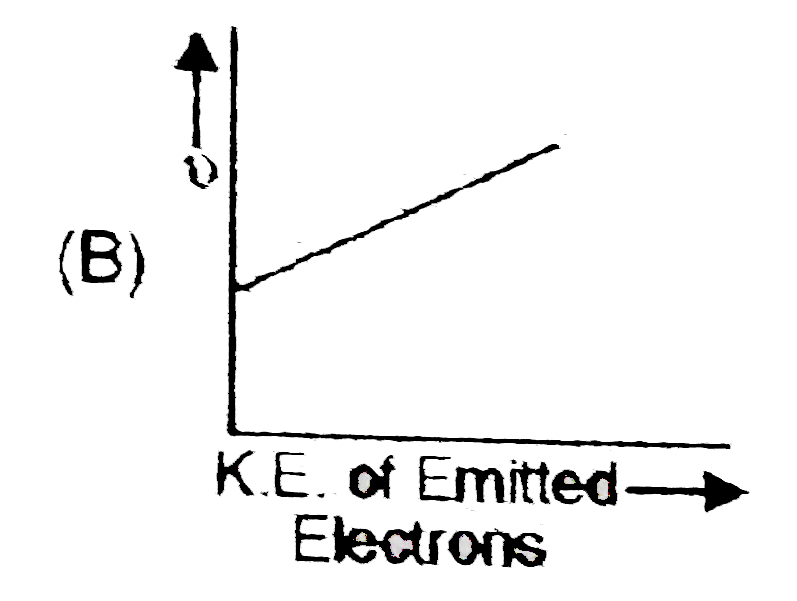 C
C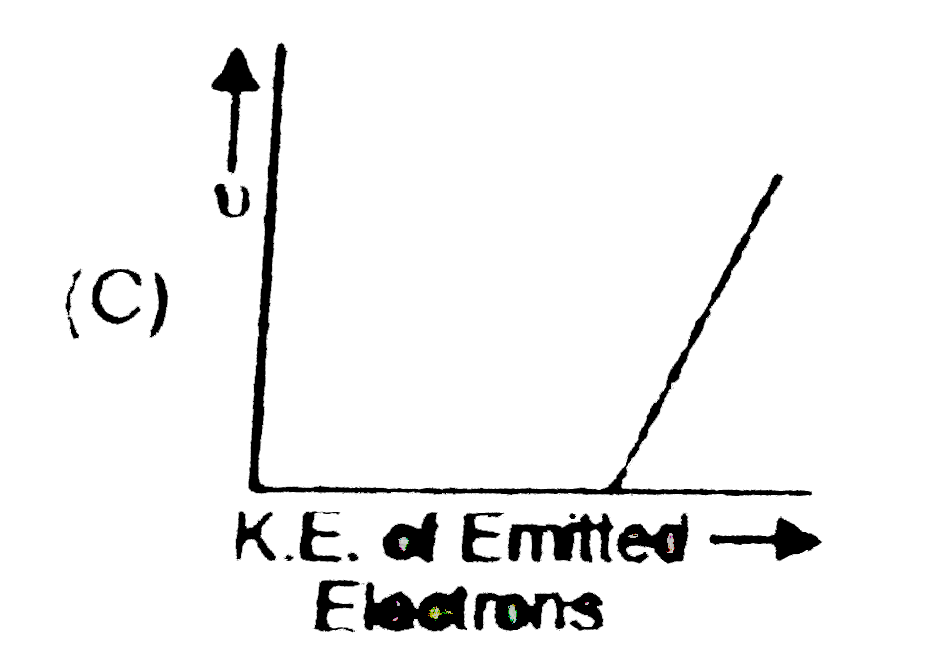 D
D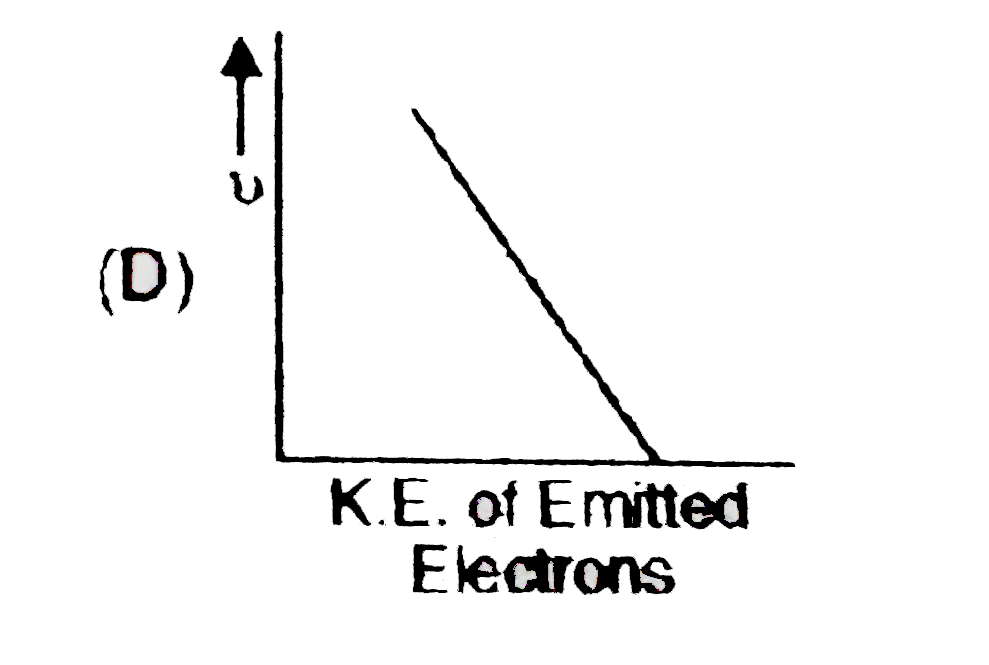
Discuss stress vs. strain graph, explaining clearly the terms elastic limit and permanent set.
View SolutionDraw the circuit diagram for studying the characteristics of a transistor in common emitter configuration. Explain briefly and show how input and output characteristics are drawn.
View SolutionWhat is latent heat ? Give its units. With the help of a suitable graph, explain the terms latent heat of fusion and latent heat of vaporisation.
View SolutionObserve the toothpick pattern given below:

(a) Imagine that this pattern continues. Complete the table to show the number of toothpicks in the first six terms.

(b) Make a graph by taking the pattern numbers on the horizontal axis and the number of toothpicks on the vertical axis. Make the horizontal axis from 0 to 10 and the vertical axis from 0 to 30.
(c) Use your graph to predict the number of toothpicks in patterns 7 and 8. Check your answers by actually drawing them.
(d) Would it make sense to join the points on this graph? Explain.
View SolutionStudy the graph given below. Explain how is oxygen concentration affected in the river when sewage is discharged into it.
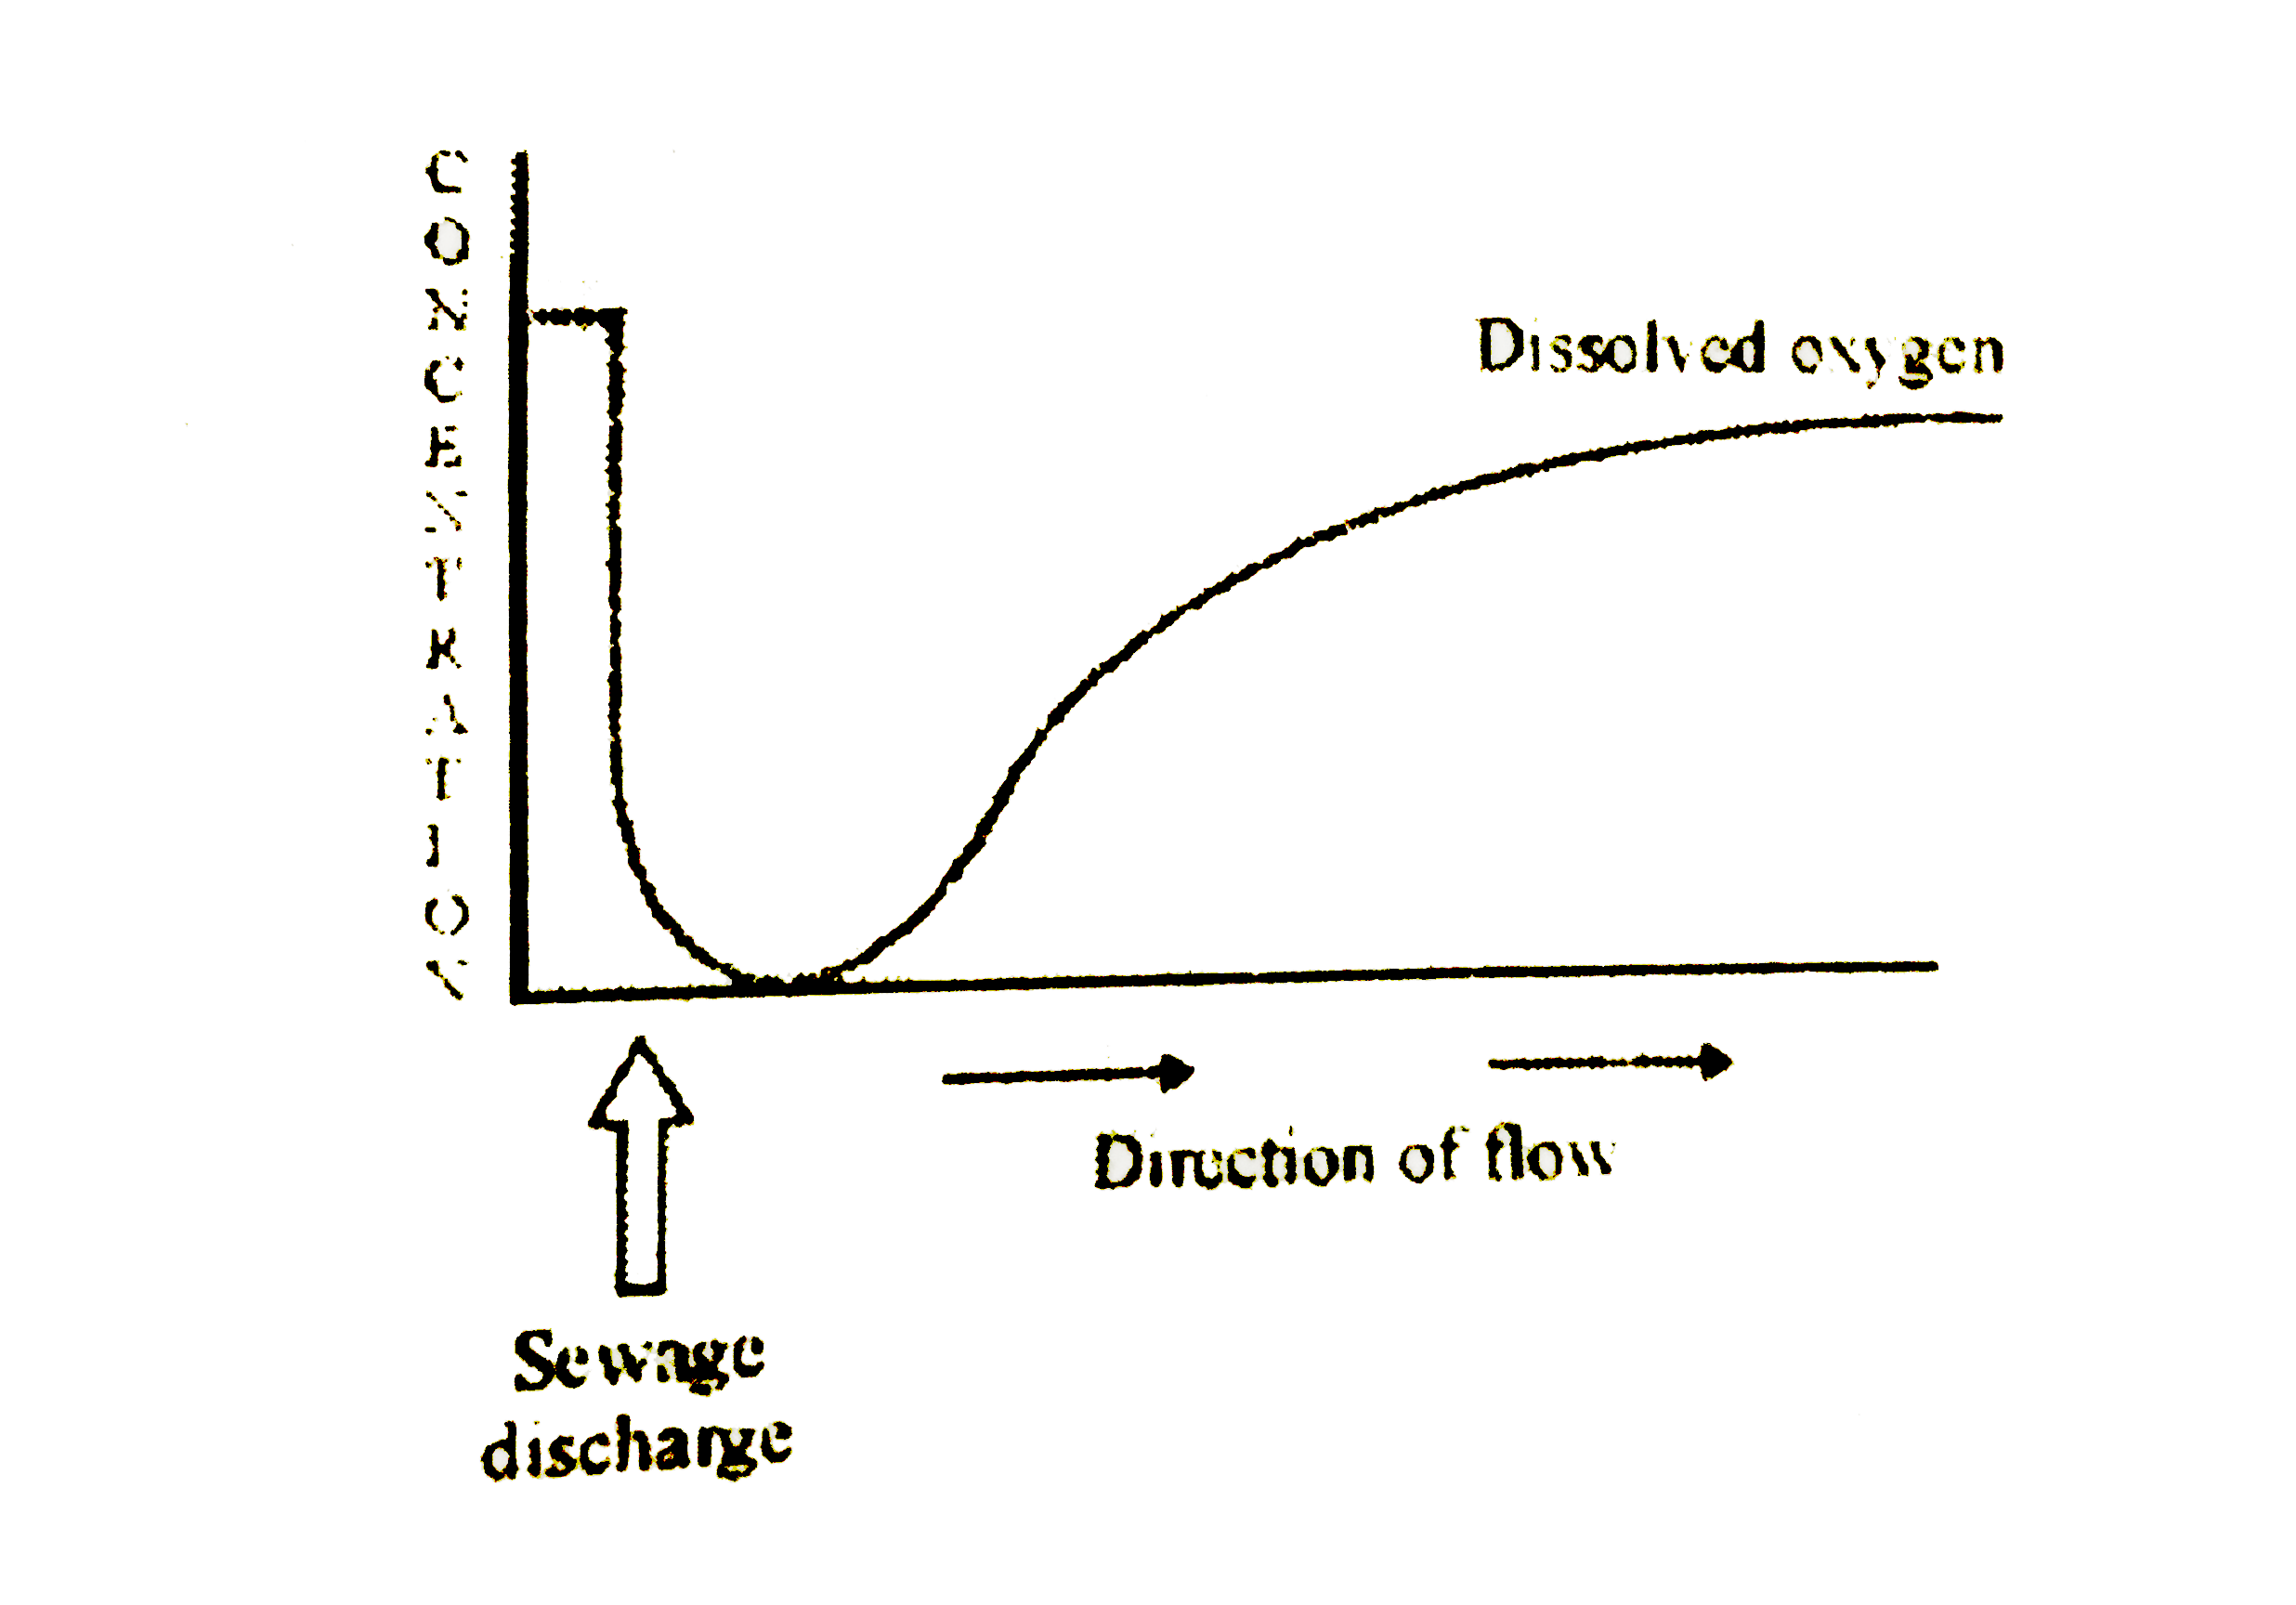
View SolutionStudy the graph given below. Explain how is oxygen concentration affected in the river when sewage is discharged into it.

View SolutionDraw, the velocity - time graph for the case explained in example 1.21.
View Solution
