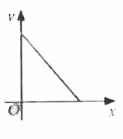
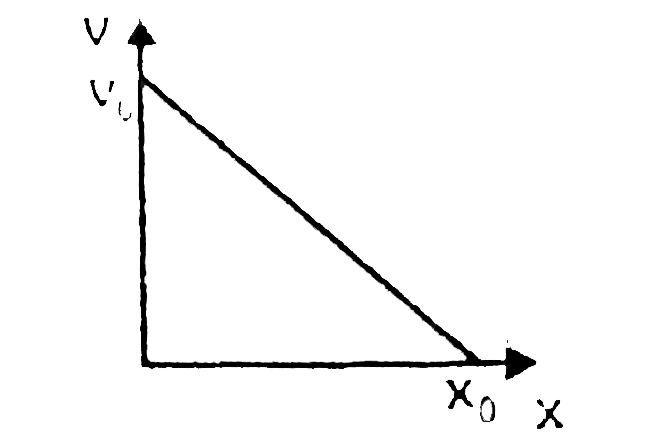
The given graph shows the variation of velocity (v) with position (x) for a particle moving along a straight line. Which of the following graph shows the variation of acceleration (a) with position (x)?
 Solution in Kannada
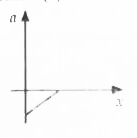
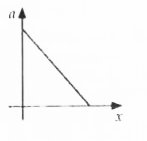
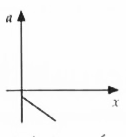
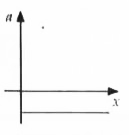
The correct Answer is:A
(a): v = -kx + c (given line with negative slope) dvdt=−kdxdt⇒a=−k(−kx+c)=k2x–kc . and x = 0 ⇒ a = -ve and slope of a – x graph is positive.
Topper's Solved these Questions
Similar Questions
The energy equivalent to a substance of mass 1 g is
View SolutionA photon will have greater energy if it has greater
View SolutionFigure shows the position the graph for a particle in one dimensional motion. Which of the graphs in fugure represent the variation in the velocity of the particle with time ?
View SolutionThe given graph shows the variation of velocity with displacement. Which one of the graphs given below correctly represents the variation of acceleration with displacement ?
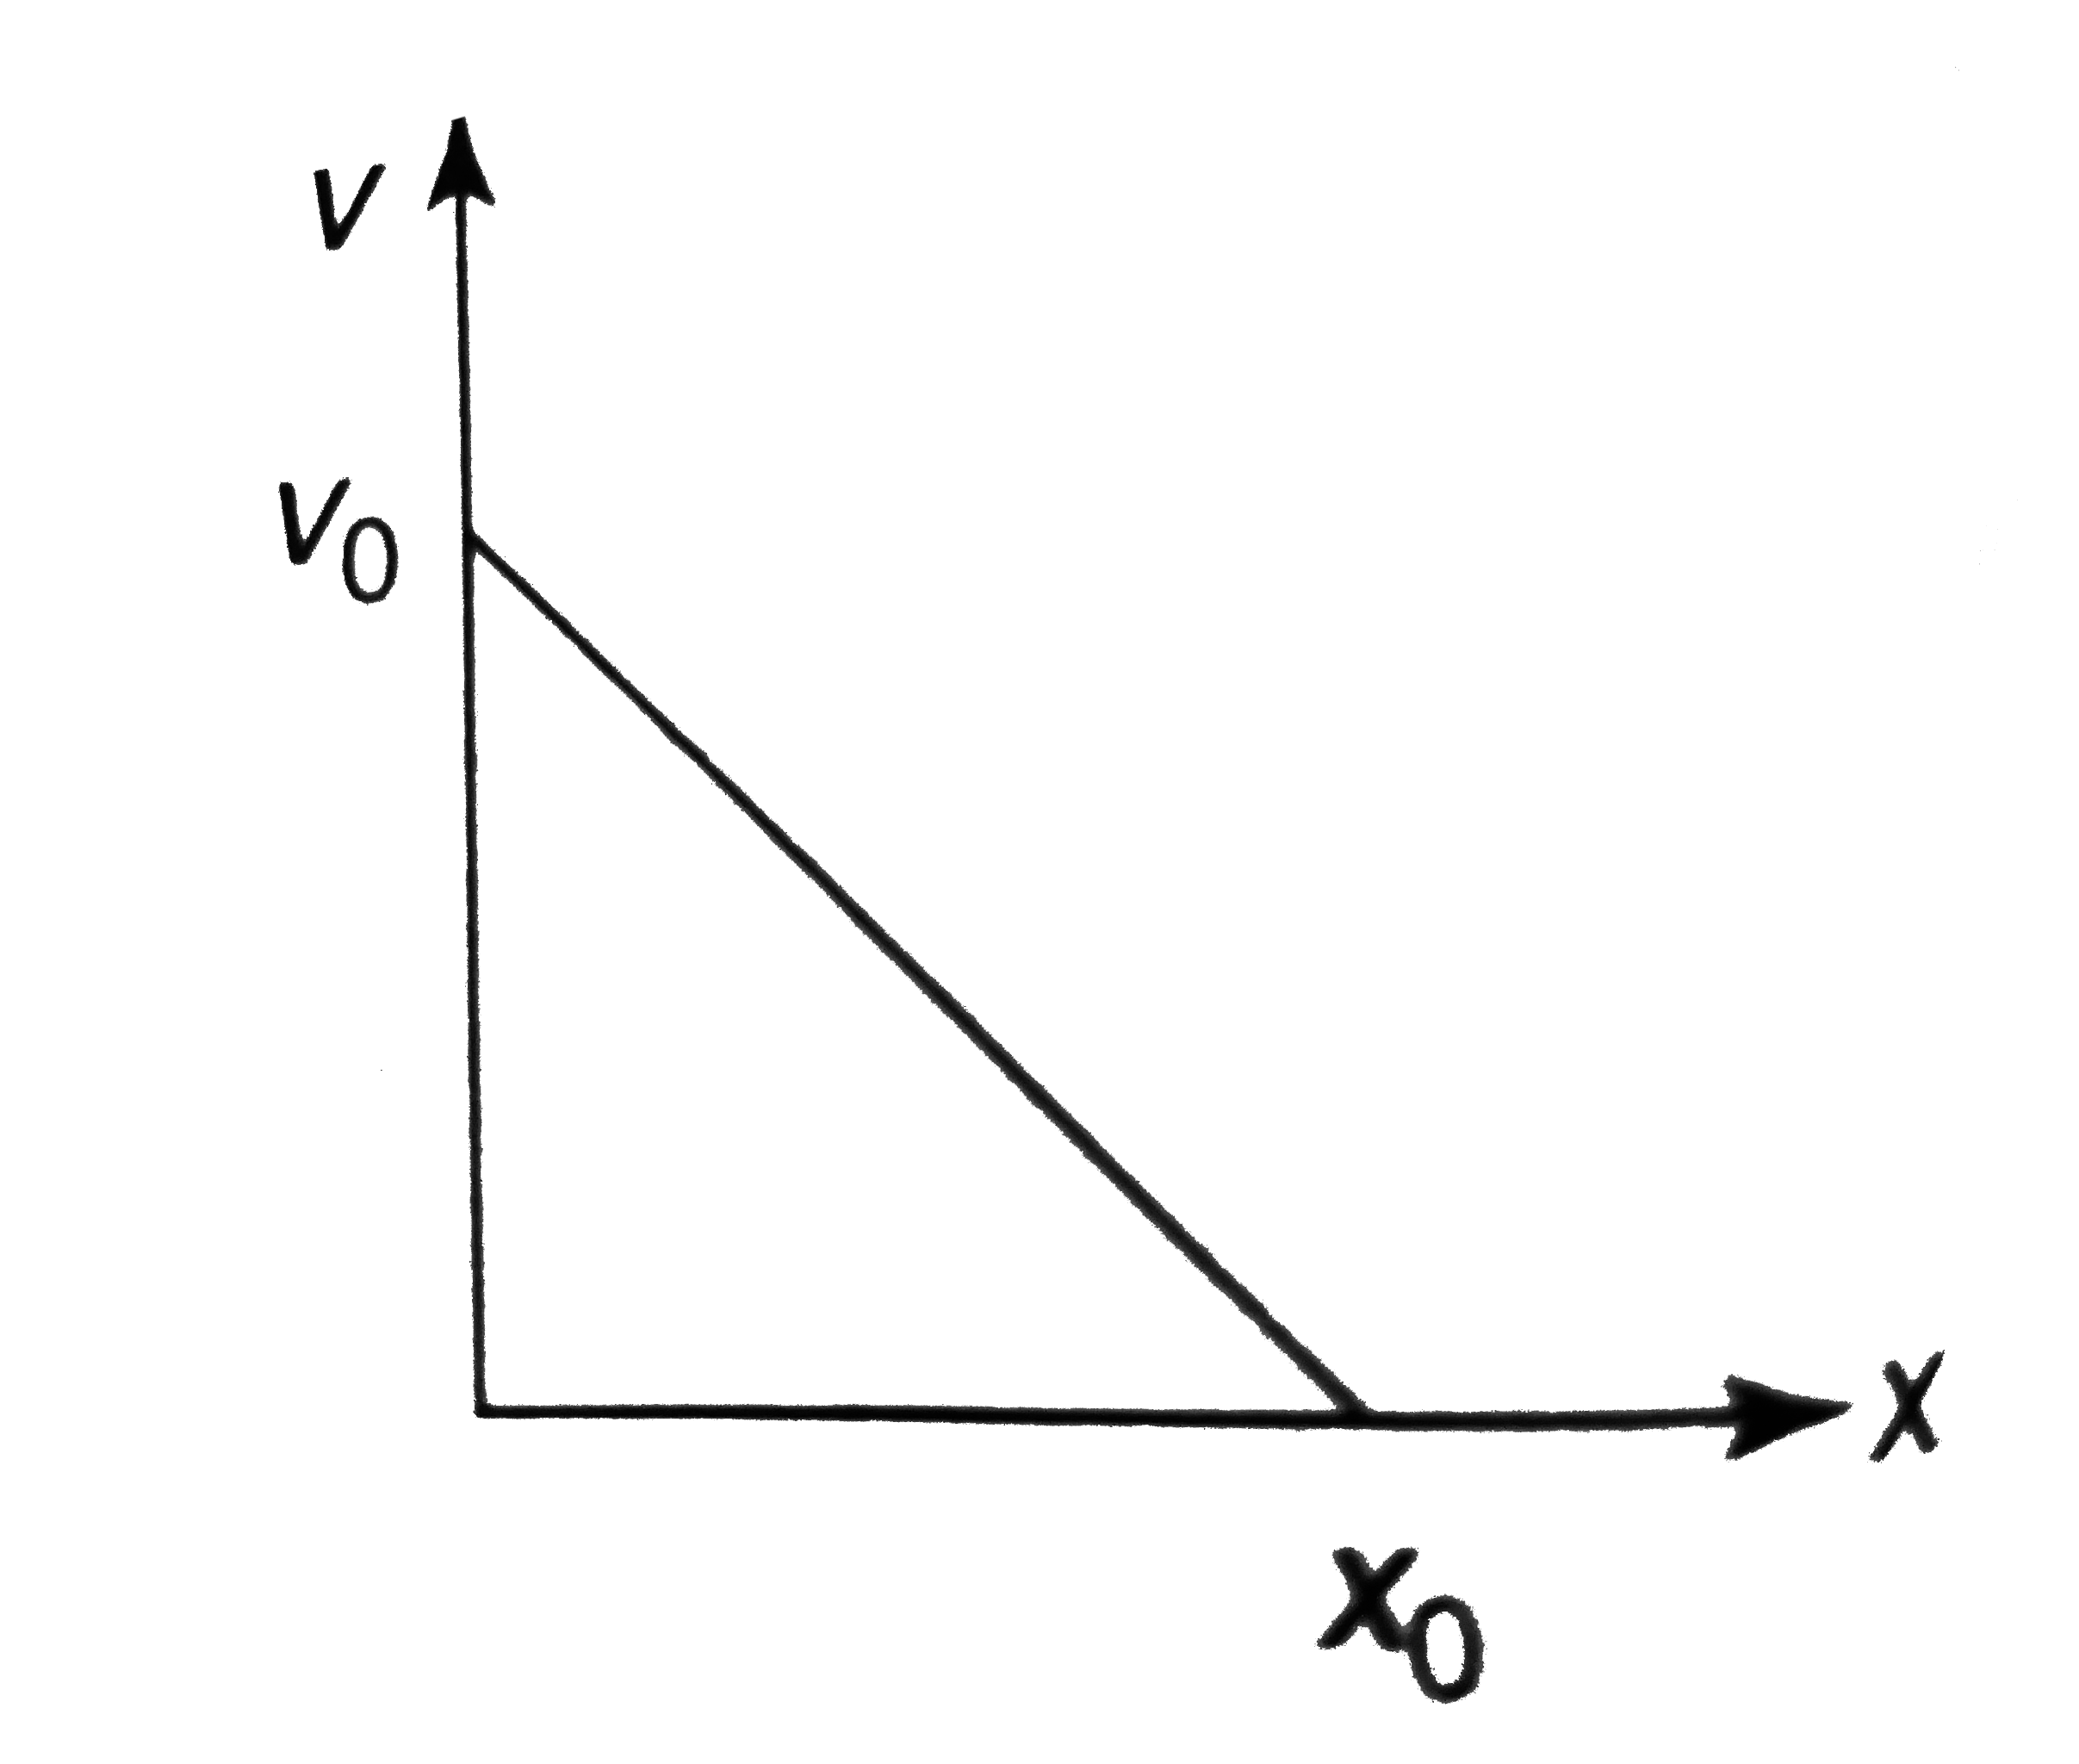
View SolutionA particle is moving in a straight line according to graph given below : (a is acceleration, v is velocity, x is position, t is time) :
View SolutionFor a body moving with uniform acceleration along straight line, the variation of its velocity (v) with position (x) is best represented by
View SolutionThe velocity v of a particle moving along x - axis varies with ist position (x) as v=alpha sqrtx , where alpha is a constant. Which of the following graph represents the variation of its acceleration (a) with time (t)?
View SolutionA particle starts its motion from the origin in positive x-direction. The given graph shows the variation of acceleration (a) with velocity (v). Plot the corresponding graph between velocity and time.
View SolutionThe velocity-position graph of a particle moving in a straight line along x-axis is given below. Acceleration of particle at x = 2 m is
View Solution(a) The figure shows the position time graph of a body moving along a straight line.
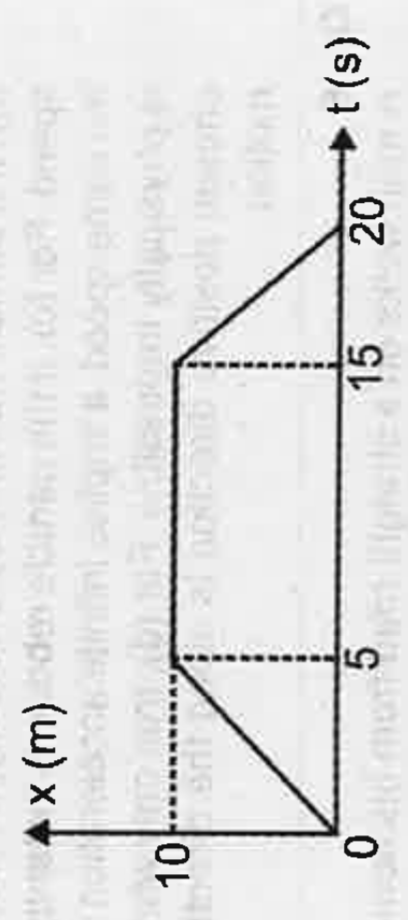
i) Draw the velocity - time graph of the body.
View SolutionThe given graph shows the variation of velocity with displacement. Which one of the graph given below correctly represents the variation of acceleration with displacement :-
View SolutionFor a body moving with uniform acceleration along straight line, the variation of its velocity (v) with position (x) is best represented by
View SolutionThe velocity v of a particle moving along x - axis varies with ist position (x) as v=α√x, where α is a constant. Which of the following graph represents the variation of its acceleration (a) with time (t)?
View SolutionThe velocity-position graph of a particle moving in a straight line along x -axis is given below.Acceleration of particle at x=2m is
View SolutionA particle is moving in a straight line according to graph given below : (a is acceleration, v is velocity, x is position, t is time) :
View Solution
