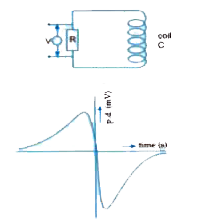
A bar magnet is dropped through a coil C as shown in figure. The graph between the induced voltage and time is also shown. Explain the shape of the graph.

As the magnet is falling towards the coil, magnetic flux increases and emf is induced. This induced emf increases till the magnet reaches the top of the coil. As magnet enters the coil, flux decreases and hence, induced emf decreases. When magnet is completely inside the coil, induced emf is zero.
As magnet starts to move out of the coil, magnetic flux also increases, induced emf starts increasing in reverse direction.
Induced emf is maximum in reverse direction when the magnet just moves out of the cail at its lower end. As the magnet moves out of the coil completely, induced emf decreases to zero.
Negative peak is longer than positive peak because the magnet moves out of the coil faster than it enters in the coil.
Topper's Solved these Questions
- ELECTROMAGNETIC INDUCTIONBOOK - MODERN PUBLICATIONCHAPTER - ELECTROMAGNETIC INDUCTIONEXERCISE - REVISION EXERCISE (Long Answer Questions)
9 Videos
- ELECTROMAGNETIC INDUCTIONBOOK - MODERN PUBLICATIONCHAPTER - ELECTROMAGNETIC INDUCTIONEXERCISE - REVISION EXERCISE (Numerical Problems)
16 Videos
- ELECTROMAGNETIC INDUCTIONBOOK - MODERN PUBLICATIONCHAPTER - ELECTROMAGNETIC INDUCTIONEXERCISE - REVISION EXERCISE (Fill in the blanks)
7 Videos
- ELECTRIC CHARGES AND FIELDS BOOK - MODERN PUBLICATIONCHAPTER - ELECTRIC CHARGES AND FIELDS EXERCISE - Chapter Practice Test
15 Videos
- ELECTROMAGNETIC WAVESBOOK - MODERN PUBLICATIONCHAPTER - ELECTROMAGNETIC WAVESEXERCISE - CHAPTER PRACTICE TEST
14 Videos
Similar Questions
A bar magnet M is dropped so that is falls vertically through the coil C. The graph obtained for voltage produced across the coil Vs time is shown in figure.
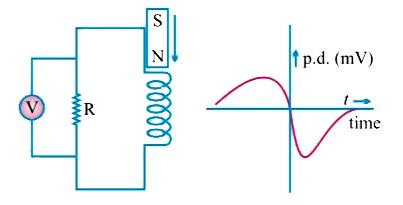
(i) Explain the shape of the graph.
(ii) Why is the negative peak longer than the positive peak ?
View SolutionA bar magnet M is dropped so that if falls vertically through the coil C. The graph obtained for voltage produced acorss the coil vs time is shown in Fig.
(i) Explain the shape of the graph
(ii) Why is the negative peak longer than the positive peak?
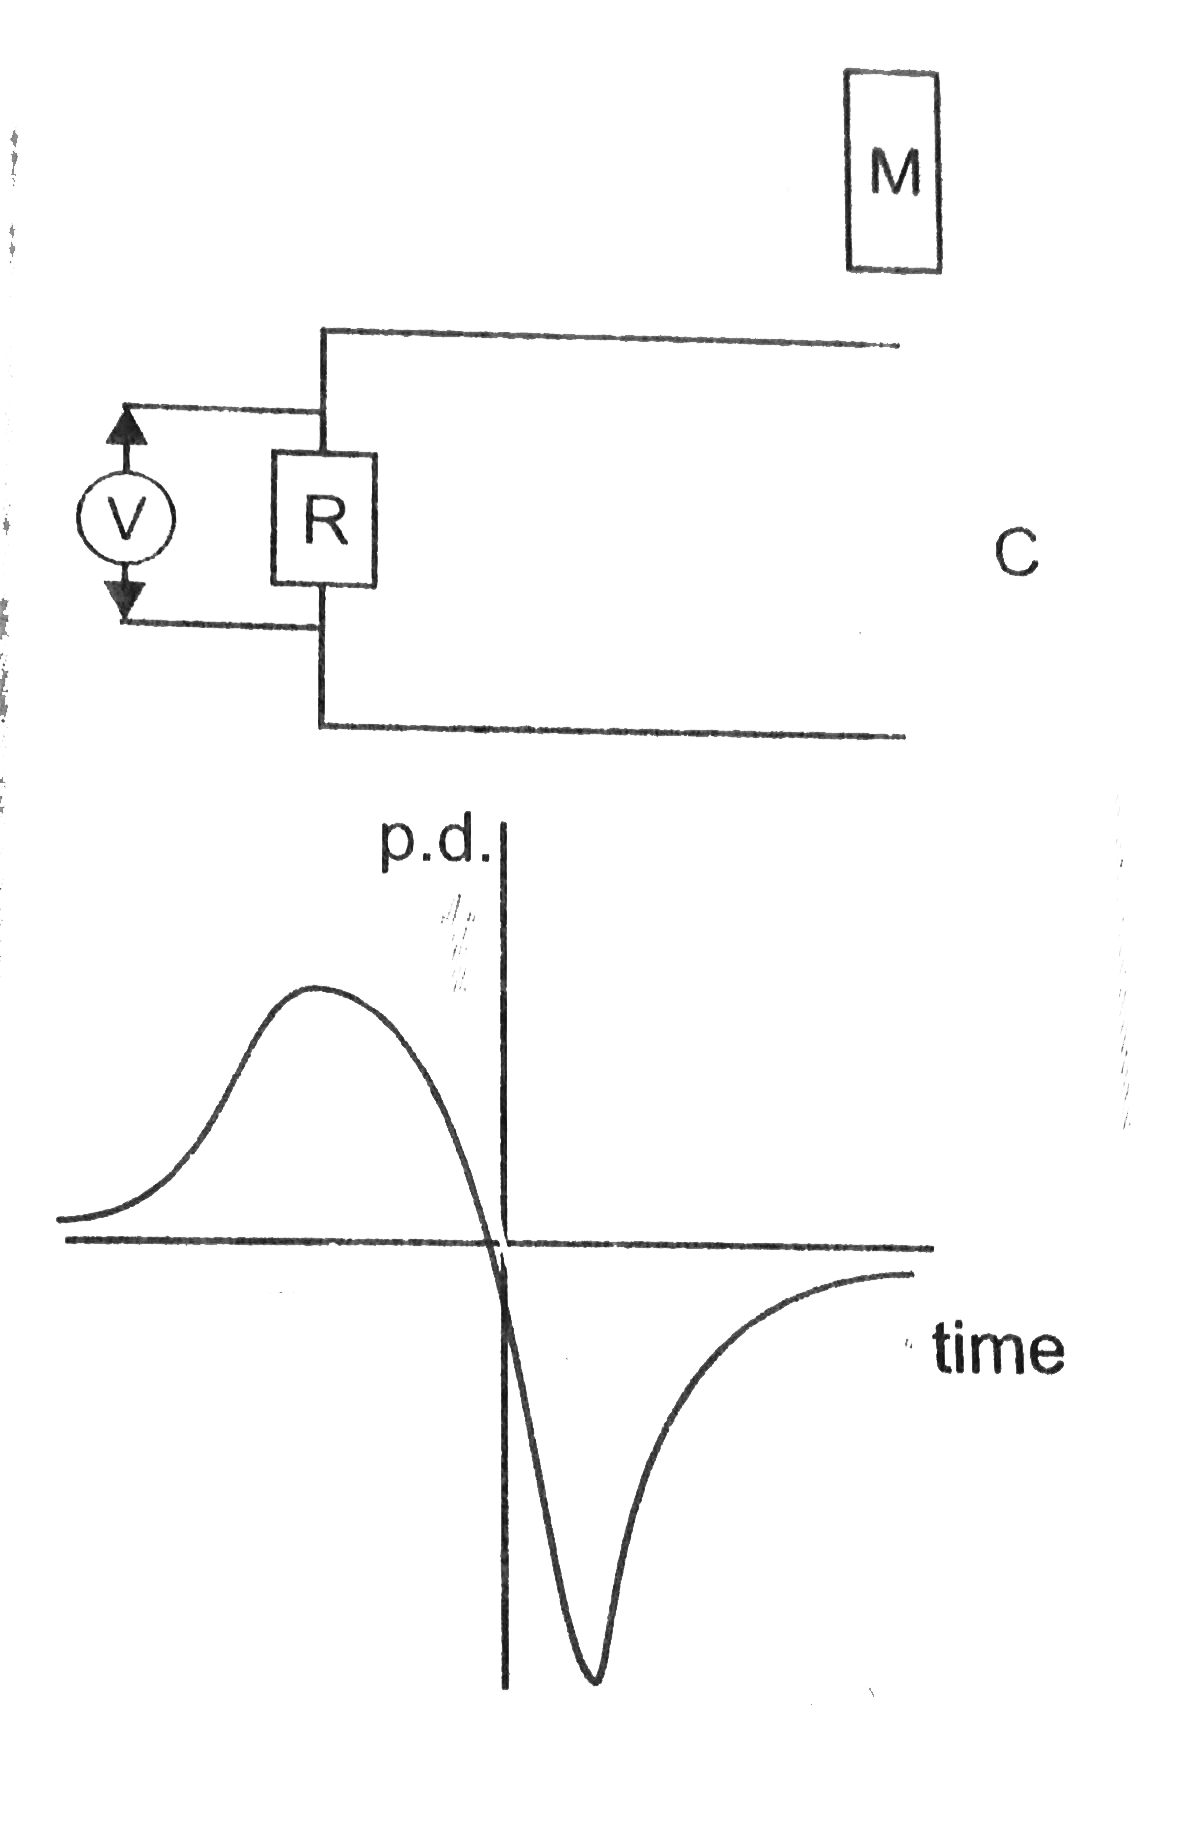
View Solution
Knowledge Check
Current through the coil varies according to graph then induced emf v/s time graph is
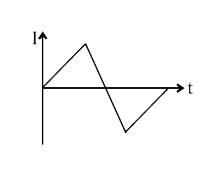 A
A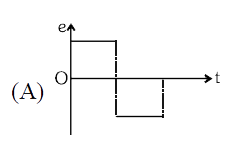 B
B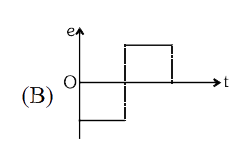 C
C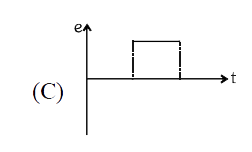 D
D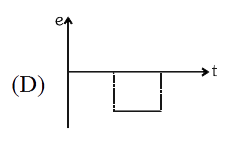
The velocity − time graph of a particle is as shown in figure
 AIt moves with a constant acceleration throughoutBIt moves with an acceleration of constant magnitude but changing direction at the end of every two secondCThe displacement of the particle is zeroDThe velocity becomes zero at t=4 second
The current through the coil in figure (i) varies as shown in figure (ii). Which graph best shows the ammeter A reading as a function of time?
 A
A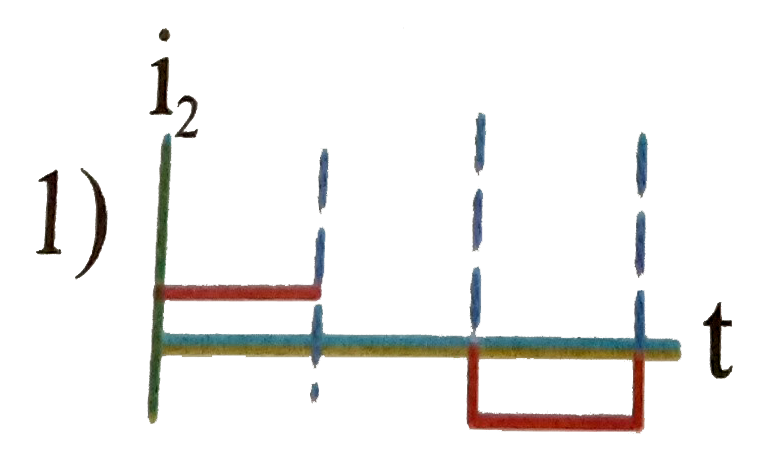 B
B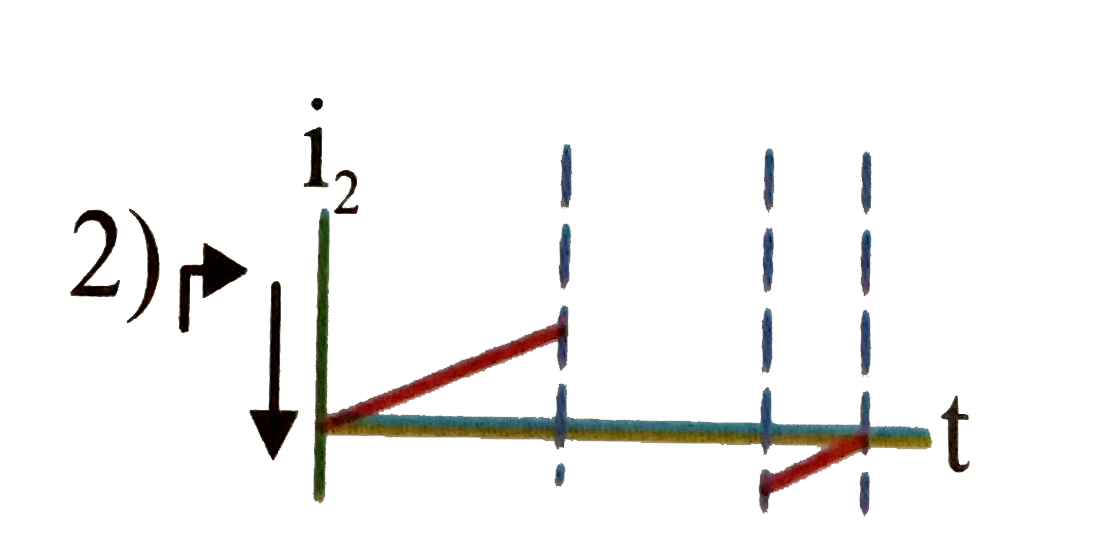 C
C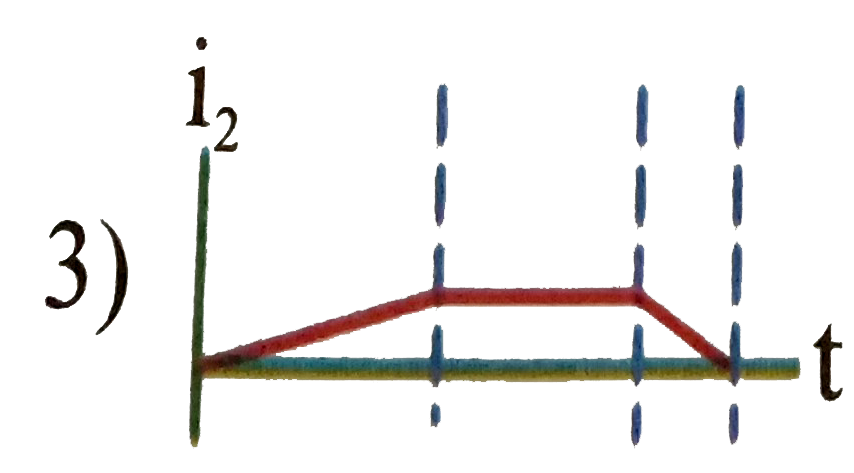 D
D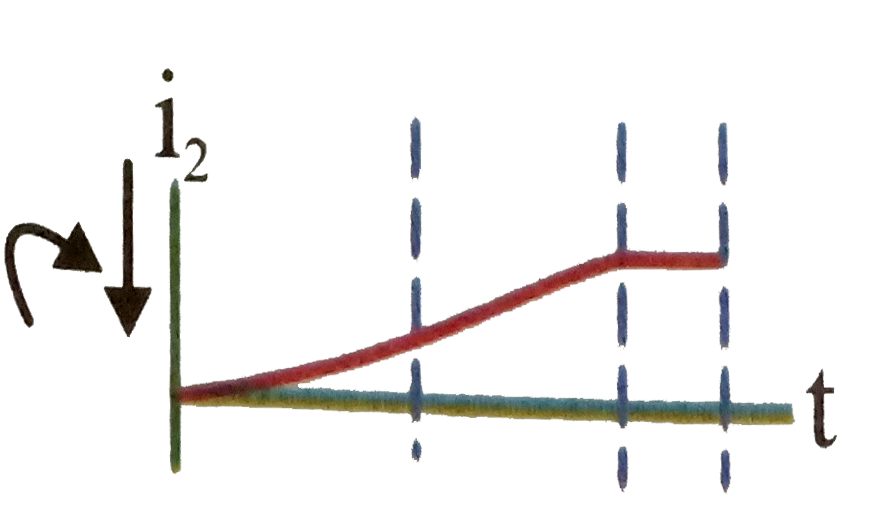
A bar magnet M is dropped so that it falls vertically through the coil C [Fig. 6.29). The graph obtained for voltage produced across the coil vs time is shown in Fig. 6.30.
(a) Explain the shape of the graph.
(b) Why is the negative peak longer than the positive peak?
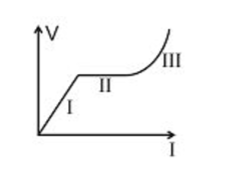
View SolutionVoltage V v/s I graph is shown in the figure.
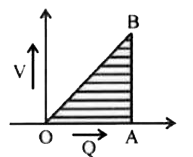
View SolutionThe graph between the voltage and charrge of a capacitor is as shown in the figure. The area of the triangle OAB given the
View SolutionGraph of a body is shown. It explains that

View SolutionThe velocity − time graph of a particle is as shown in figure

View Solution
