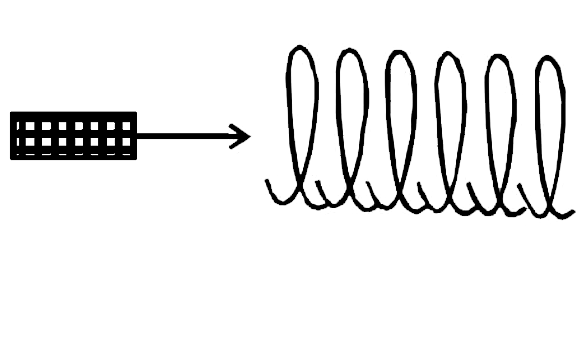
One small magnet is slowly inserted inside a solenoid with constant velocity as shown in figure.
which one of the following graphs will best represent emf induced as function of time ?

A

B

C

D

Text Solution
The correct Answer is:D
(d) : Only graph represented in option (d) accounts foir reversal of direction while entering and exiting the solenoid . Hence option (d) will be best possible option for this situation .
|
Topper's Solved these Questions
- ALTERNATING CURRENT BOOK - MODERN PUBLICATIONCHAPTER - ALTERNATING CURRENT EXERCISE - COMPETITION FILE (OBJECTIVE TYPE QUESTIONS) B. MULTIPLE CHOICE QUESTIONS
15 Videos
- ALTERNATING CURRENT BOOK - MODERN PUBLICATIONCHAPTER - ALTERNATING CURRENT EXERCISE - COMPETITION FILE JEE (MAIN) & OTHER STATE BOARDS FOR
26 Videos
- ALTERNATING CURRENT BOOK - MODERN PUBLICATIONCHAPTER - ALTERNATING CURRENT EXERCISE - Revision Exercises (Nuumerical problems )
18 Videos
- ATOMS BOOK - MODERN PUBLICATIONCHAPTER - ATOMS EXERCISE - Chapter Practice Test
16 Videos
Similar Questions
Knowledge Check
A small bar magnet is being slowly inserted with constant velocity inside a solenoid as shown in figure. Which graph best represents the relationship between emf induced with time
 A
A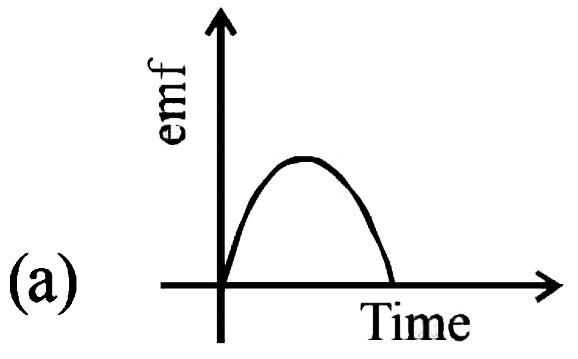 B
B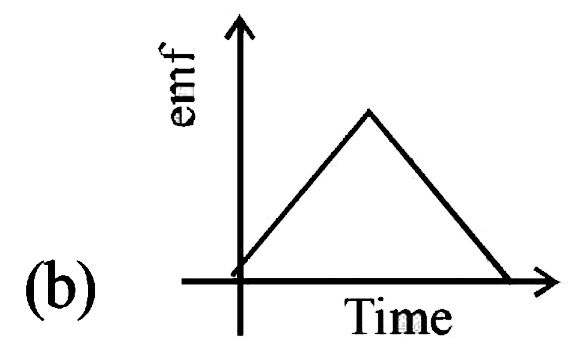 C
C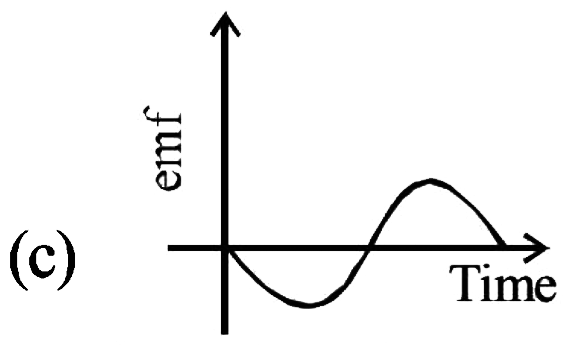 D
D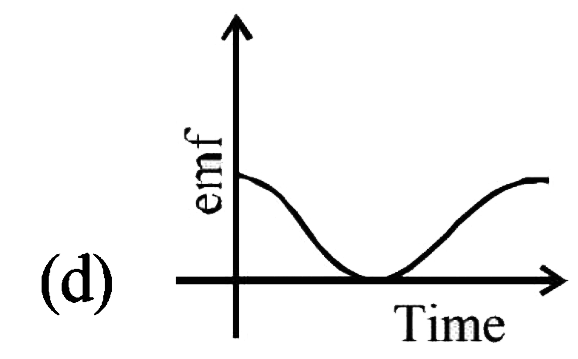
A body is thrown vertically upwards. Which one of the following graphs correctly represent the velocity vs time?
A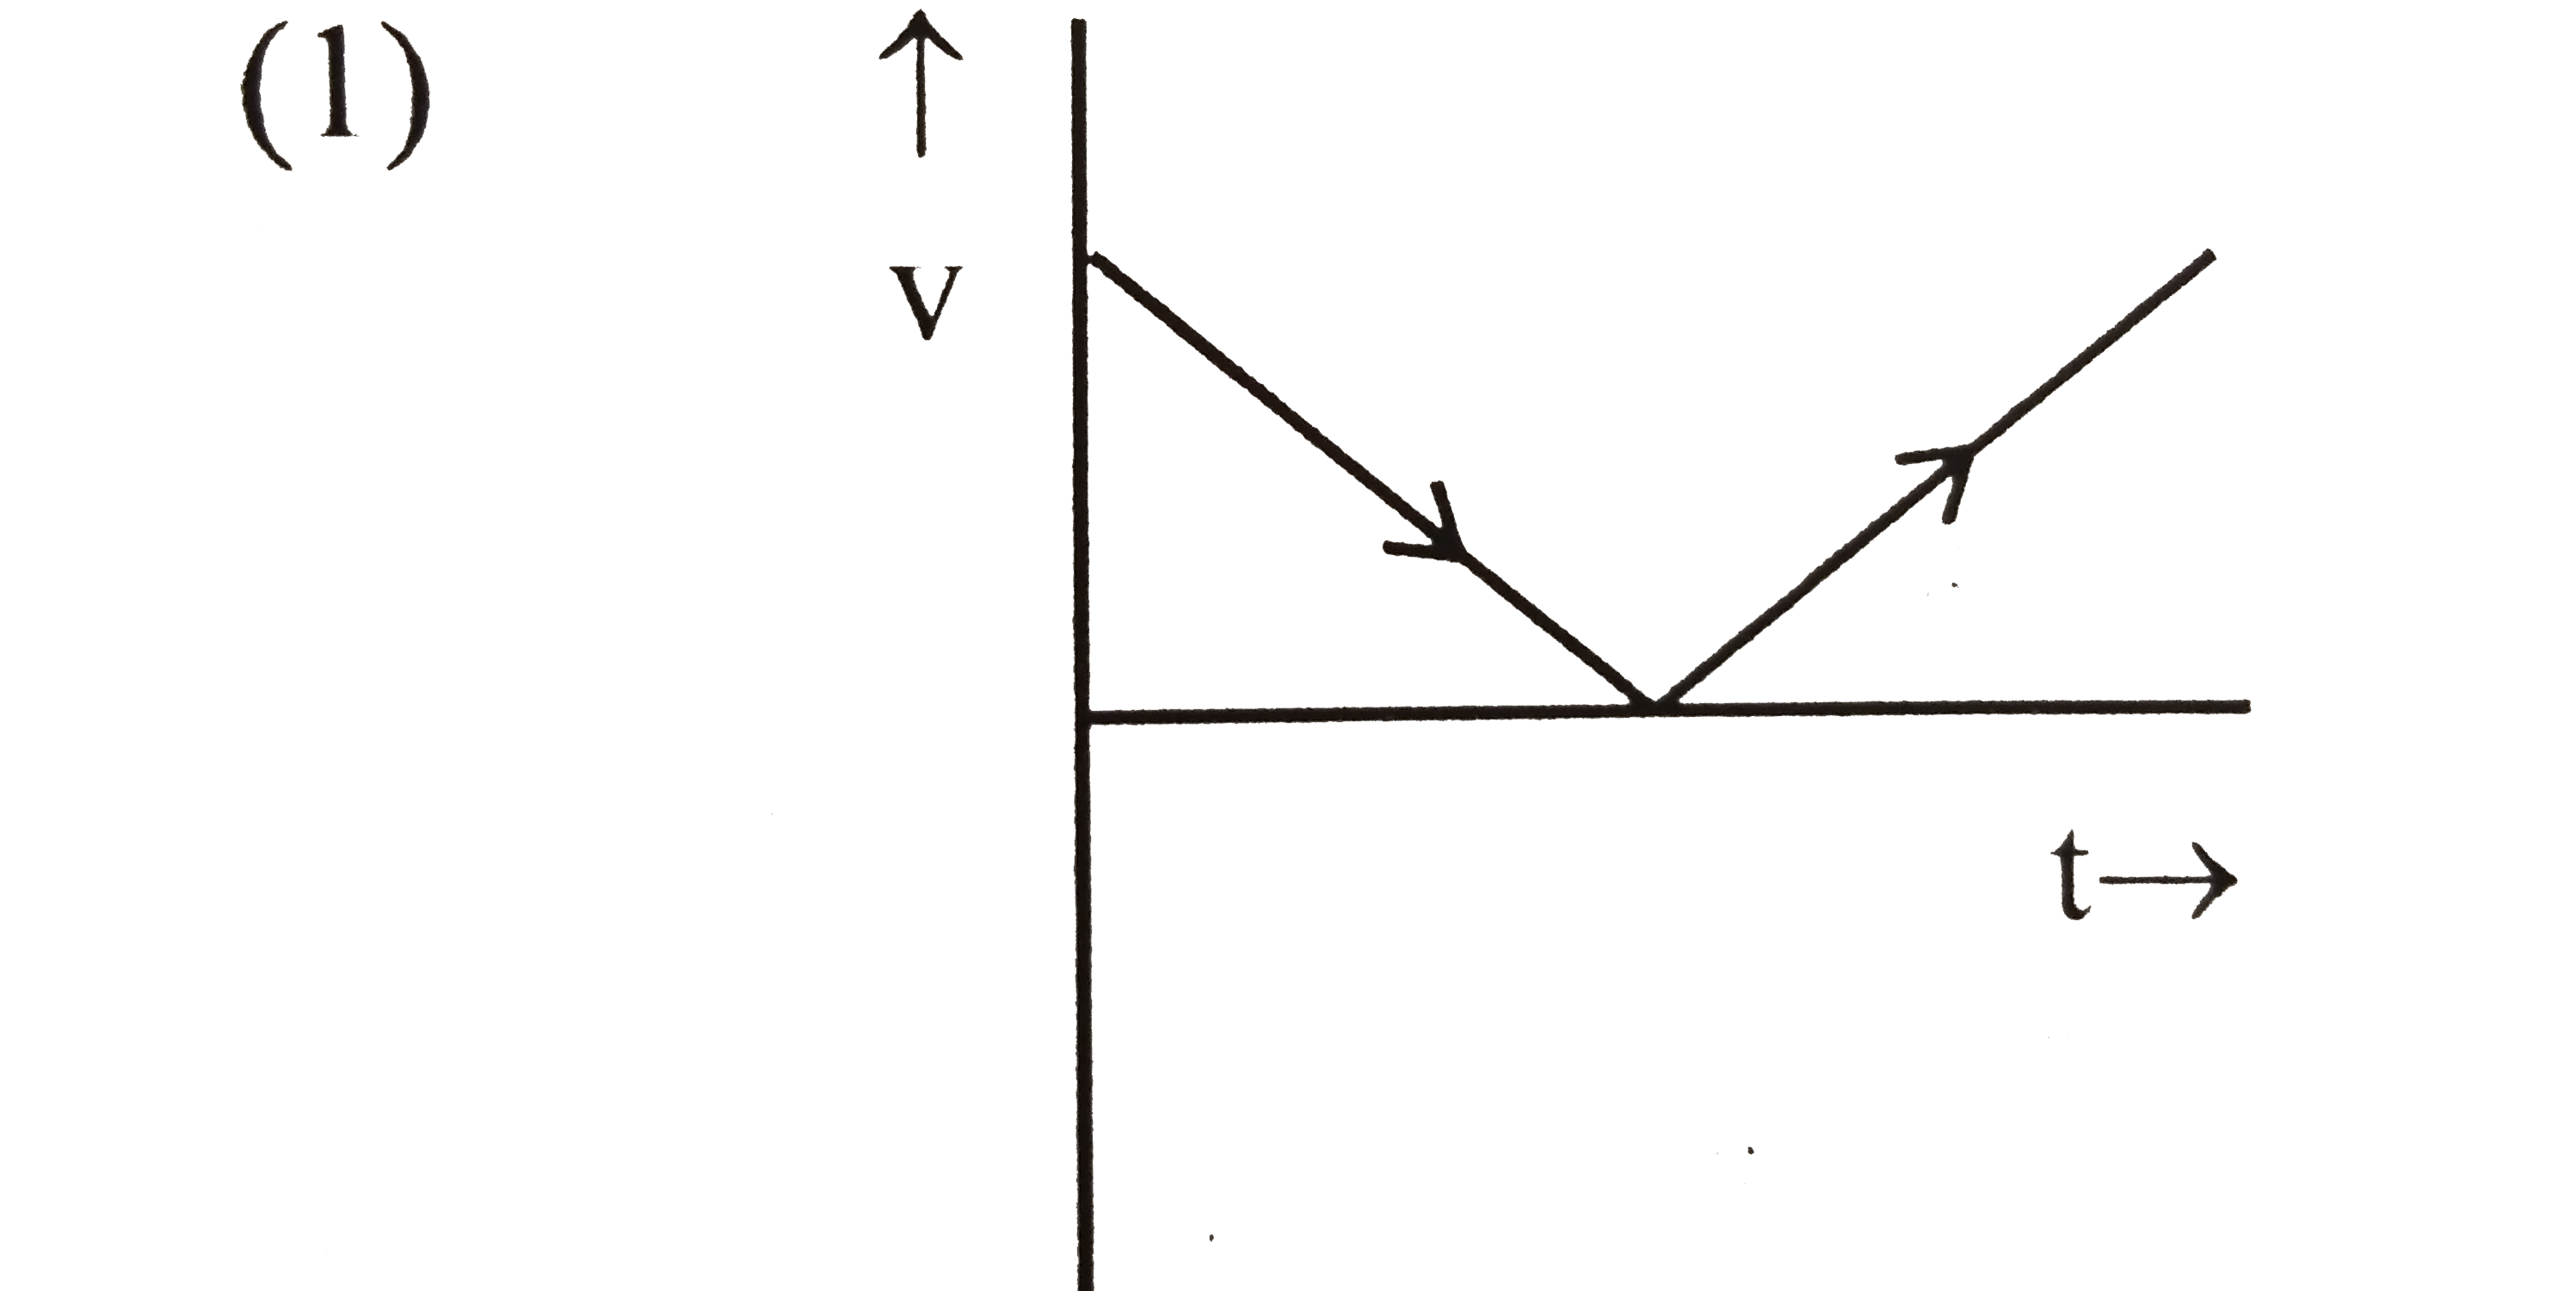 B
B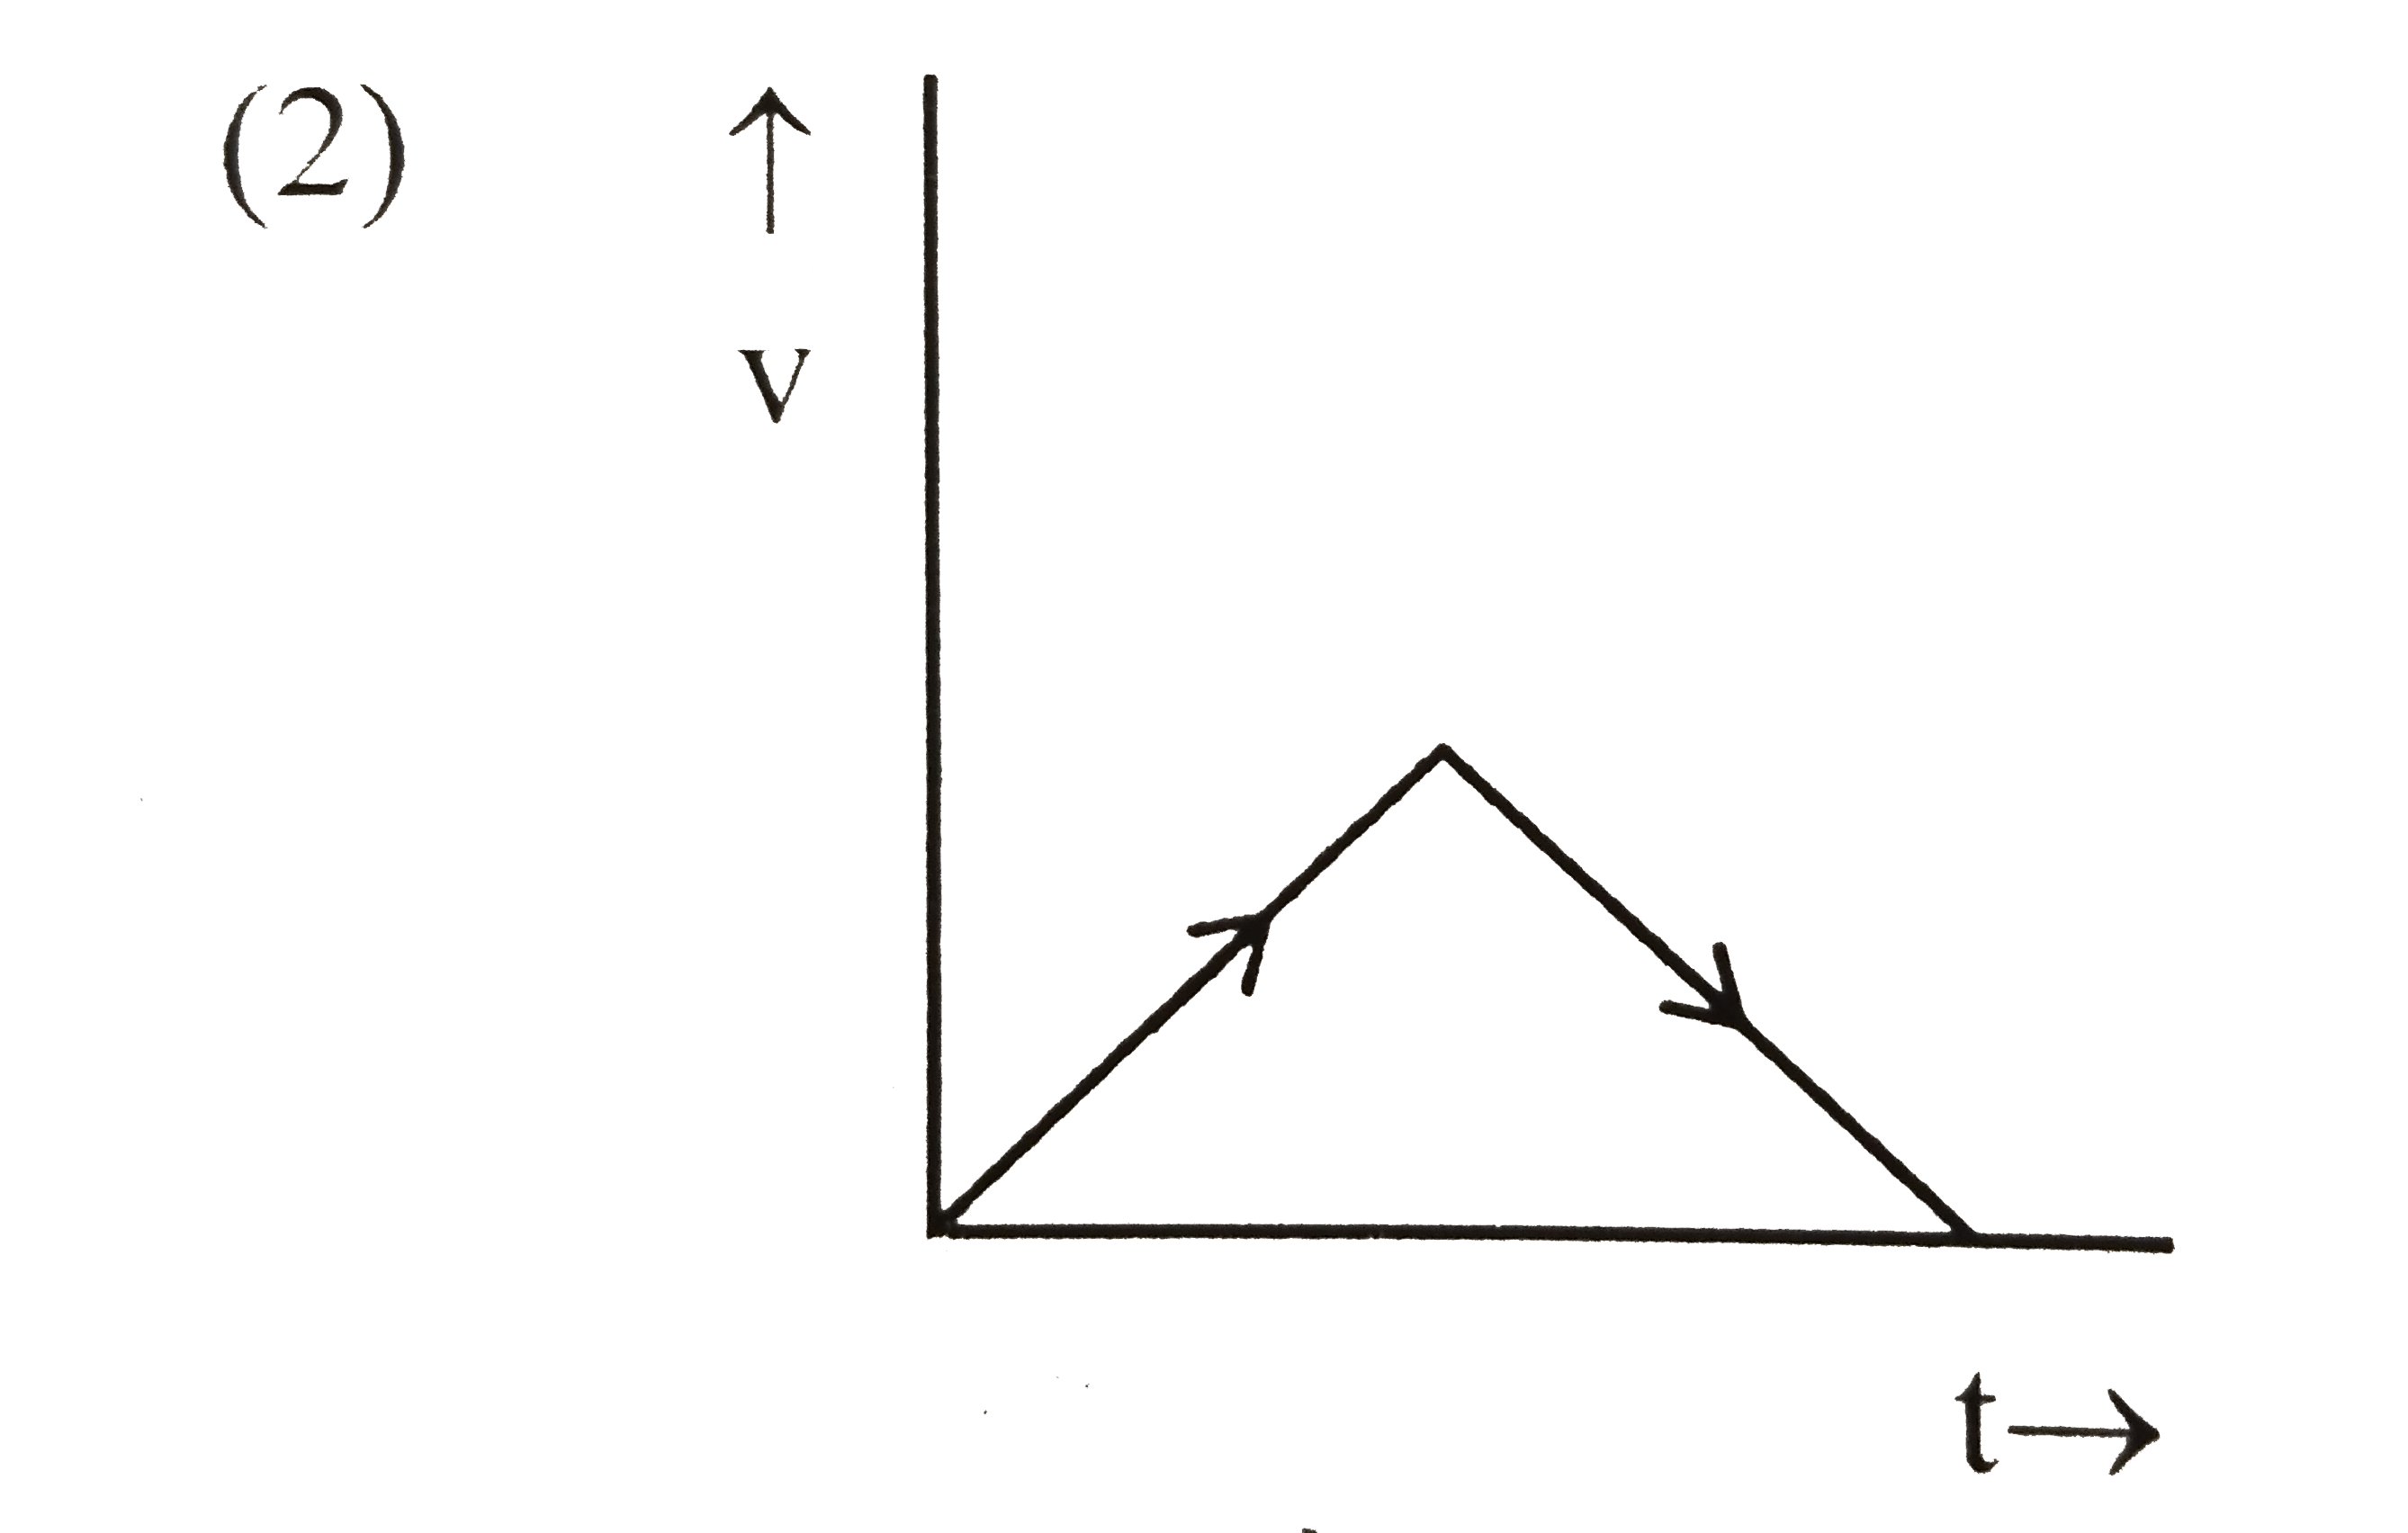 C
C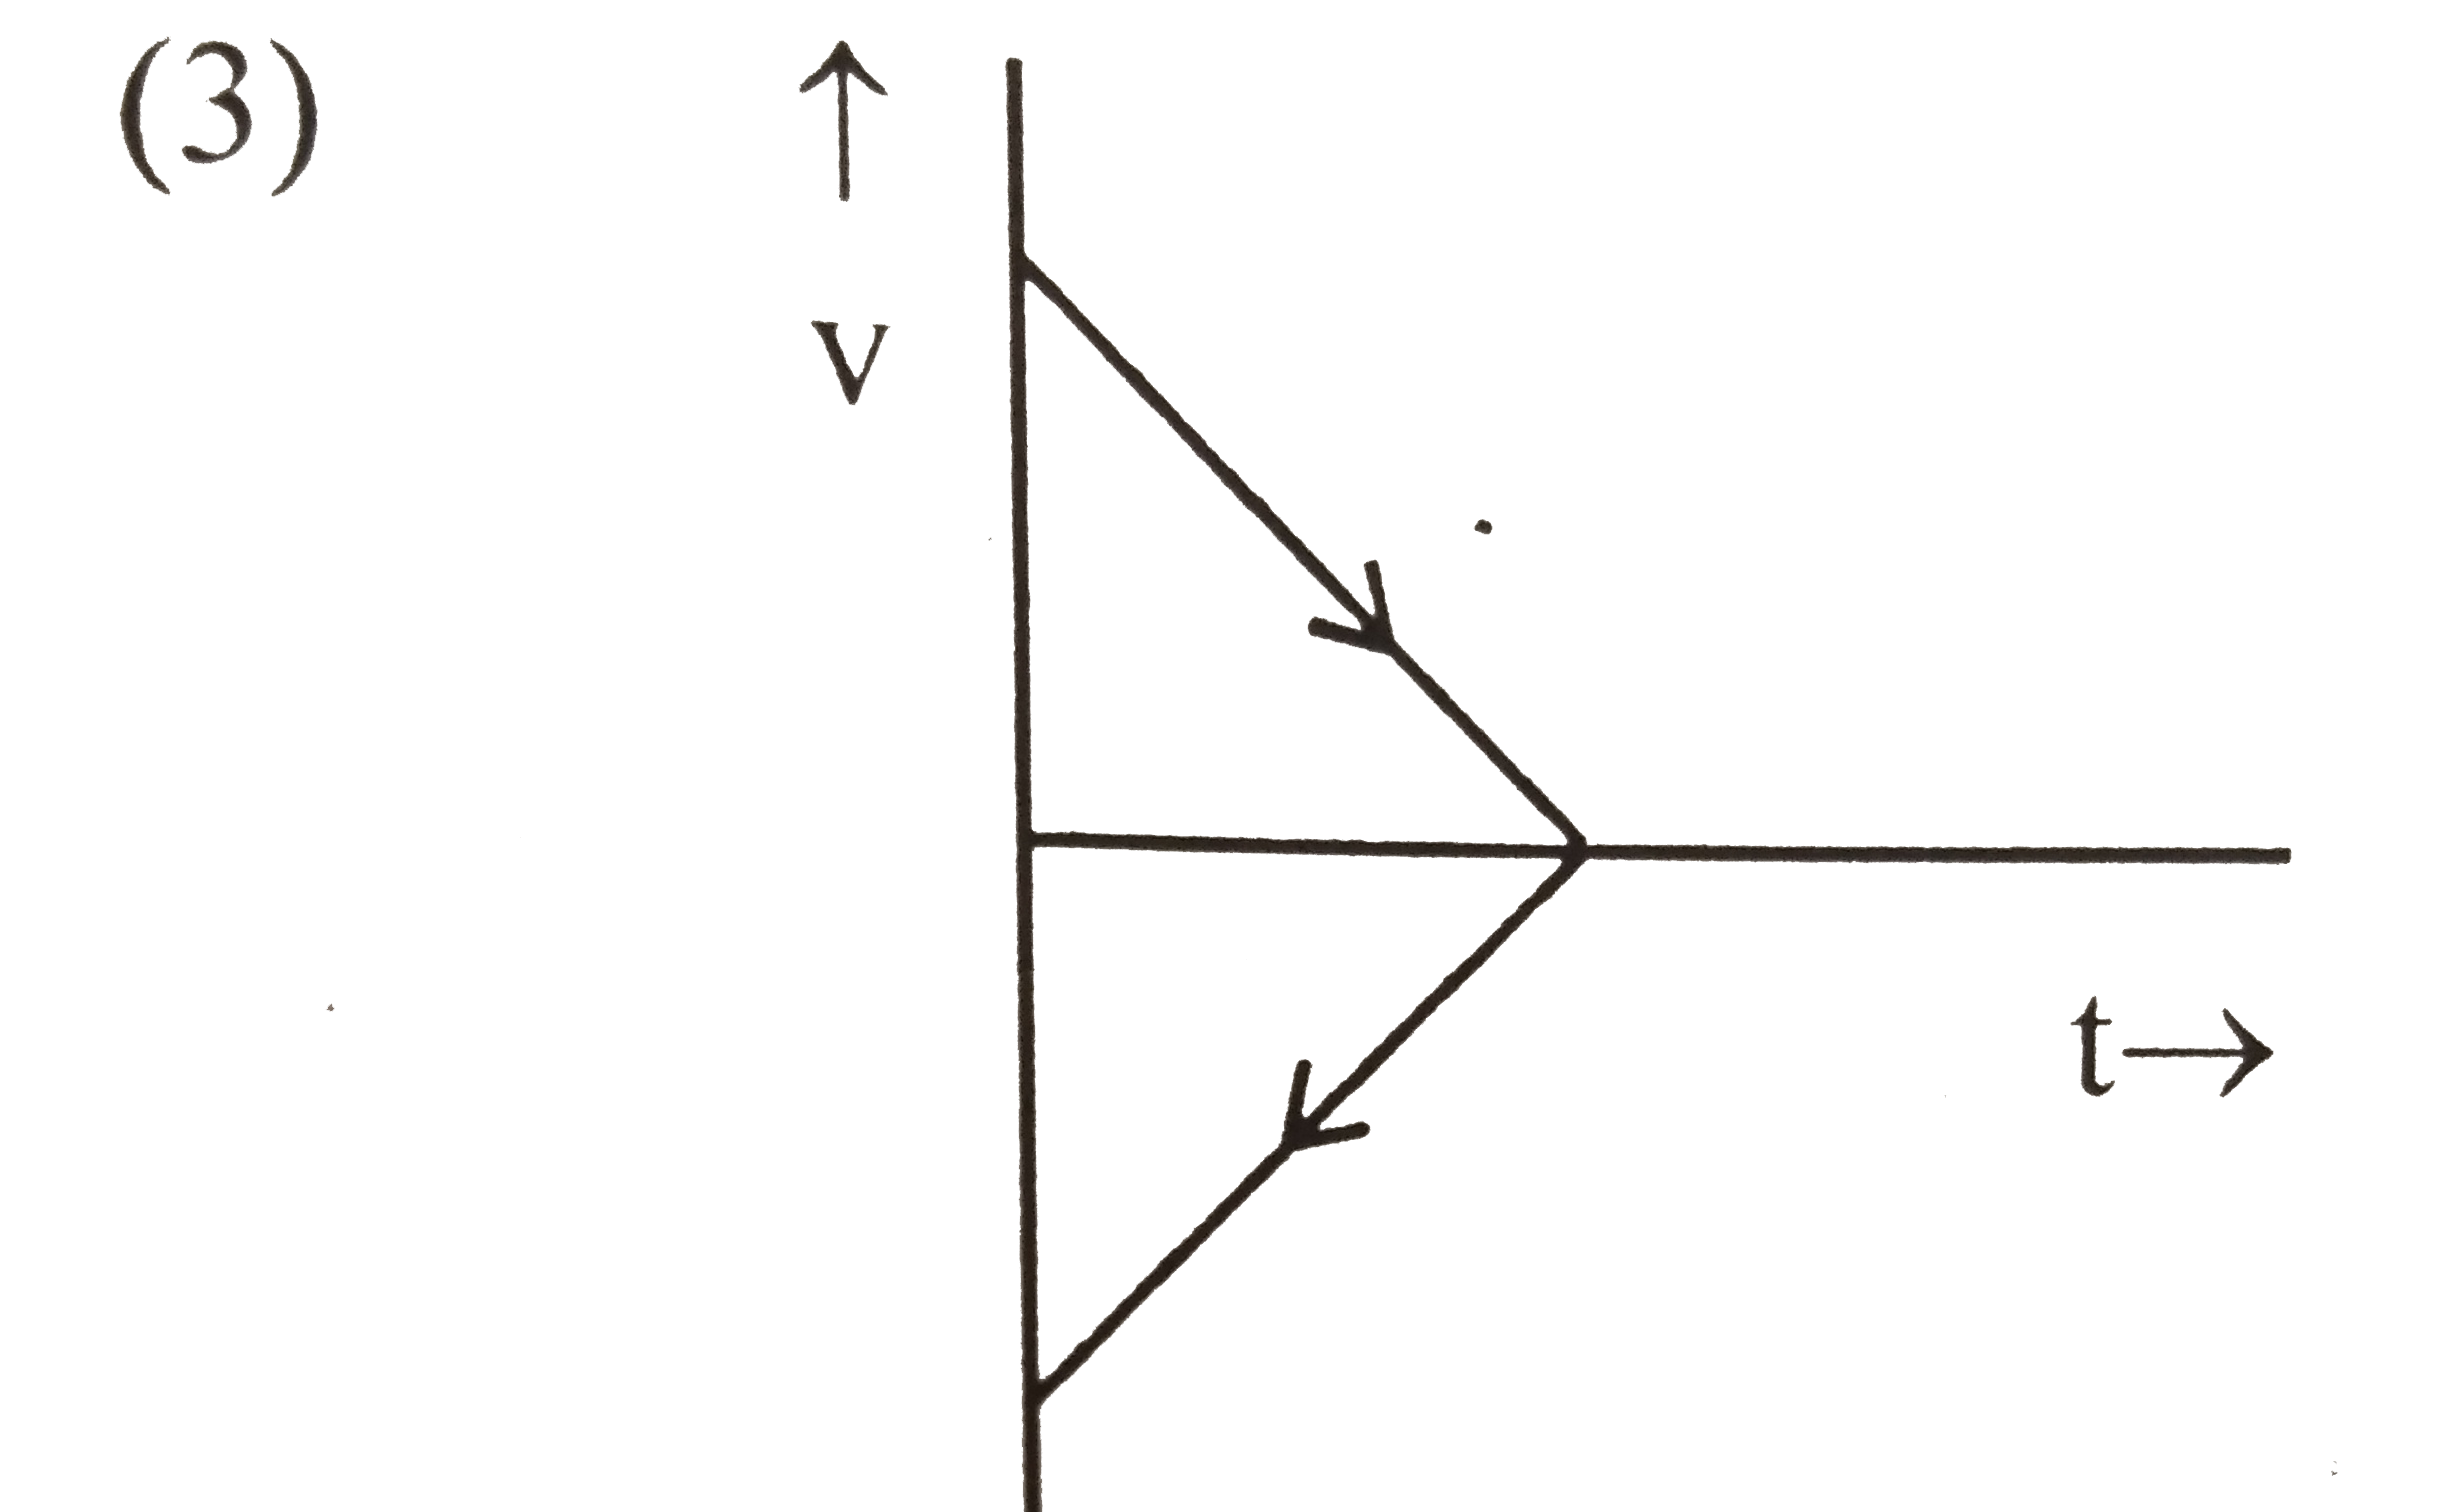 D
D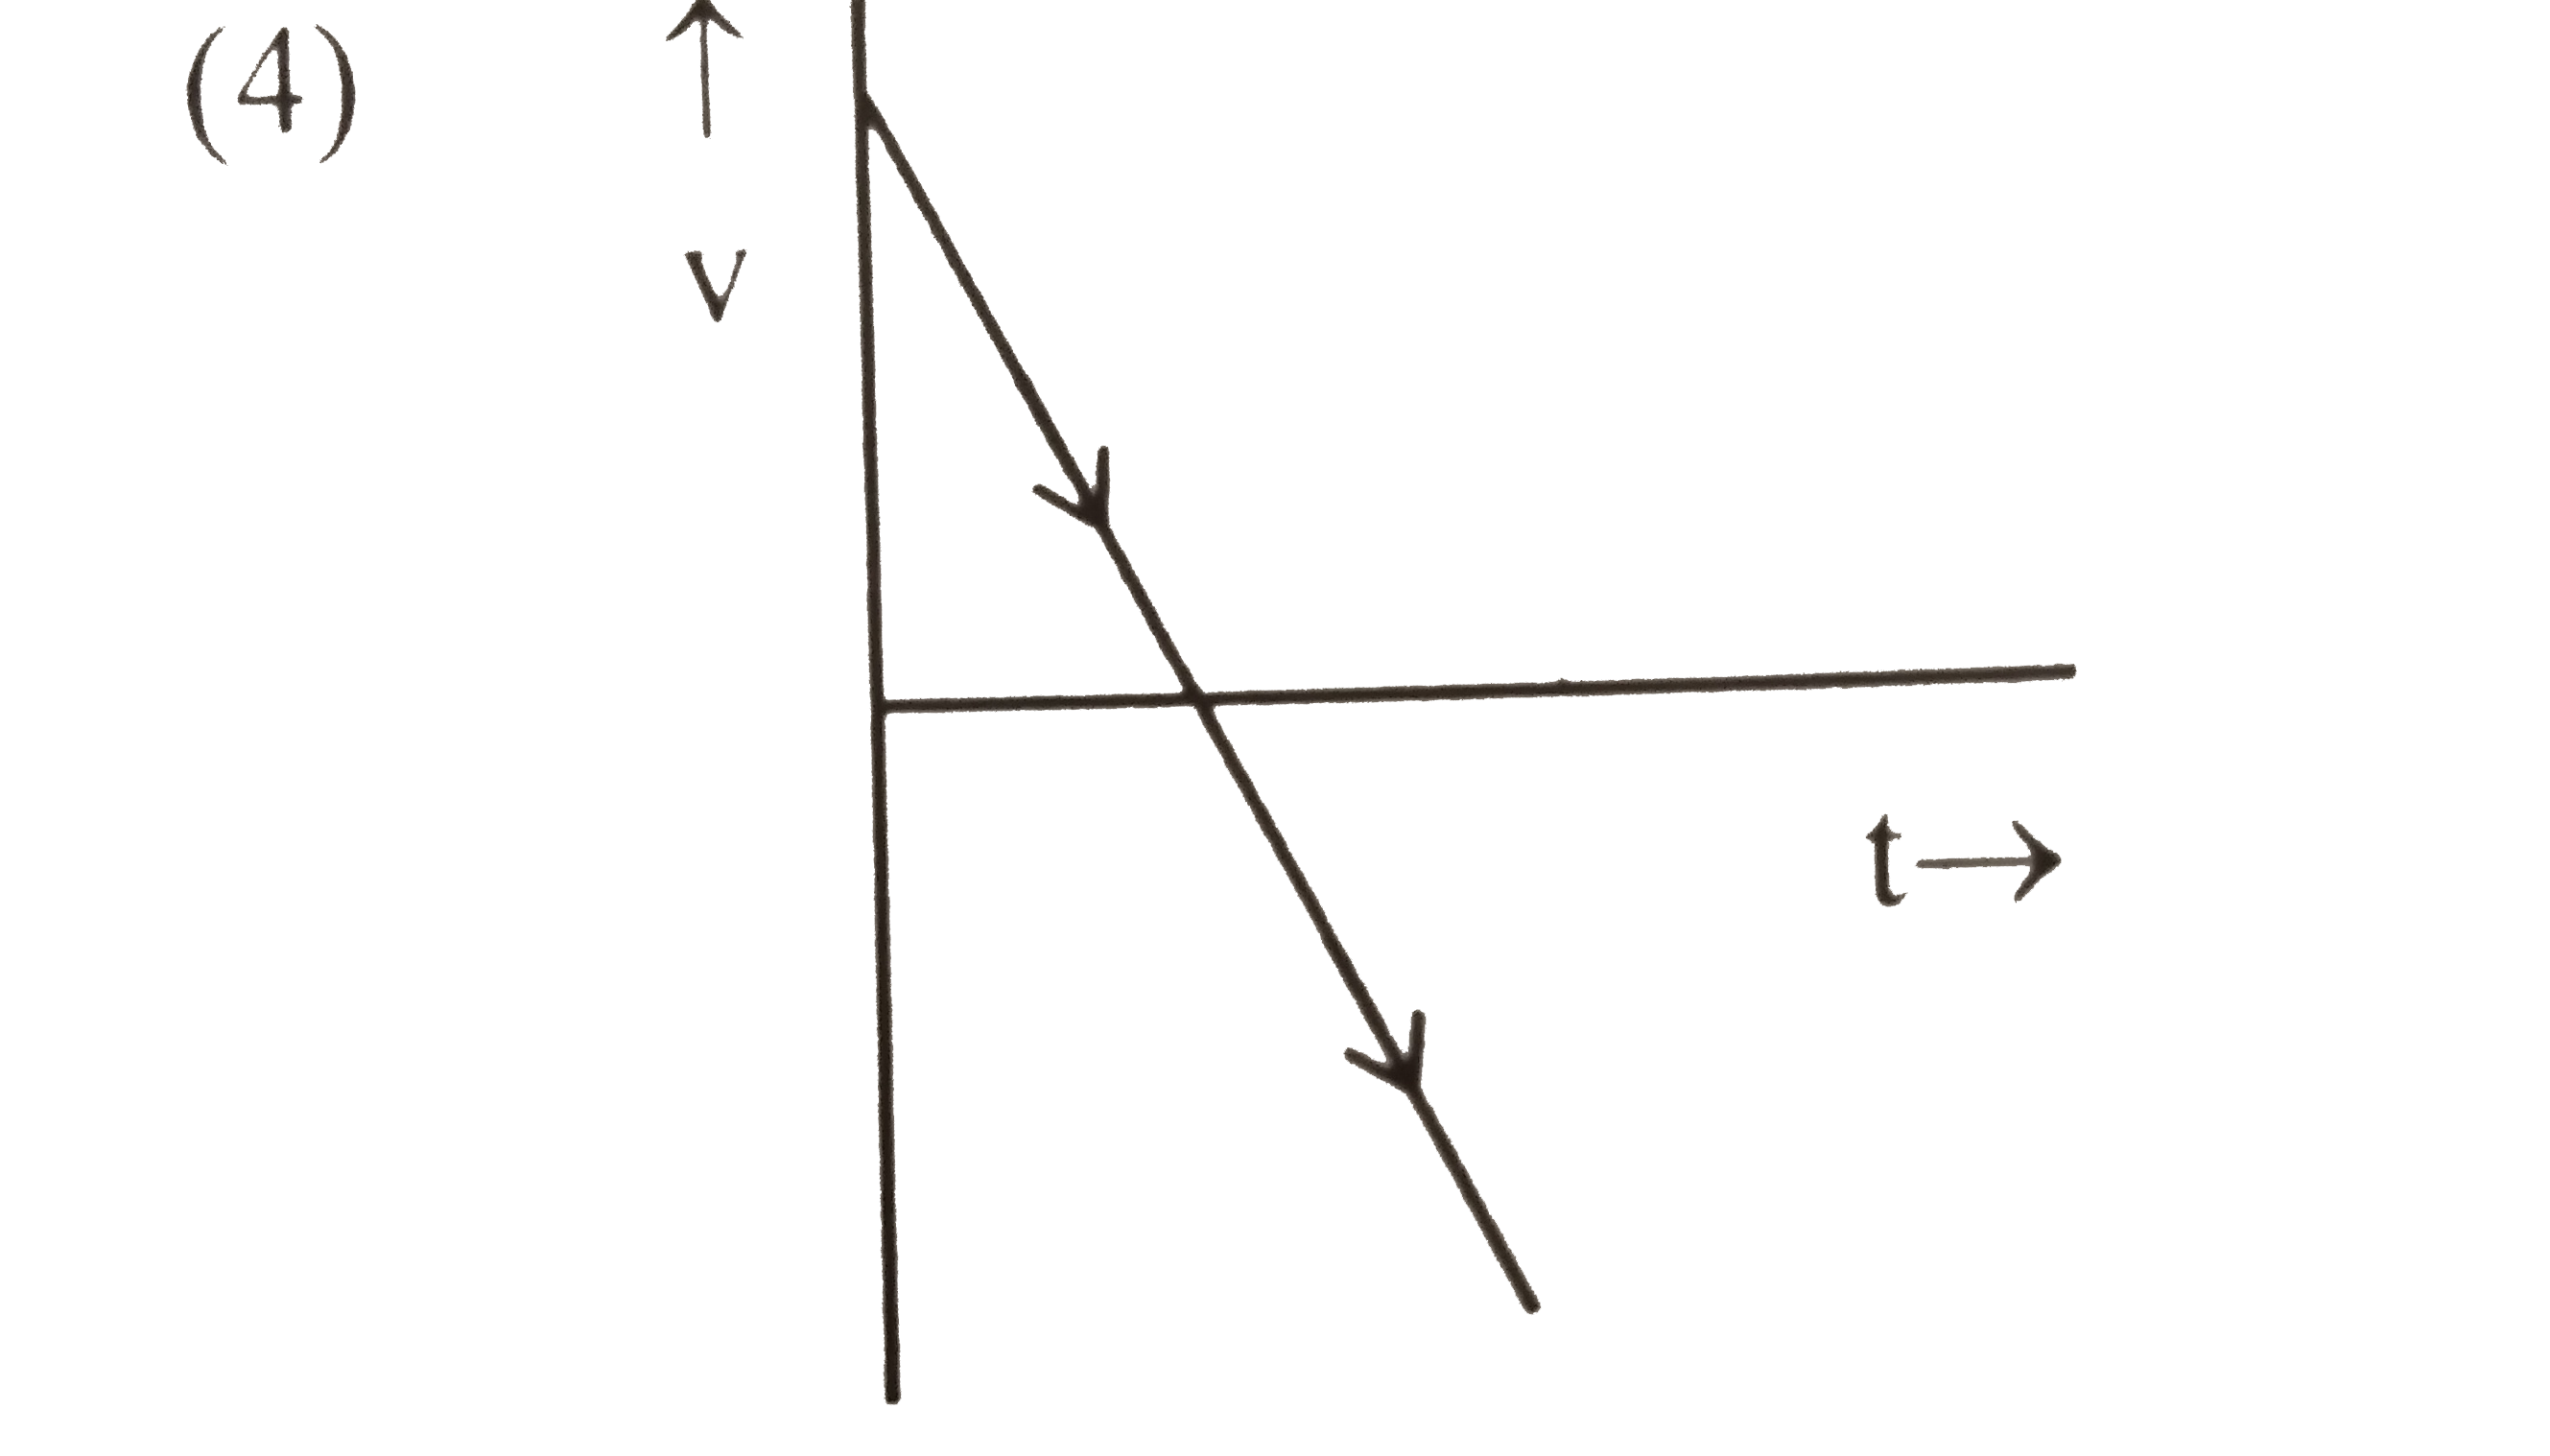
Which one of the following graphs represent a one-one function? (FIGURE)
View SolutionWhich one of the following best represent the graph of function f(x)=e{|x|}
View SolutionWhich one of the following function best represents the graphs as shown below?
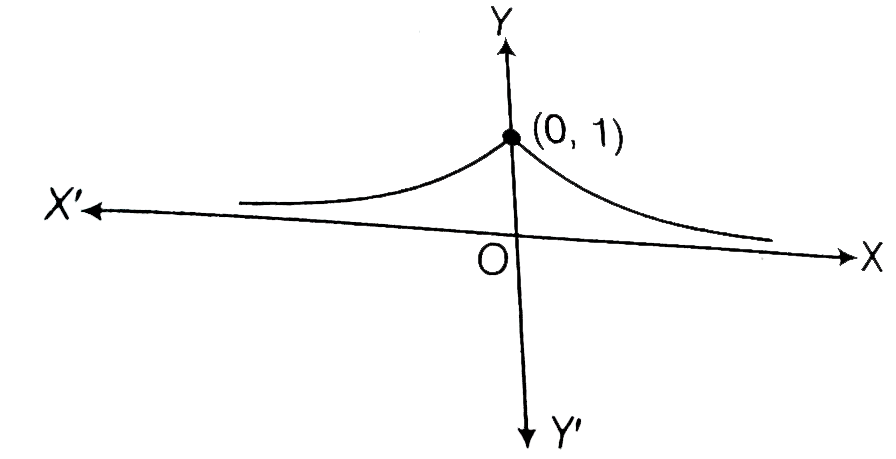
View SolutionA small bar magnet is being slowly inserted with constant velocity inside a solenoid as shown in figure. Which graph best represents the relationship between emf induced with time

View SolutionWhich one of the following function best represent the graphs as shown below?

View SolutionA body is thrown vertically upwards. Which one of the following graphs correctly represent the velocity vs time?
View Solution

