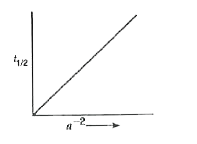
The following plot of vs. concentration corresponds to :
 Solution in Kannada
second order
Third order
First order
zero order
The correct Answer is:B
Step by step video, text & image solution for The following plot of t_(1//2) vs. concentration corresponds to : by Chemistry experts to help you in doubts & scoring excellent marks in Class 12 exams.
Updated on:21/07/2023Topper's Solved these Questions
- CHEMICAL KINETICS BOOK - MODERN PUBLICATIONCHAPTER - CHEMICAL KINETICS EXERCISE - Multiple Choice Questions (Level-III)
9 Videos
- CHEMICAL KINETICS BOOK - MODERN PUBLICATIONCHAPTER - CHEMICAL KINETICS EXERCISE - Recent Examination Questions
20 Videos
- CHEMICAL KINETICS BOOK - MODERN PUBLICATIONCHAPTER - CHEMICAL KINETICS EXERCISE - Multiple Choice Questions ( Effect of Temperature Catalyst and Radiation on Rate of Reaction )
13 Videos
- CHEMICAL BONDING AND MOLECULAR STRUCTURE BOOK - MODERN PUBLICATIONCHAPTER - CHEMICAL BONDING AND MOLECULAR STRUCTURE EXERCISE - Recent Examination Questions
17 Videos
- CHEMISTRY IN EVERY DAY LIFE BOOK - MODERN PUBLICATIONCHAPTER - CHEMISTRY IN EVERY DAY LIFE EXERCISE - Recent Examination Questions
4 Videos
Similar Questions
The half life period of a first order chemical reaction is 6.93 minutes . The time required for the completion of 99% of the chemical reaction will be ( log 2 = 0.301 ) :
View Solution2 g of a radioactive sample having half life of 15 days was synthesised on 1st Jan 2009. The amount of the smaple left behind on 1st March, 2009 (including btoh the days)
View SolutionIf k1 and k2 are rate constants at temperatures T1 and T2 respectively then according to Arrhenius equation :
View SolutionAmong the following, the compound that contains ionic, covalent and coordinate linkage is :
View SolutionOils are liquids at room temperature since they contain higher percentage of
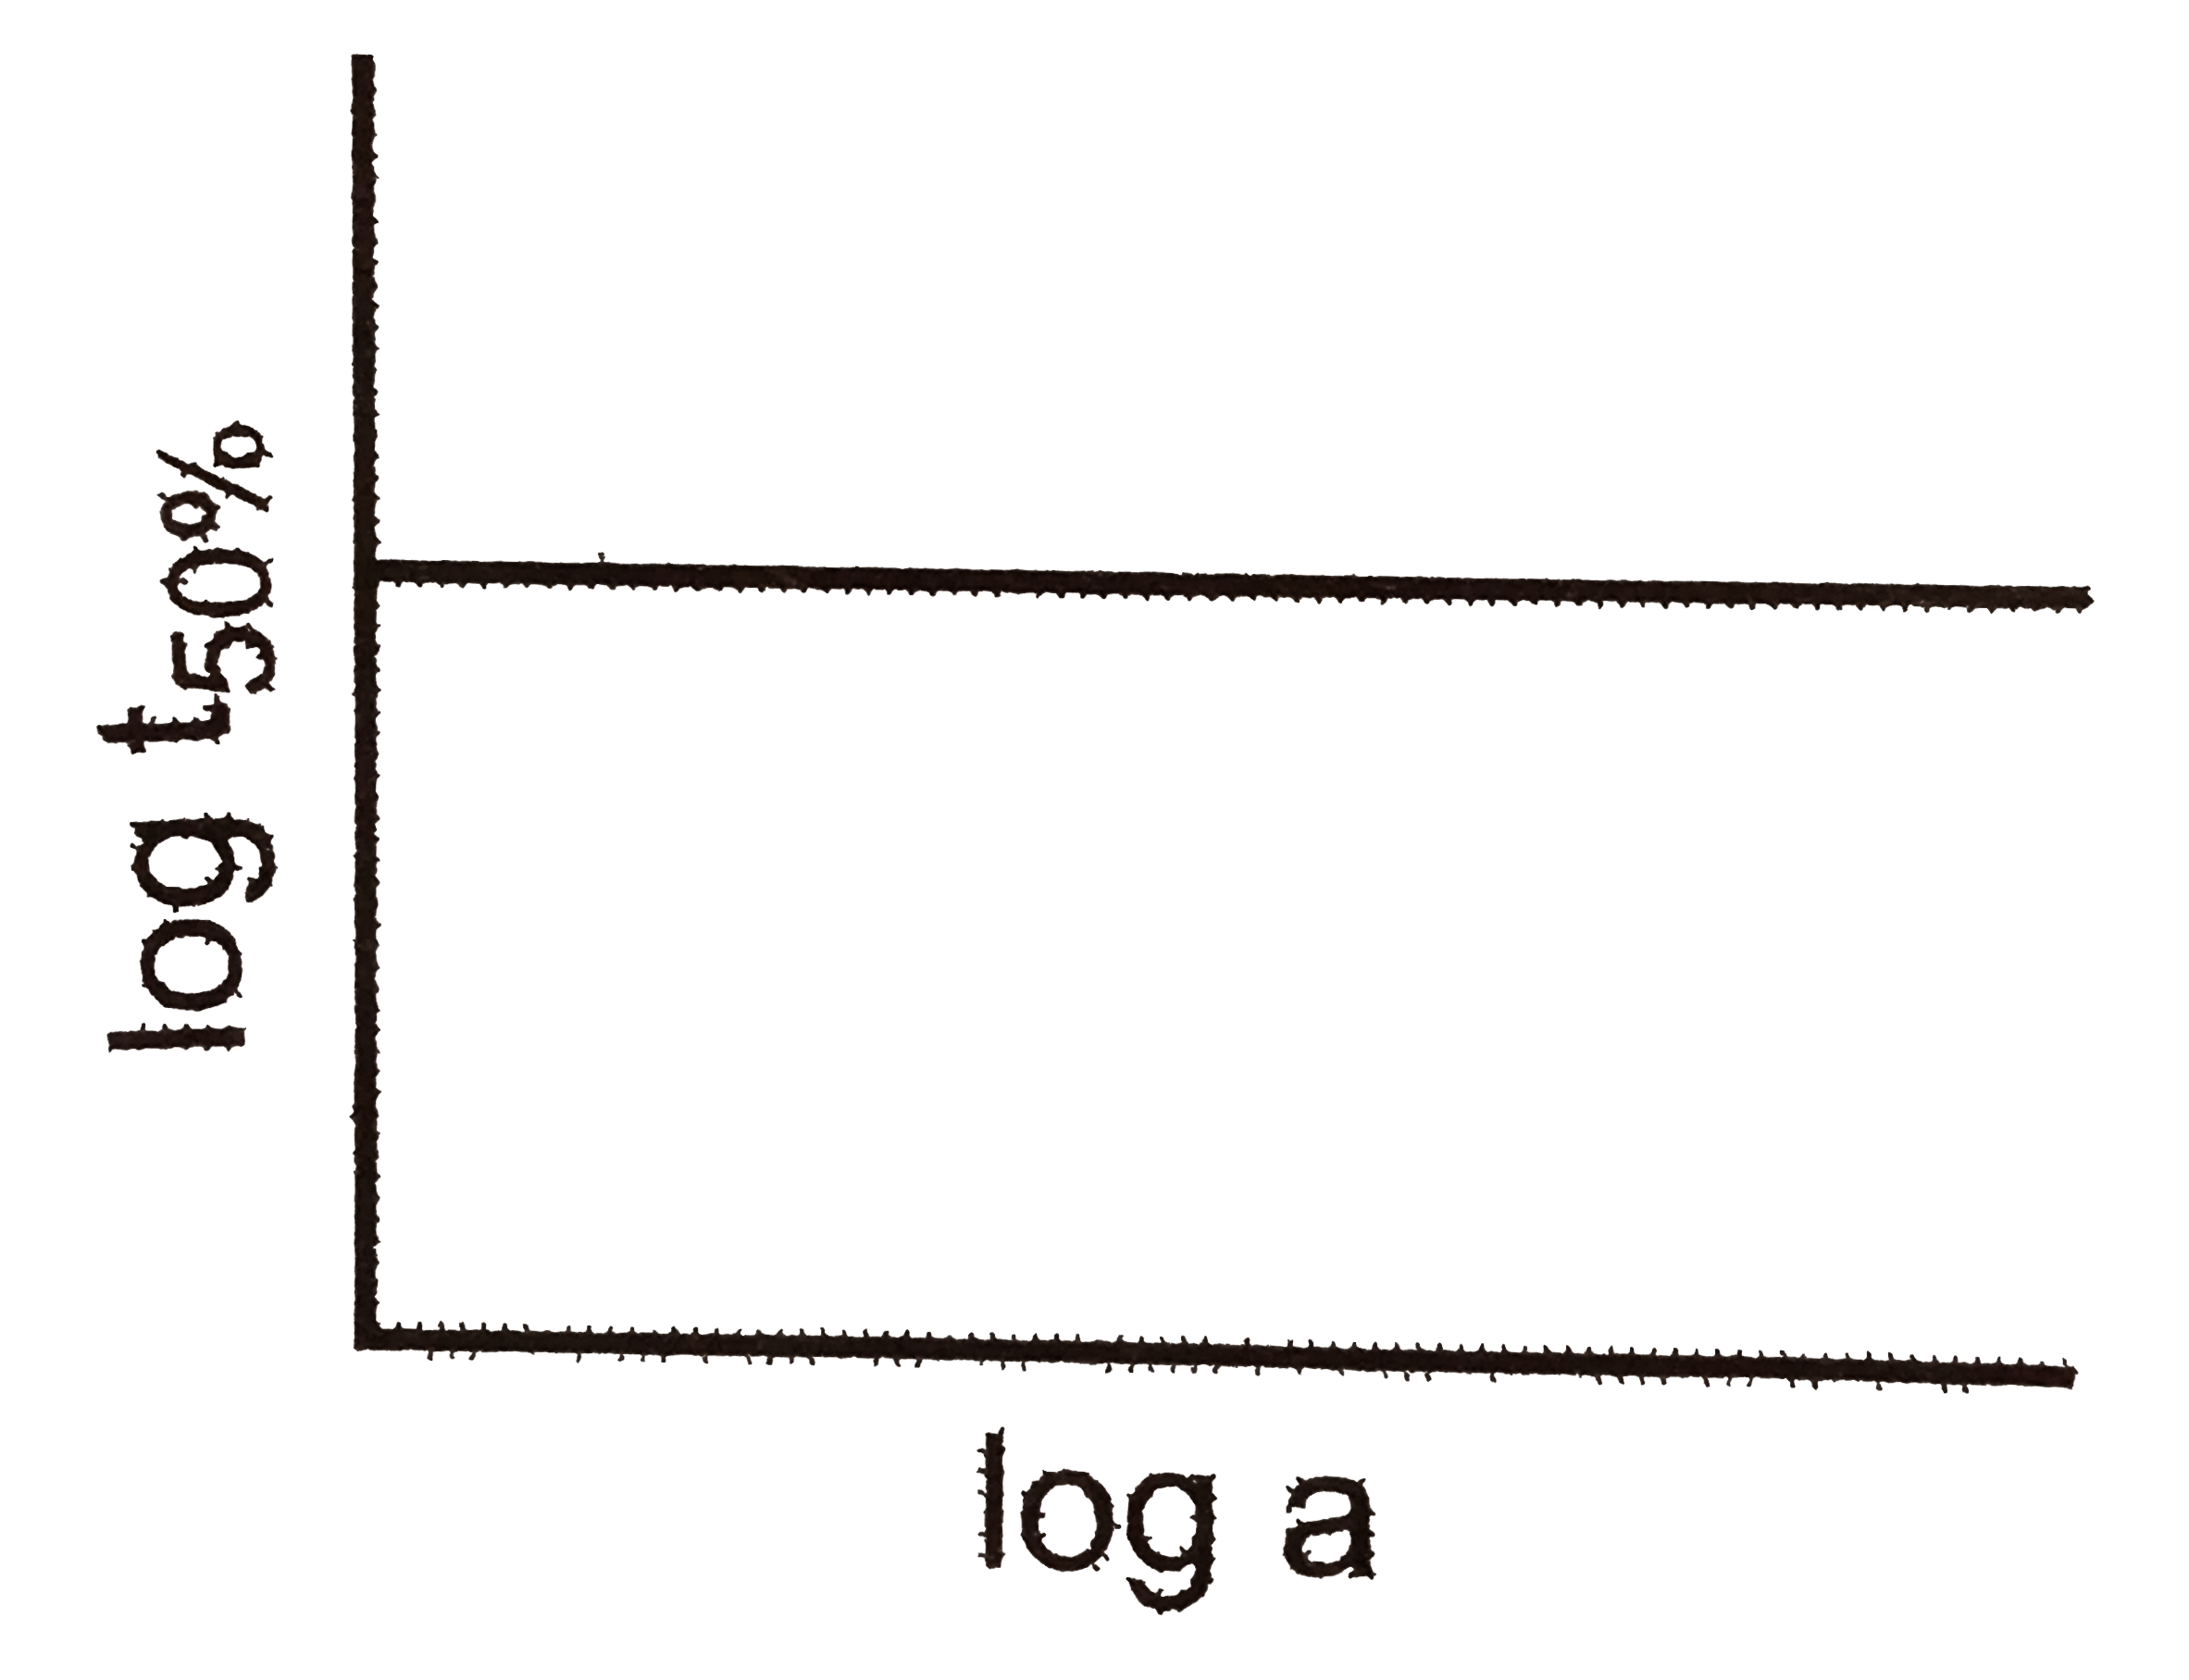
View SolutionA graph plotted between log t50% vs log concentration is a straight line. What conclusion can you draw from this graph?

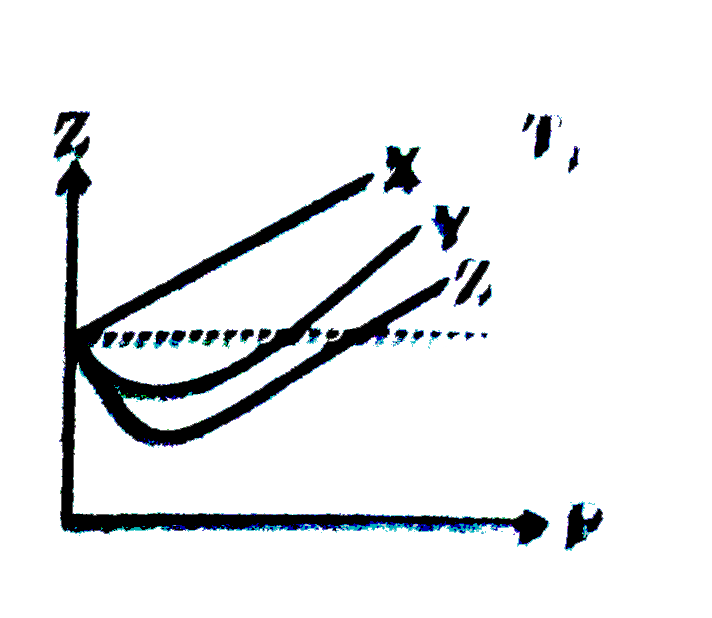
View SolutionZ vs P is plotted for 1 mole of three different gases X,Y and Z at temperature T1. Then which of the following may be correct if the above plot is made for 1 mole of each gas at T2(T2>T1) ?

View SolutionA graph plotted between log t50% vs log concentration is a straight line. What conclusion can you draw from this graph?

View SolutionA graph plotted between log t_(50%) vs log concentration in a straight line. What conclusion can you draw from this graph?
View SolutionFor a second order reaction, 2Ararr Products, a plot of log t_(1//2) vs log a (where a is initial concentration) will give an intercept equal to which one of the following?
View SolutionWhich of the following graphs formed plotted between t_(1//2) and initial concentration (a) represents a zero order reaction ?
View SolutionFor a second order reaction, 2" A"to Products, a plot of log t_(1//2) vs log a (where a is the initial concentration) will give an intercept equal to which of the following ?
View SolutionPlot of t_(1//2) against different initial concentration given a straight line parallel to the concentration axis. The order of the reaction is..........
View Solutionplot a graph of reaction -rate vs concentration of the reactant for a fist order reaction.
View SolutionPlot the graph of t t_(1//2) vs concentration for first order and zero order reaction.
View Solution
