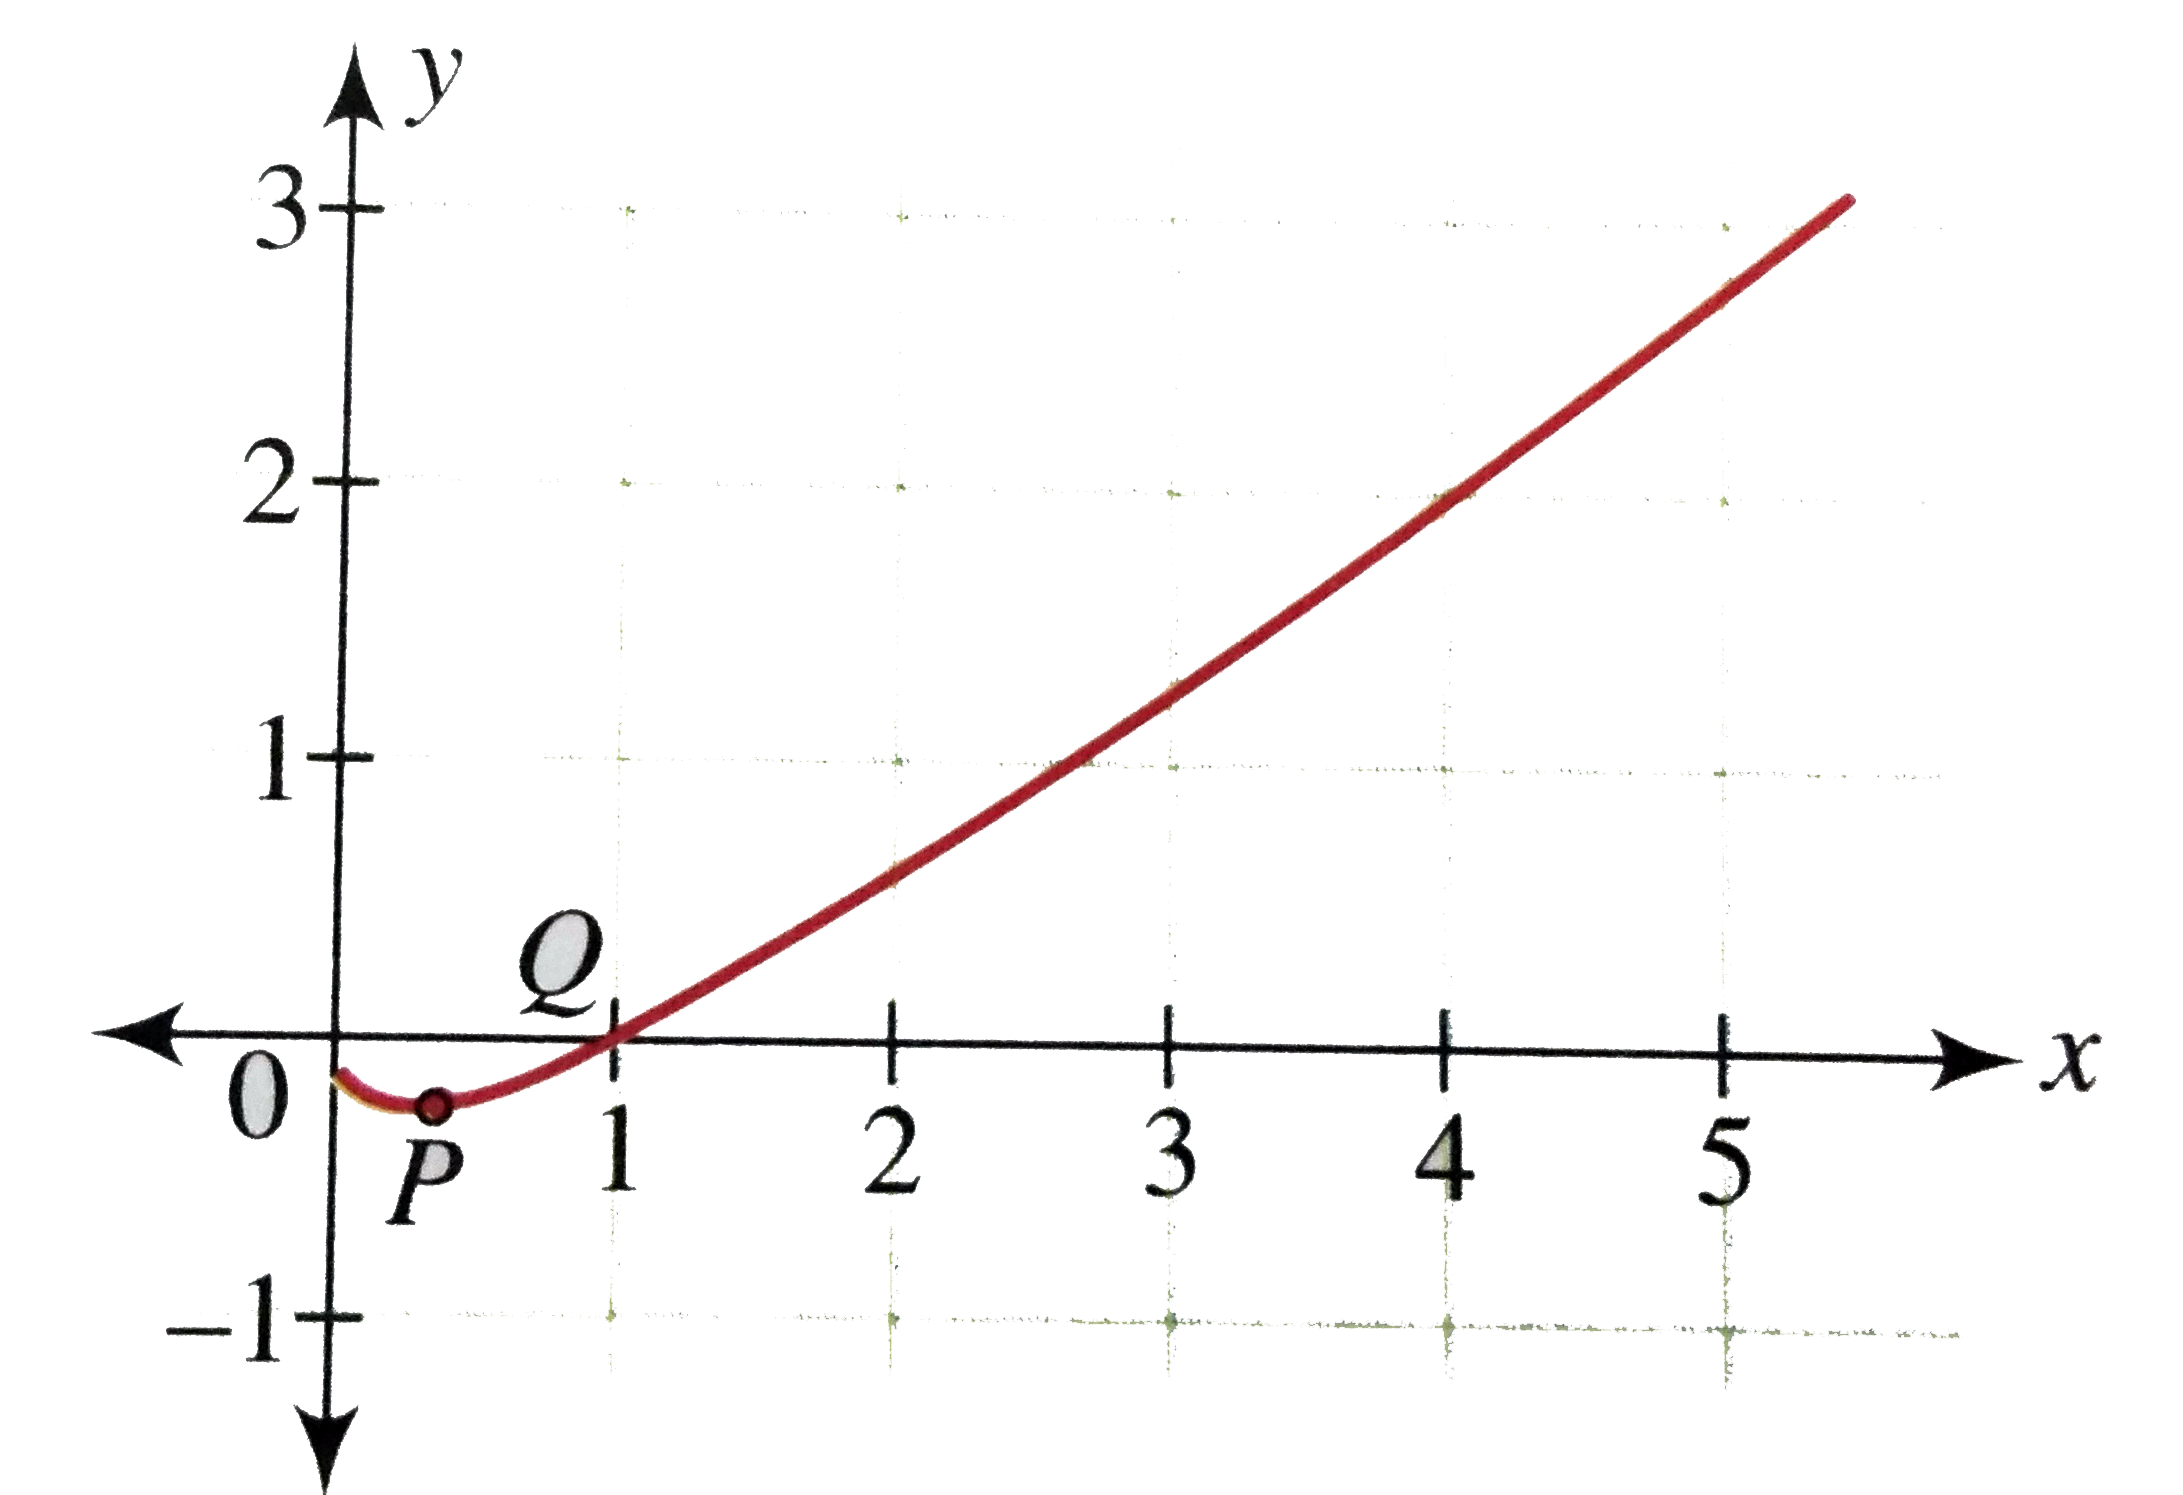
Draw the graph of the function .
Video Solution
Text Solution
We have
Clearly, the domain of the function is
for and
for
Also and
The graph intersects the x-axis at (0,0) and (1,0)
Now,
, which is the point of minima.
Further when
Thus, from point to decreases from 0 to
From P onwards, increases, intersecting the x-axis at .
Hence the graph of the function is as shown in the following figure.

|
Topper's Solved these Questions
Similar Questions
Draw the graph of the function: 1−x
View SolutionDraw the graph of the function f(x)=xx
View SolutionDraw the graph of the function f(x)=2x−|x|
View SolutionDraw the graph of the function f(x)=(1x)x
View SolutionDraw the graph of the function: f(x)=log|x|
View SolutionDraw the graph of the function: |f(x)|=tanx
View SolutionConsider the graph of the function f(x)=x√|x| Statement-1: The graph of y=f(x) has only one critical point Statement-2: f'(x) vanishes only at one point
View SolutionDraw the graph of the function f(x)=|x|+|x−1|
View SolutionDraw the graph of the function: f(x)=||x−2|−3|
View SolutionDraw the graph of the function: f(x)=−|x−1|12
View Solution
