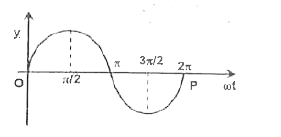
The graph plotted between phase angle (ωt) and displacement of a particle from equilibrium position (y) is a sinusoidal curve as shown below. Then the best matching is
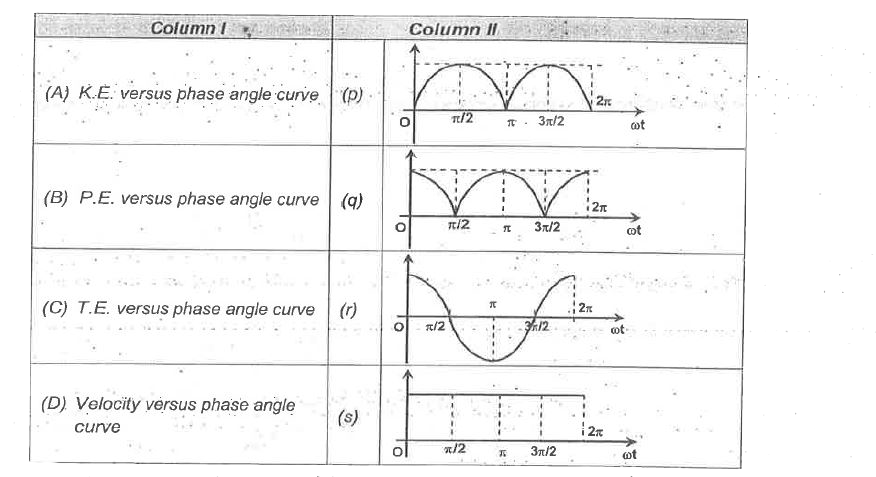
PQRS1432
PQRS2143
PQRS3214
PQRS2341
The correct Answer is:B
Topper's Solved these Questions
- SIMPLE HARMONIC MOTIONBOOK - FIITJEECHAPTER - SIMPLE HARMONIC MOTIONEXERCISE - Exercise
28 Videos
- SIMPLE HARMONIC MOTIONBOOK - FIITJEECHAPTER - SIMPLE HARMONIC MOTIONEXERCISE - Assignment Problems (Subjective) (Level)
20 Videos
- SIMPLE HARMONIC MOTIONBOOK - FIITJEECHAPTER - SIMPLE HARMONIC MOTIONEXERCISE - Numerical Based Questions
6 Videos
- SEMICONDUCTOR AND DEVICEBOOK - FIITJEECHAPTER - SEMICONDUCTOR AND DEVICEEXERCISE - SOLVED PROBLEMS Objective: Level-I
20 Videos
- TEST PAPERSBOOK - FIITJEECHAPTER - TEST PAPERSEXERCISE - PHYSICS
747 Videos
Similar Questions
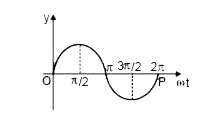
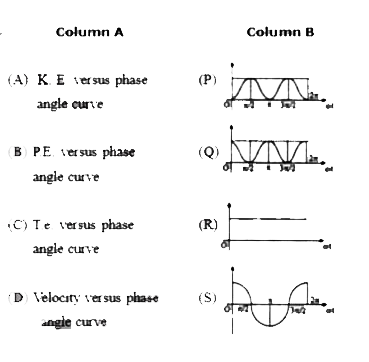
The graph plotted between phase angle (ϕ) and displacement of a particle from equilibrium position (y) is a sinusoidal curve as shown below. Then the best matching is
View SolutionIf a graph is plotted between velocity (v) and displacement (y) of a particle executing SHM from mean position, then the nature of the graph is
View Solution
Knowledge Check
The graph plotted between acceleration and displacement of a particle in SHM is
Aa straight lineBa circleCan ellipseDa hyperbolaIf a graph is plotted between velocity (v) and displacement (y) of a particle executing SHM from mean position, then the nature of the graph is
AStraight lineBParabolaCEllipseDHyperbolaIf a graph is plotted between angular velocity ω and distance x of a particle performing uniform circular motion, the graph is a straight line
Aparaller to ω axisBpaeallel to distance x-axisCintersecting both ω and distance axisDintersecting only ω axis
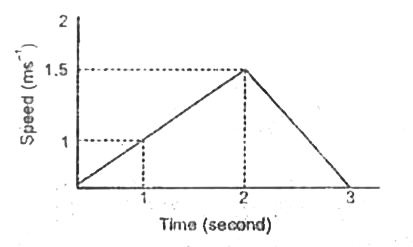
The speed - time graph of a particle moving along a solid curve is shown below. The distance traversed by the particle from t = 0 to t = 3 is
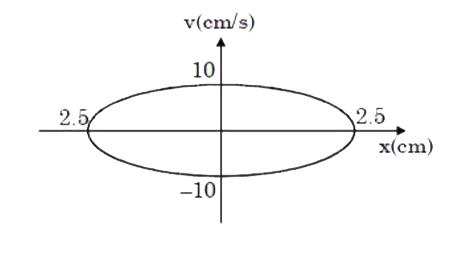
View SolutionA graph between velocity and displacement of a particle performing SHM is shown. Find the acceleration when the particle is at half of maximum displacement from mean position.
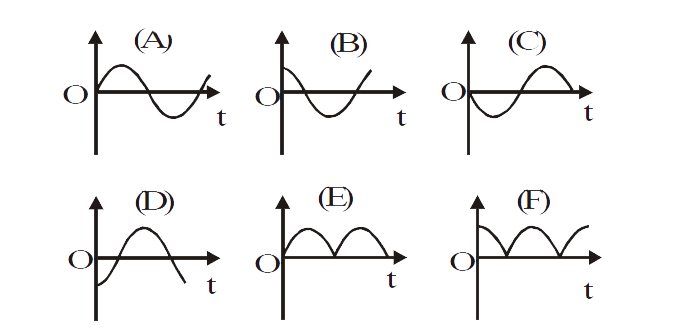
View SolutionThe displacement of a particle in S.H.M. is x=asinωt. Which of the following graph between displacement and time is correct :
View SolutionThe speed - time graph of a particle moving along a solid curve is shown below. The distance traversed by the particle from t = 0 to t = 3 is

View SolutionThe displacement of a particle varies with time according to the relation y=asinωt+bcosωt.
View Solution
