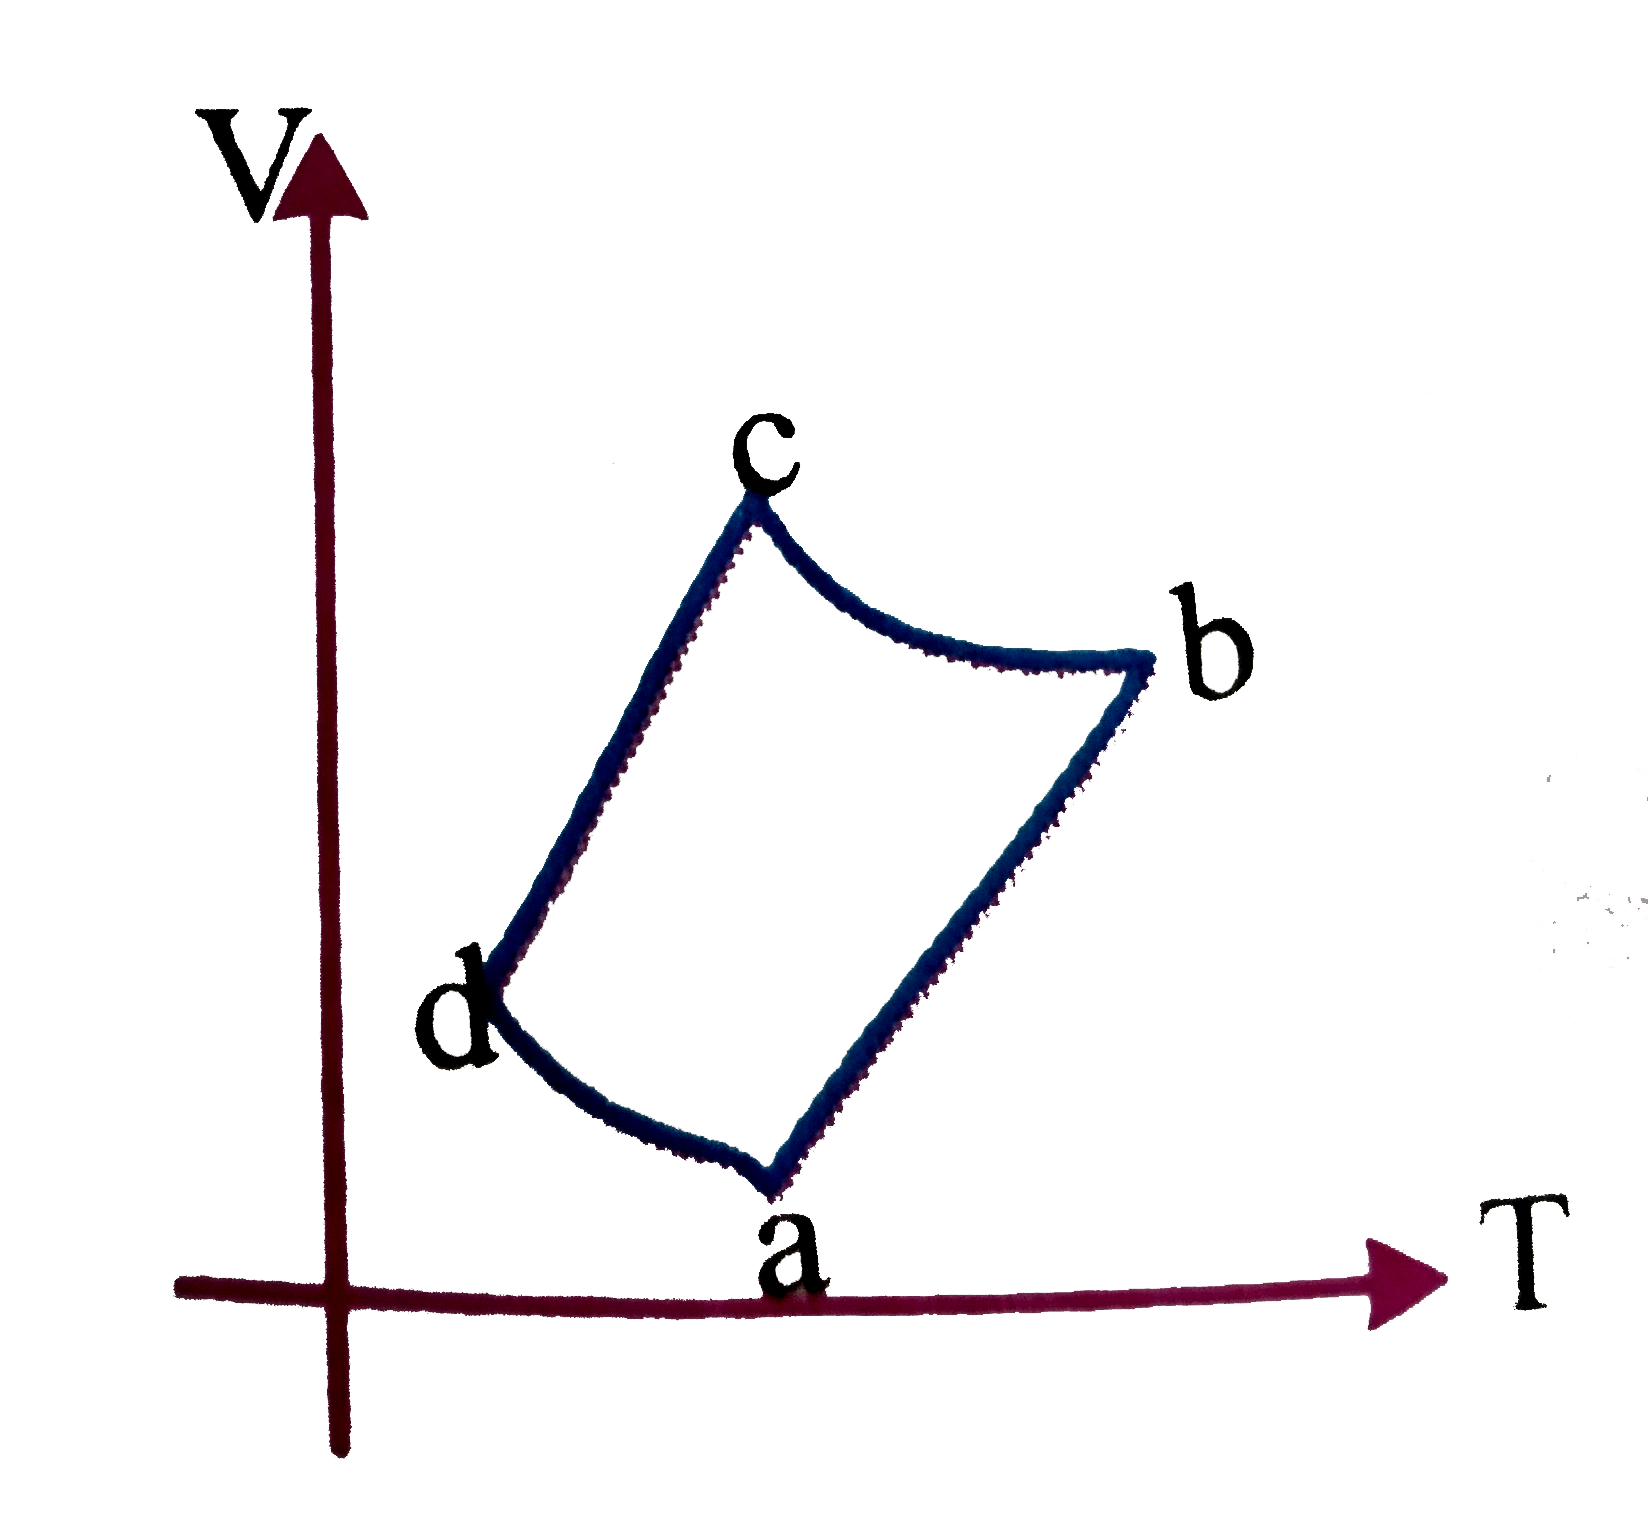
An ideal gas goes through a v reversible cycle has the V - T diagram shown below.
Process and are adiabatic.
The corresponding P - V diagram for the process is (all figures are schematic and not drawn to scale):

A

B

C

D

Text Solution
The correct Answer is:B
In VT graph
ab-process : Isobaric, temperature increases,
bc process : Adiabatic, pressure decreases,
cd process : Isobaric, volume decreases,
da process : Adiabatic, pressure increases.
The above processes correctly represented in P-V diagram (b).
|
Topper's Solved these Questions
- THERMODYNAMICS BOOK - DISHA PUBLICATIONCHAPTER - THERMODYNAMICS EXERCISE - EXERCISE-1 : CONCEPT BUILDER (Topic- ZEROTH LOW AND FIRST LAW OF THERMODYNAMICS)
11 Videos
- THERMODYNAMICS BOOK - DISHA PUBLICATIONCHAPTER - THERMODYNAMICS EXERCISE - EXERCISE-1 : CONCEPT BUILDER (Topic-2 SPECIFIC HEAT CAPACITY THERMODYNAMICS PROCESSES)
33 Videos
- THERMAL PROPERTIES OF MATTER BOOK - DISHA PUBLICATIONCHAPTER - THERMAL PROPERTIES OF MATTER EXERCISE - Exercise-2 (Concept Applicator)
28 Videos
- WAVE OPTICSBOOK - DISHA PUBLICATIONCHAPTER - WAVE OPTICSEXERCISE - EXERCISE-2 : CONCEPT APPLICATOR
30 Videos
Similar Questions
Knowledge Check
An ideal gas goes through a reversible cycle a→B→c→d has the V-T diagram shown below. Process d→a and b→c are adiabatic
The corresponding P-V diagram for the process is(all figures are schematic and not drawn to scale)A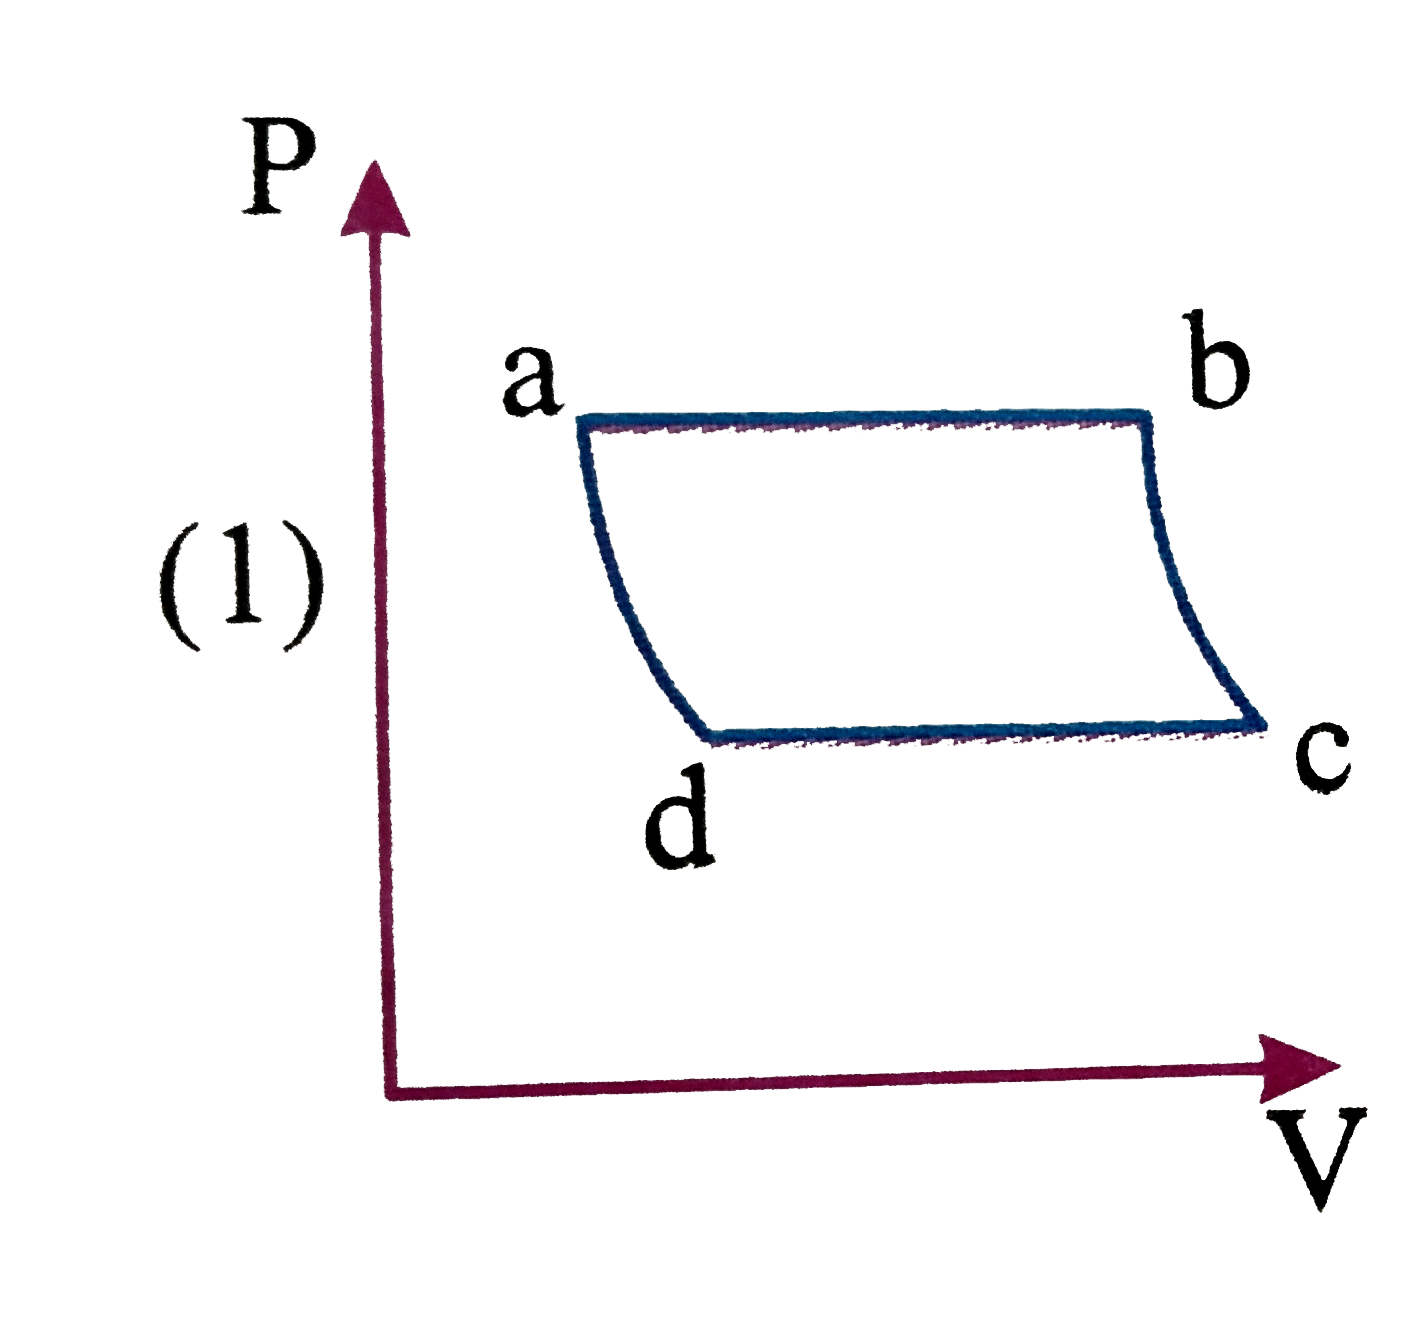 B
B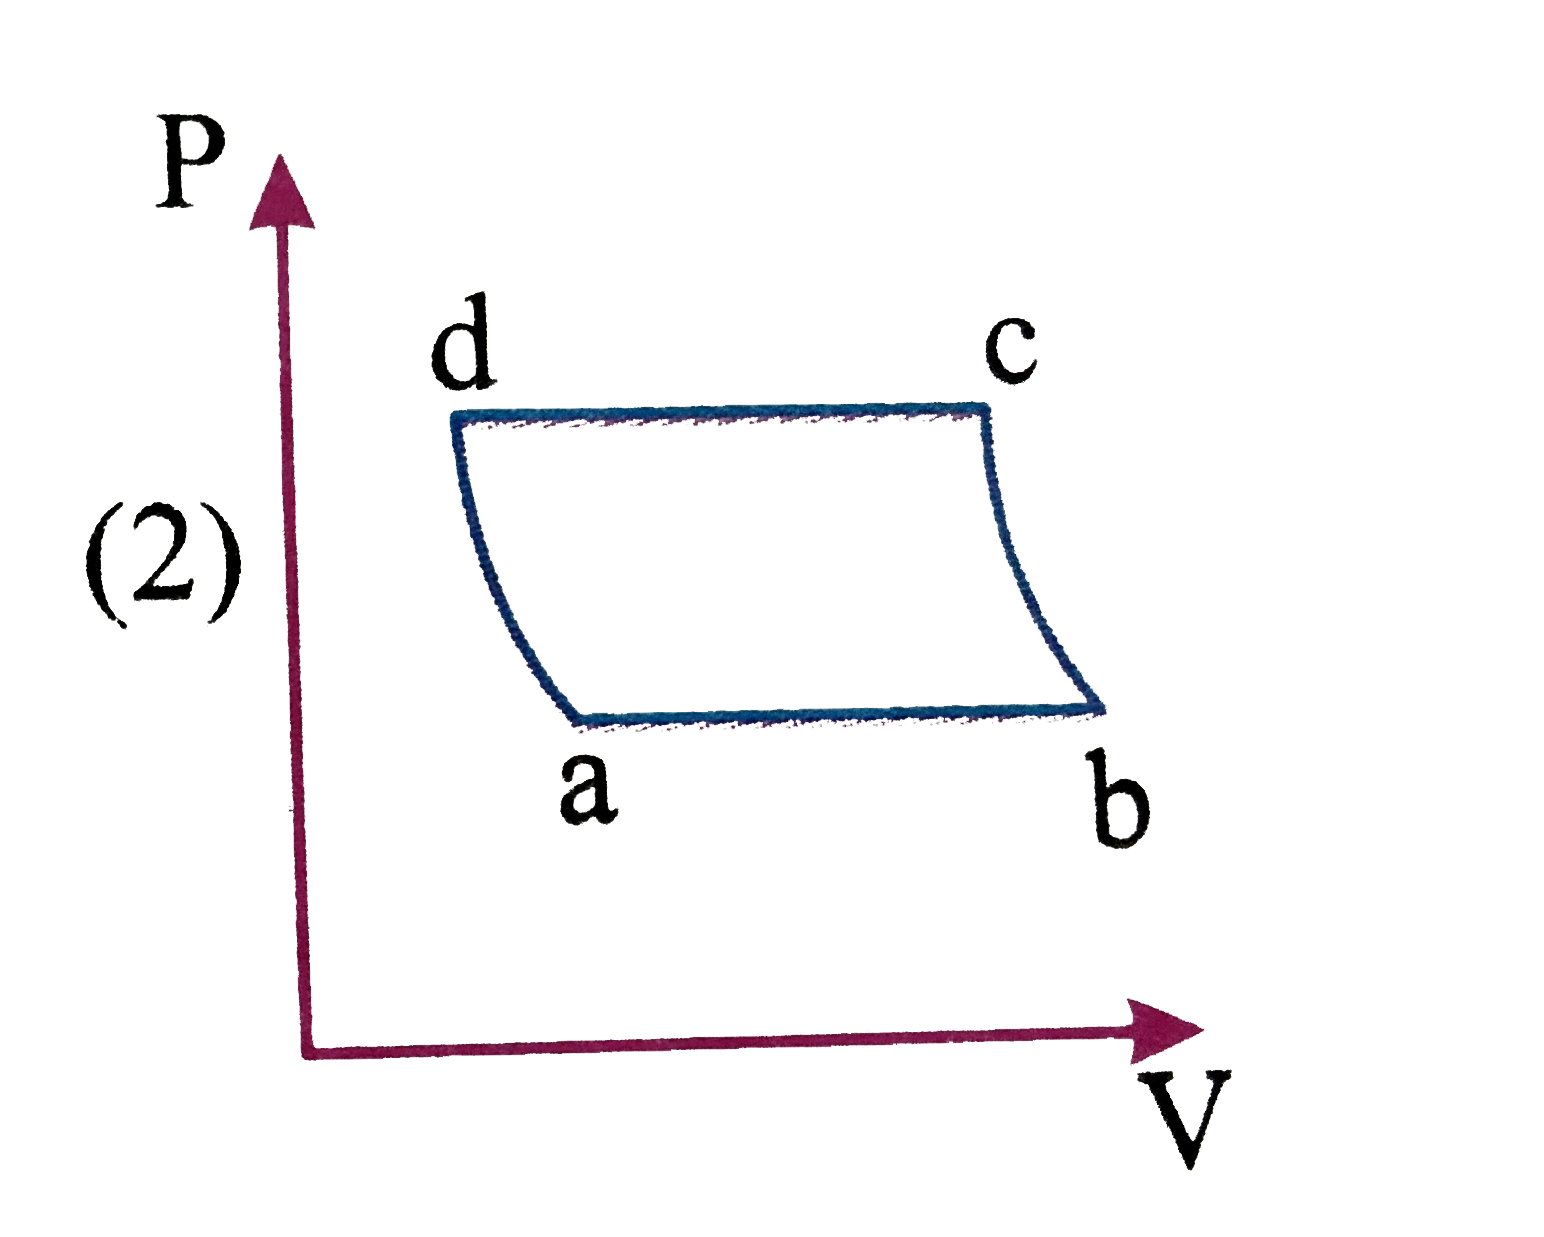 C
C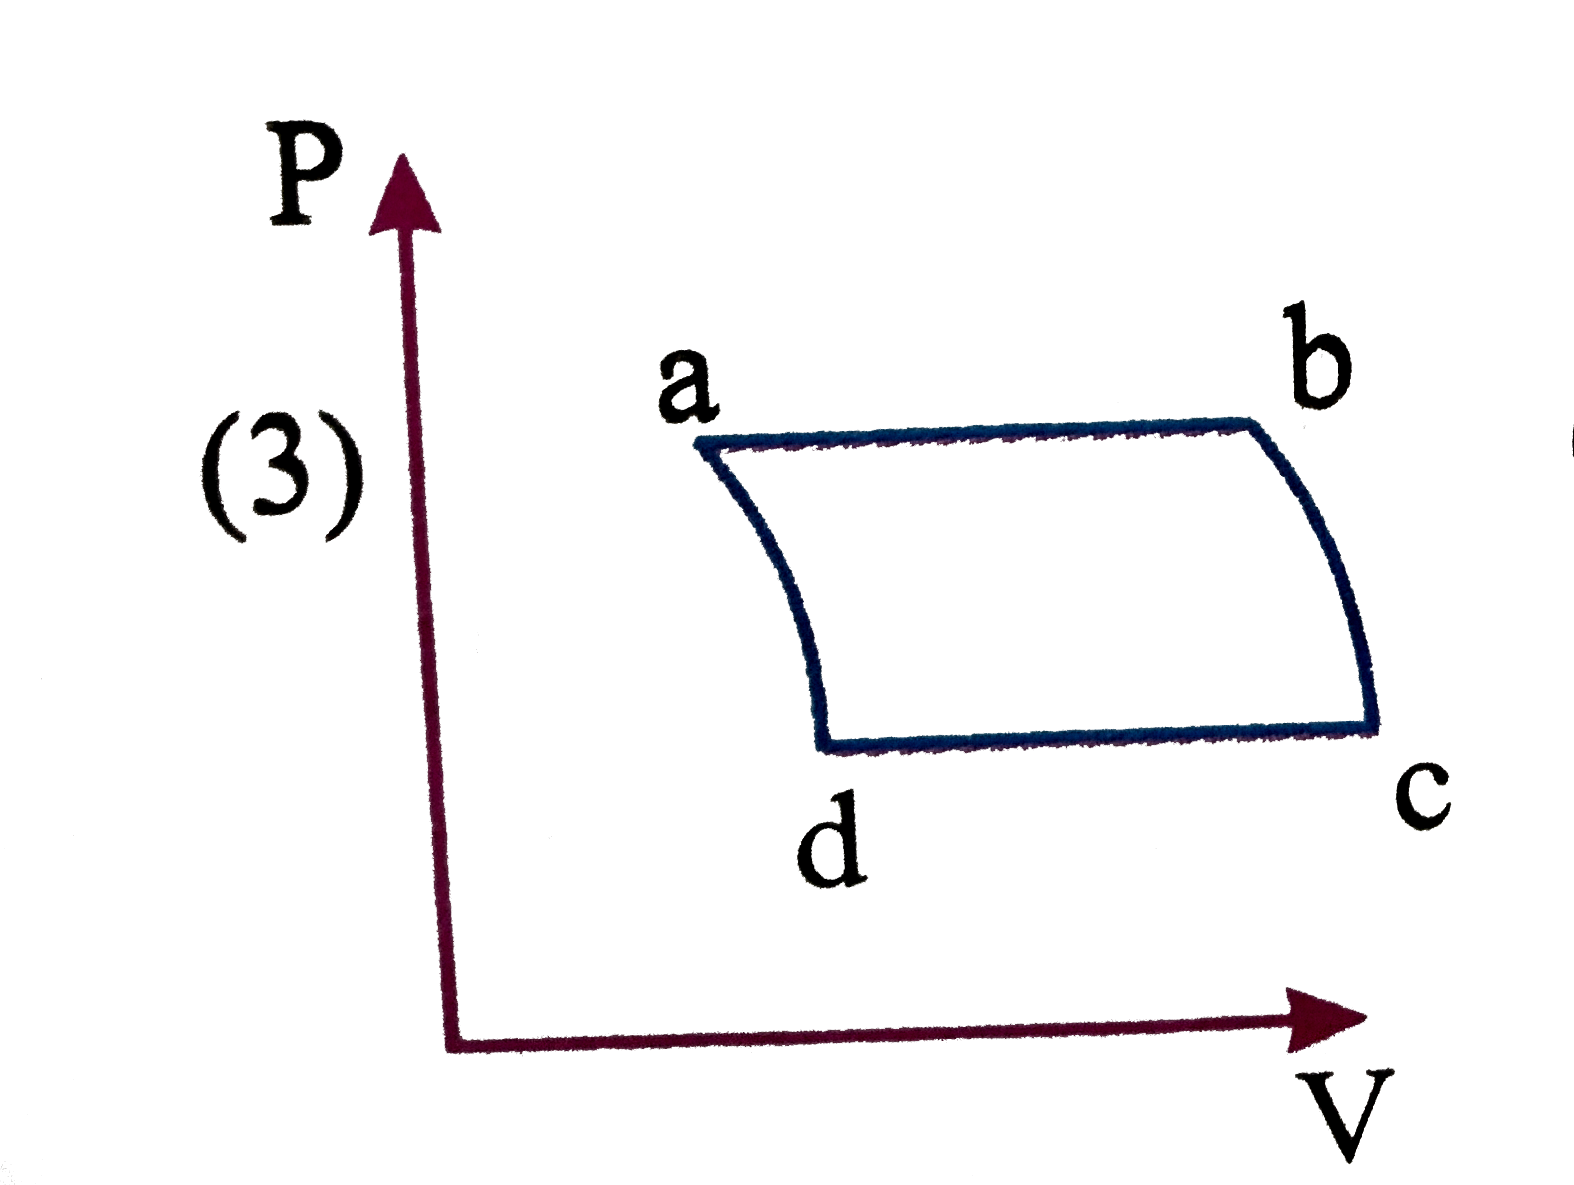 D
D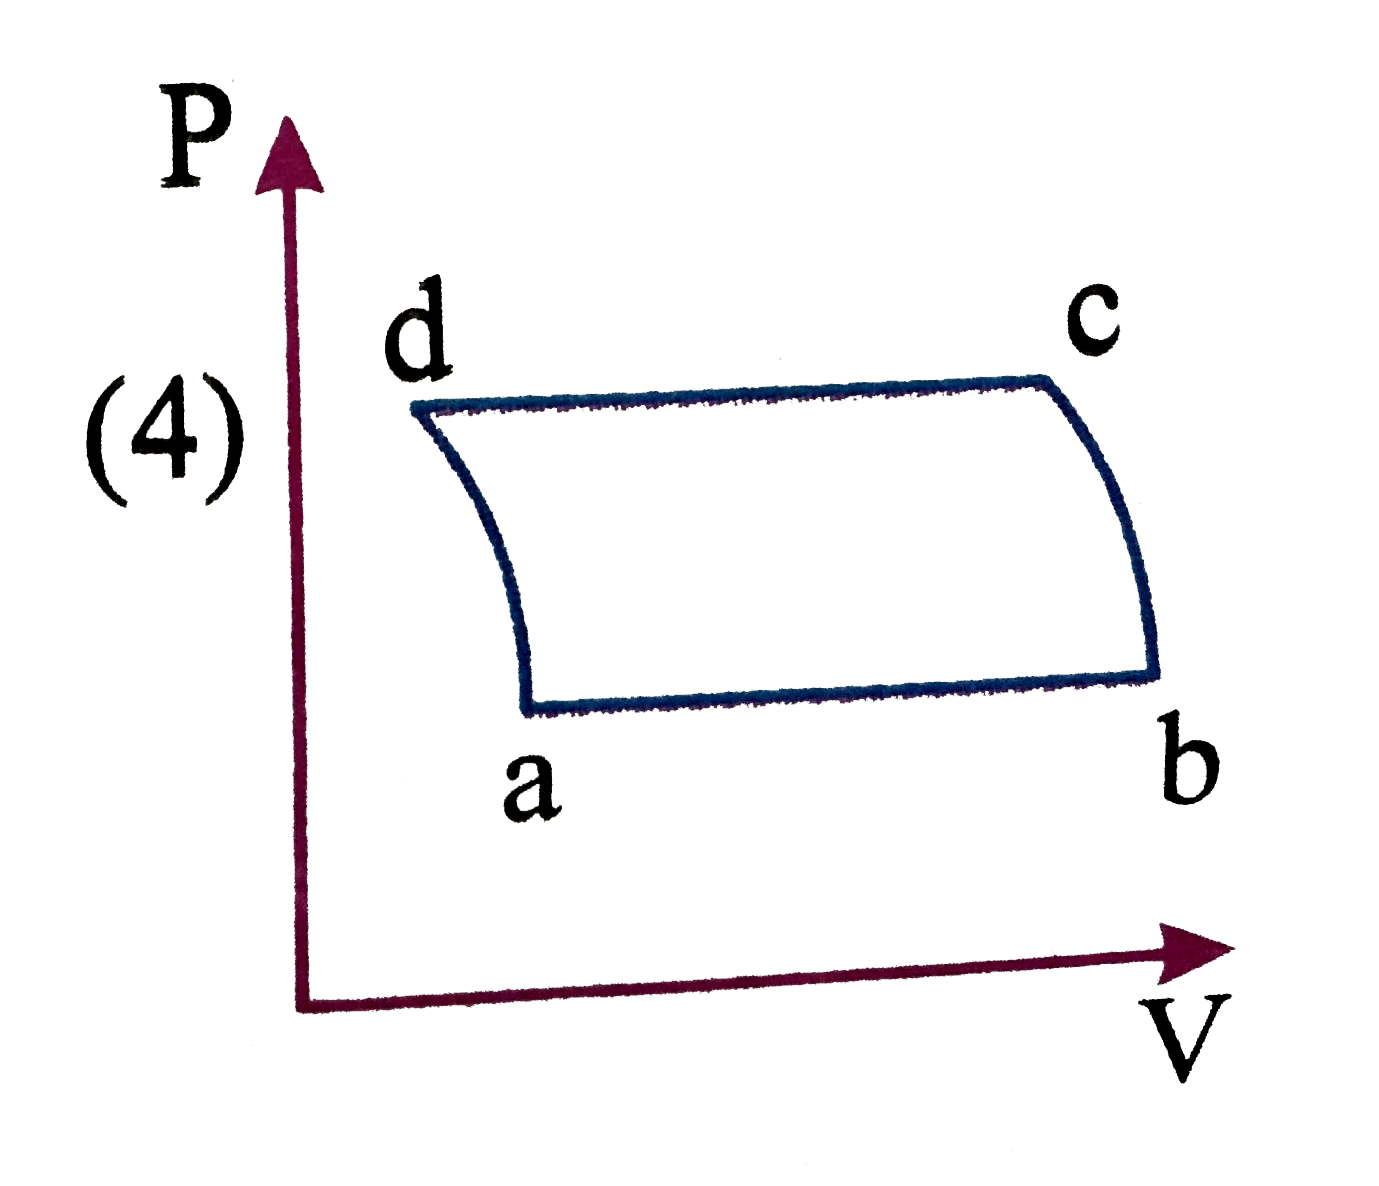
A cyclie process ABCD is shwon in a V−T diagram. The corresponding P−V diagram is
 A
A B
B C
C D
D
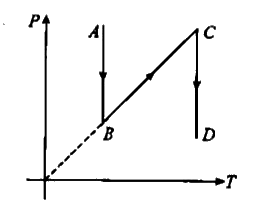
The PT diagram for an ideal gas is shown in the figure, where AC is an adiabatic process, find the corresponding PV diagram.
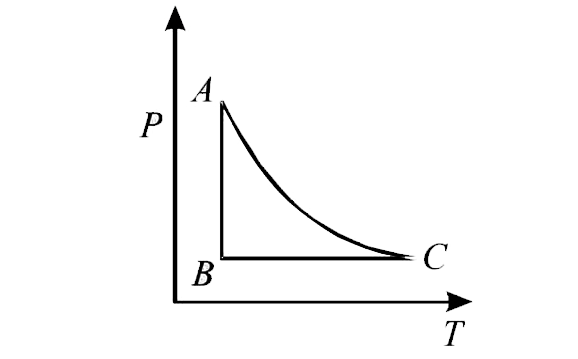 A
A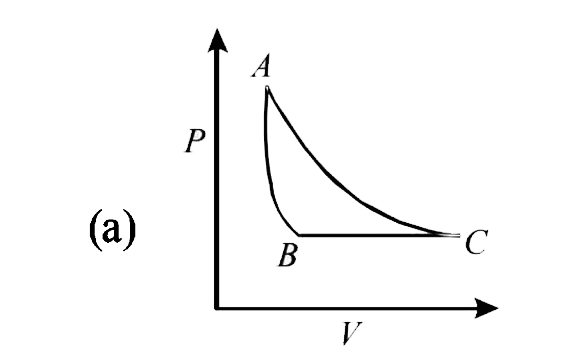 B
B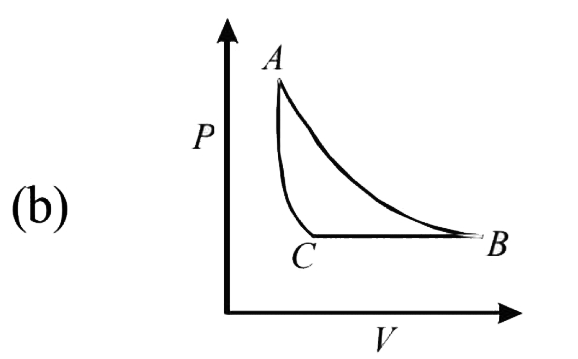 C
C D
D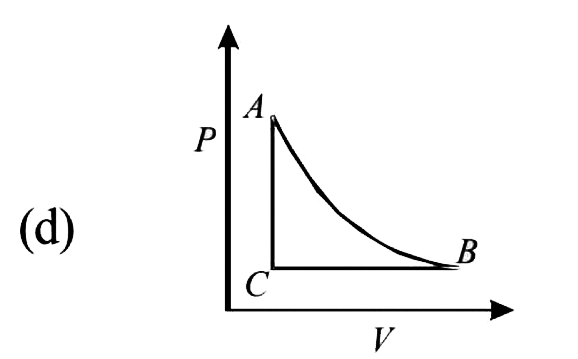
P-T diagram is shown below then choose the corresponding V-T diagram
View SolutionA thermodynamic cycle xyzx is shown on a V-T diagram.
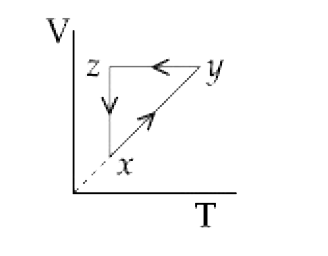
The P-V diagram that best describe this cycle is: (Diagrams are schematic and not to scale).
View SolutionA thermodynamic cycle xyzx is shown on a V-T diagram.

The P-V diagram that best describe this cycle is: (Diagrams are schematic and not to scale).
View SolutionThe PT diagram for an ideal gas is shown in the figure, where AC is an adiabatic process, find the corresponding PV diagram.

View SolutionThe PT diagram for an ideal gas is shown in the figure, where AC is an adiabatic process, find the corresponding PV diagram.

View Solution
