For a reaction A P, the plots of [A] and [P] with time at temperature T1 and T2 are given below
![For a reaction A P, the plots of [A] and [P] with time at temperature T(1) and T(2) are given below If T(2)gtT(1), the correct statement(s) is (are) (Assume DeltaH^(theta) and DeltaS^(theat) are independent of temperature and ratio of lnK at T(1) to InK at T(2) is greater than T(2)//T(1). Here H, S, G and K are enthalpy, entropy, Gibbs energy and equilibrium constant, respectively.)](https://d10lpgp6xz60nq.cloudfront.net/physics_images/ERRL_CHM_V01_C10_E03_083_Q01.png)
If T2>T1, the correct statement(s) is (are)
(Assume ΔHθ and ΔStheat are independent of temperature and ratio of lnK at T1 to InK at T2 is greater than T2/T1. Here H, S, G and K are enthalpy, entropy, Gibbs energy and equilibrium constant, respectively.)
ΔHθ<0,ΔSθ<0
ΔGθ<0,ΔHθ>0
ΔGθ<0,ΔSθ<0
ΔGθ<0,ΔSθ>0
The correct Answer is:A, C
A⇔P
Given T2>T1
lnK1lnK2>T2T1
⇒T1lnk1>T2lnk2
⇒−ΔG∘1>−ΔG∘2
⇒(−ΔH∘+T1ΔS∘)>(−ΔH∘+T2ΔS∘)
⇒T1ΔS∘>T2ΔS∘
⇒ΔS∘>0
Topper's Solved these Questions
- THERMODYNAMICS AND THERMOCHEMISTRY BOOK - ERRORLESS CHAPTER - THERMODYNAMICS AND THERMOCHEMISTRY EXERCISE - JEE section (JEE (Advanced) 2018) Numeric answer type questions
2 Videos
- THERMODYNAMICS AND THERMOCHEMISTRY BOOK - ERRORLESS CHAPTER - THERMODYNAMICS AND THERMOCHEMISTRY EXERCISE - JEE section (Matrix Match type questions)
4 Videos
- SOME BASIC CONCEPTS OF CHEMISTRYBOOK - ERRORLESS CHAPTER - SOME BASIC CONCEPTS OF CHEMISTRYEXERCISE - JEE Section (Matrix Match type questions)
3 Videos
Similar Questions
For a reaction A→P, the plots of [A] and [P] with time at temperatures T1 and T2 are given below.
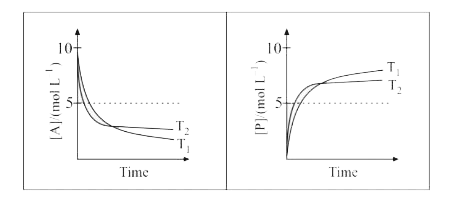
If T1>T2, the correct statements is (are):
(Assume ΔHΘ and ΔSΘ are independent of temperature and ratio of ln K at T1 to ln K at T2 is greater than T2T1. Here H,S,G and K are enthalpy, entropy, Gibbs energy and equilibrium constant, respectively).
View SolutionThe graph of (xm) vs P at two different temperature T1 and T2 is [where T1>T2]
View Solution
Knowledge Check
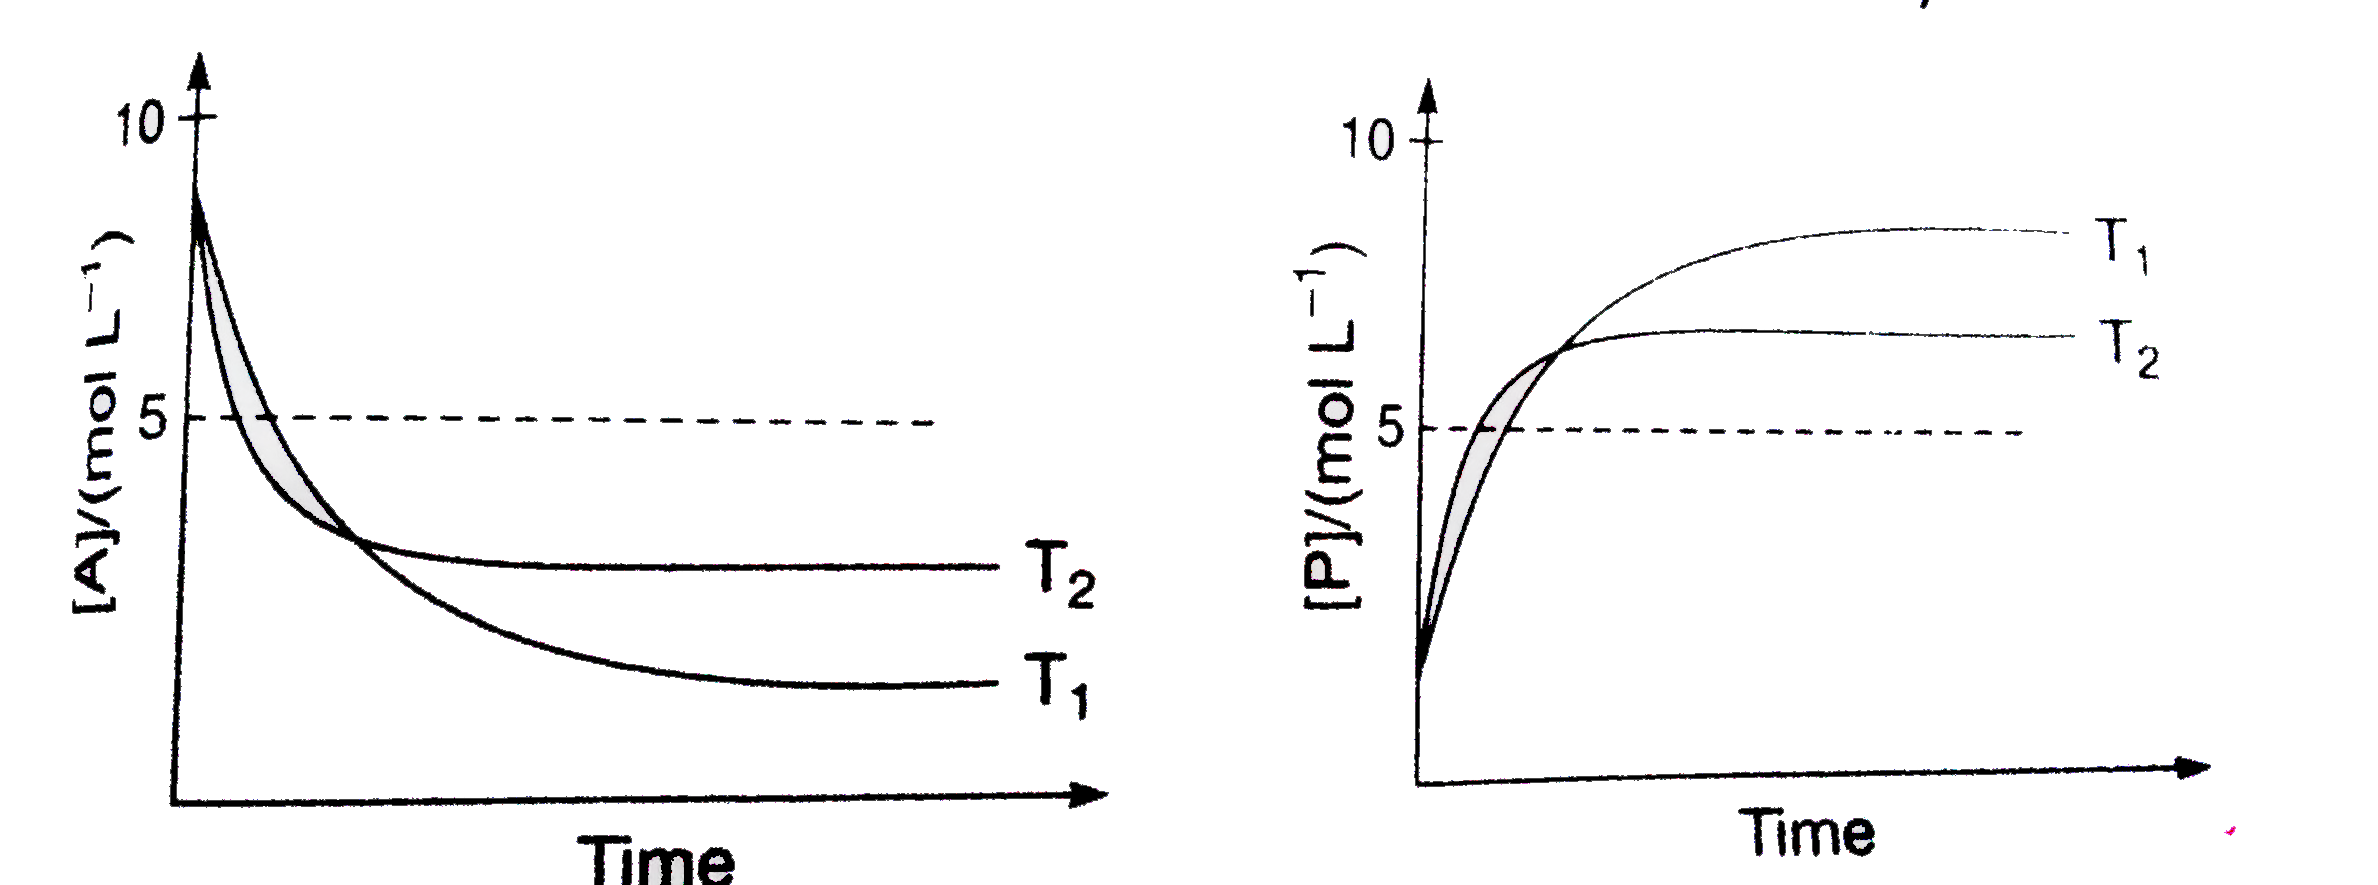
For a reaction, A⇔P, the plots of [A[ and [P] with time at temperature T1andT2 are given ahead:
 .
.
If T1>T1, the correct statement(s) is (are):
(Assume ΔH∘ and ΔS∘ are independent of temperature and ratio of ln K at T1 to ln K at T2 as greater than T2T1. Here, H,S,G and K are enthalpy, entropy, Gibbs energy and equilibrium constant, respectively.AΔH∘<0,ΔS∘<0BΔG∘<0,ΔH∘>0CΔG∘<0,ΔS∘<0DΔG∘<0,ΔS∘>0Shown below are the black body radiation curves at temperature T1 and T2(T2>T1). Which of the following plots is correct?
A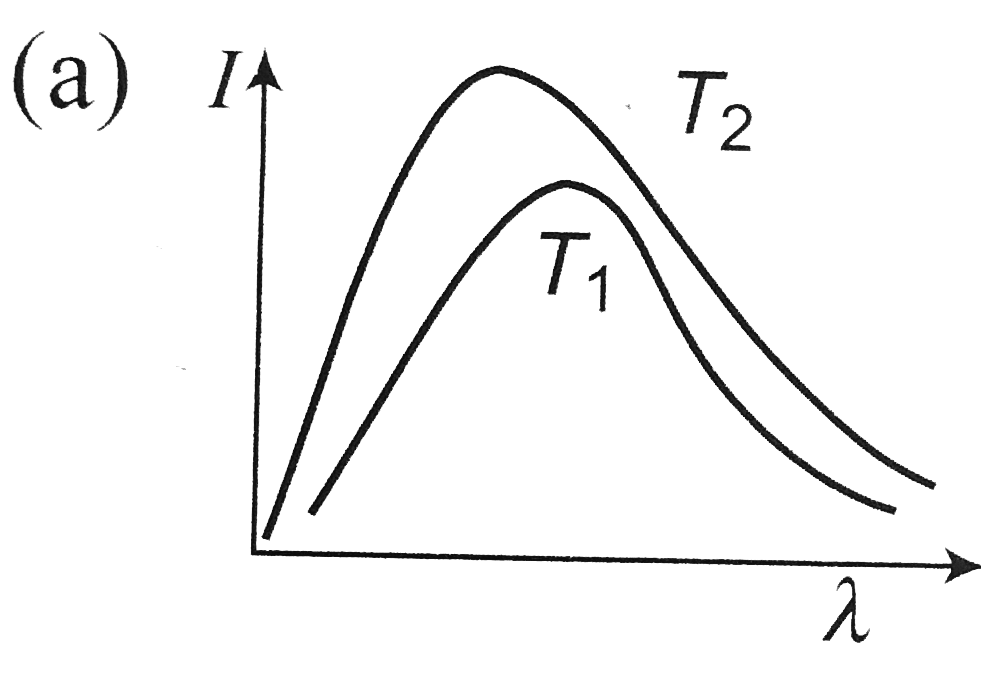 B
B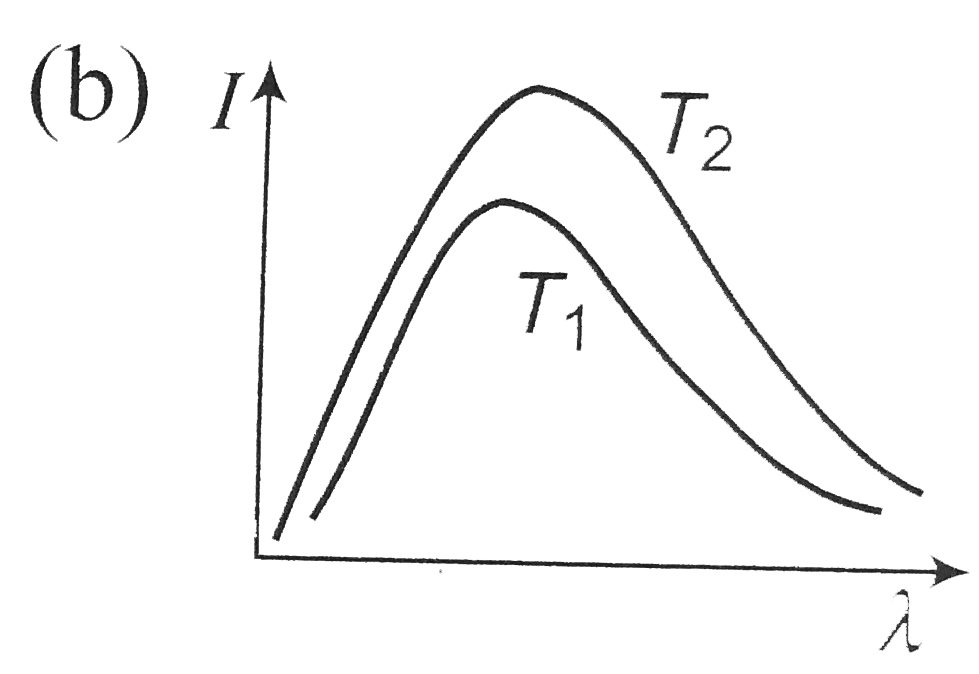 C
C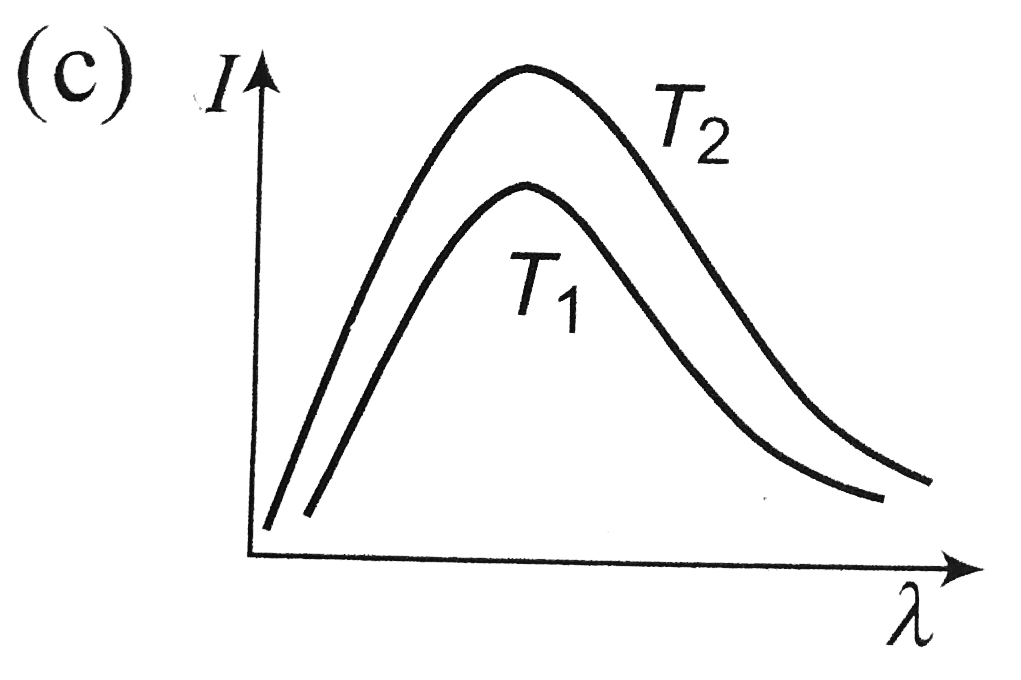 D
D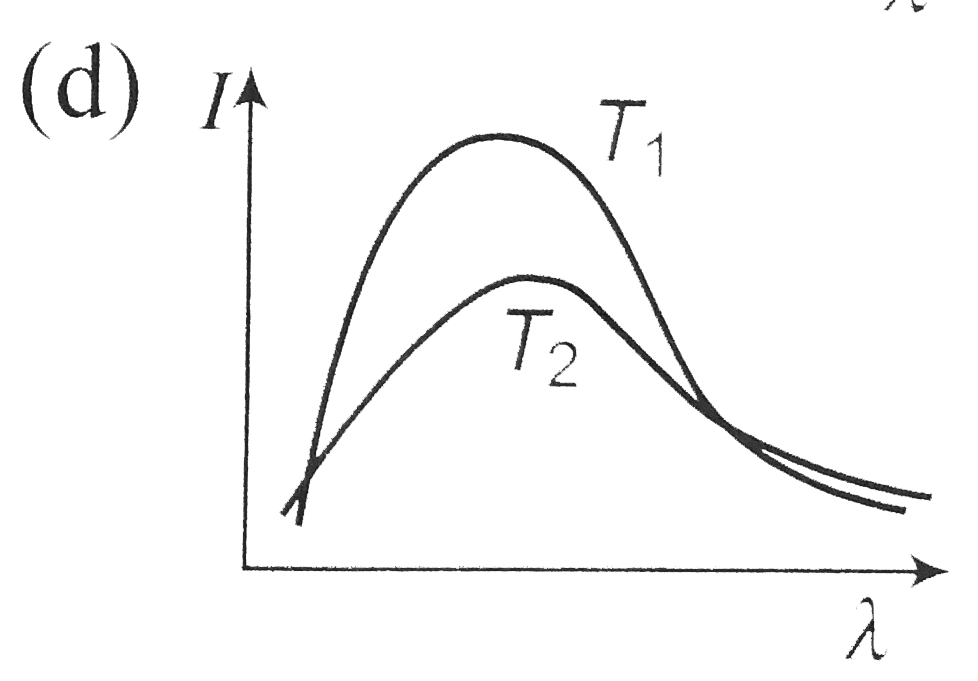
The product of PV is plotted against P at two temperatures T1 and T2 and the result is shown in figure. What is correct about T1 and T2?
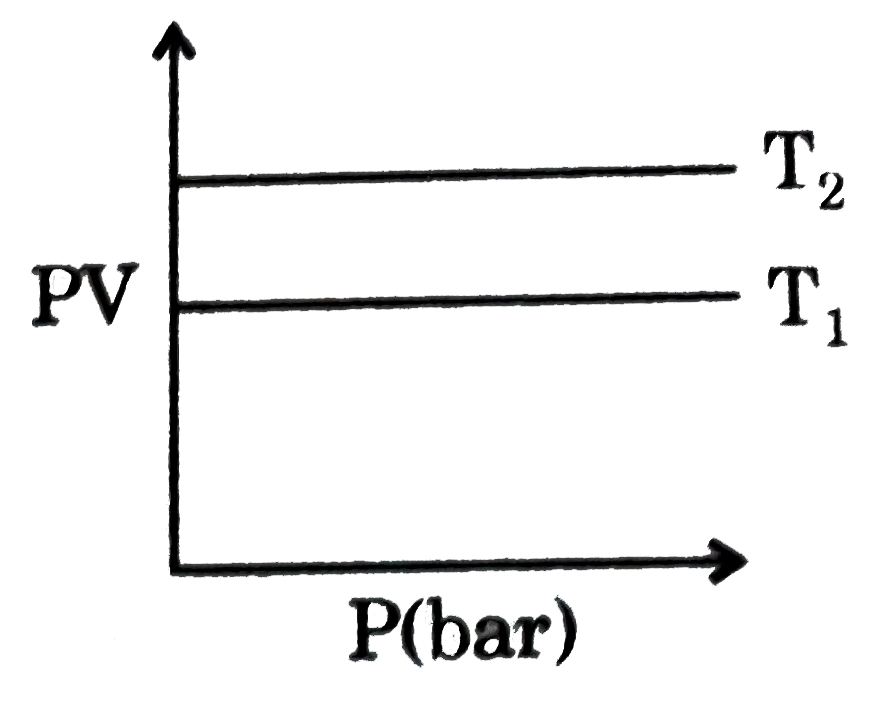 AT1>T2BT2>T1CT1=T2DT1+T2=1
Shown below are the black body radiation curves at temperature T1 and T2(T2>T1). Which of the following plots is correct?
View SolutionThree isothermal plots (P versus V) A, B and C are plotted at three temperature T1,T2andT3 respectively
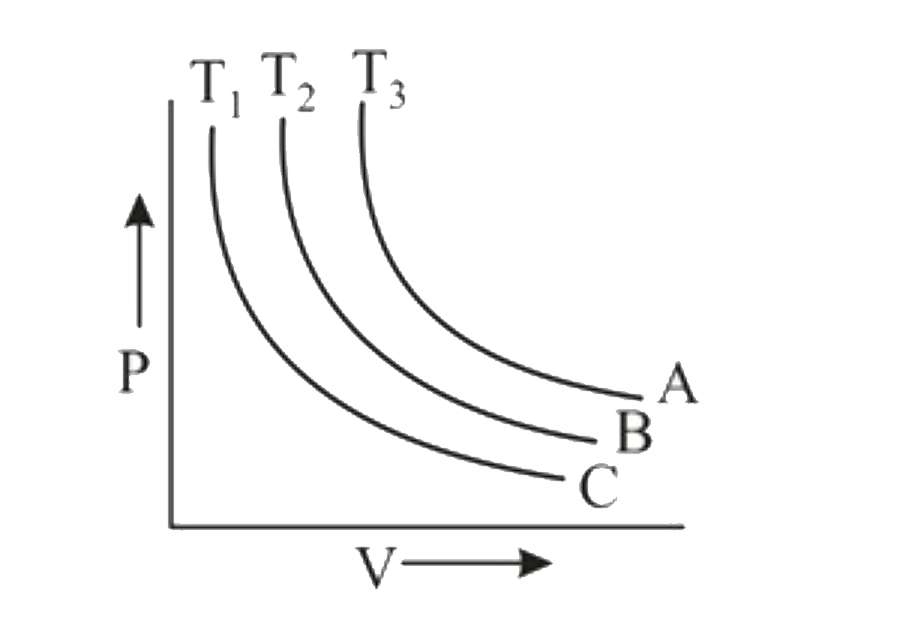
The correct order of the temperature will be
View SolutionThe p−V diagrams of same mass of a gas are drawn at two different temperatues T1 and T2 Explain whether T1>T2> or T2>T1.
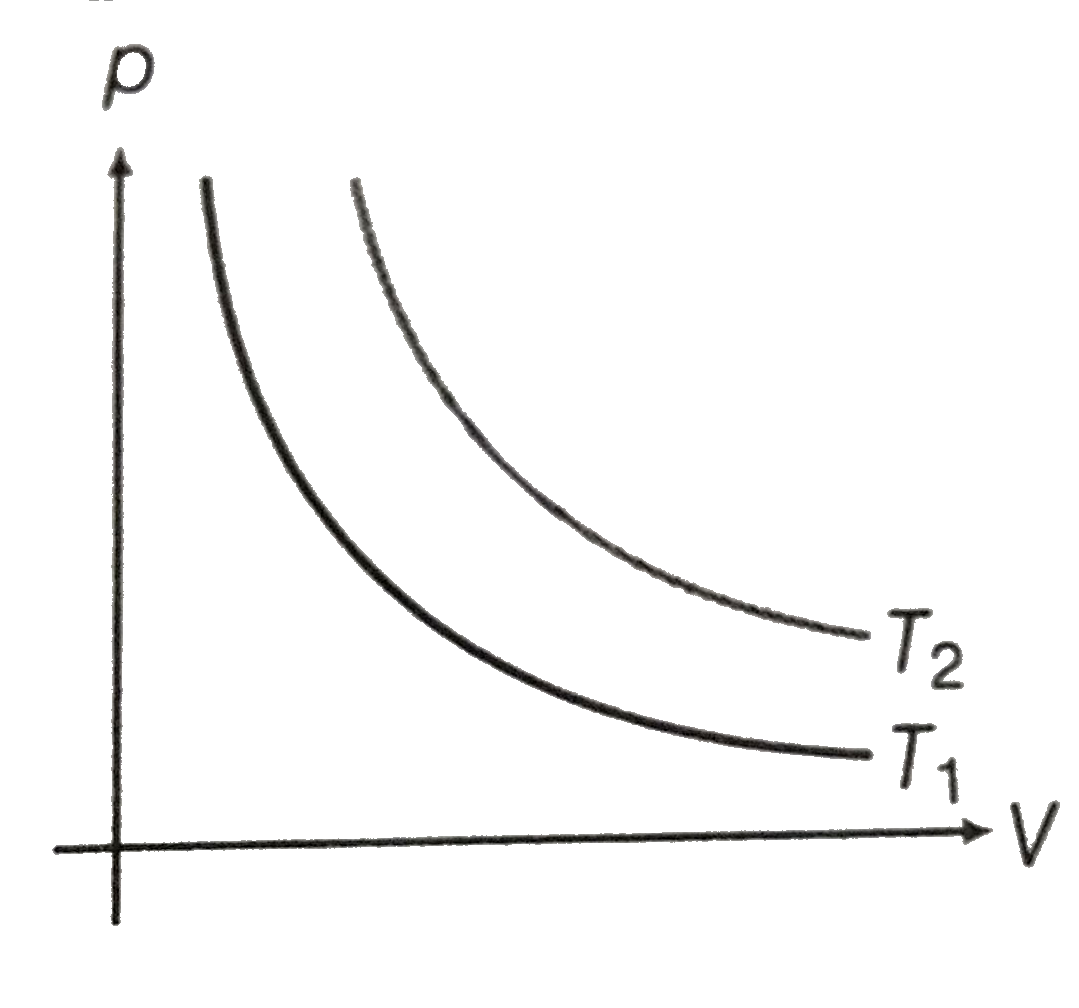
View SolutionThe p−V diagrams of same mass of a gas are drawn at two different temperatues T1 and T2 Explain whether T1>T2 or T2>T1.

View SolutionThree isothermal plots (P versus V) A, B and C are plotted at three temperature T1,T2andT3 respectively

The correct order of the temperature will be
View Solution
