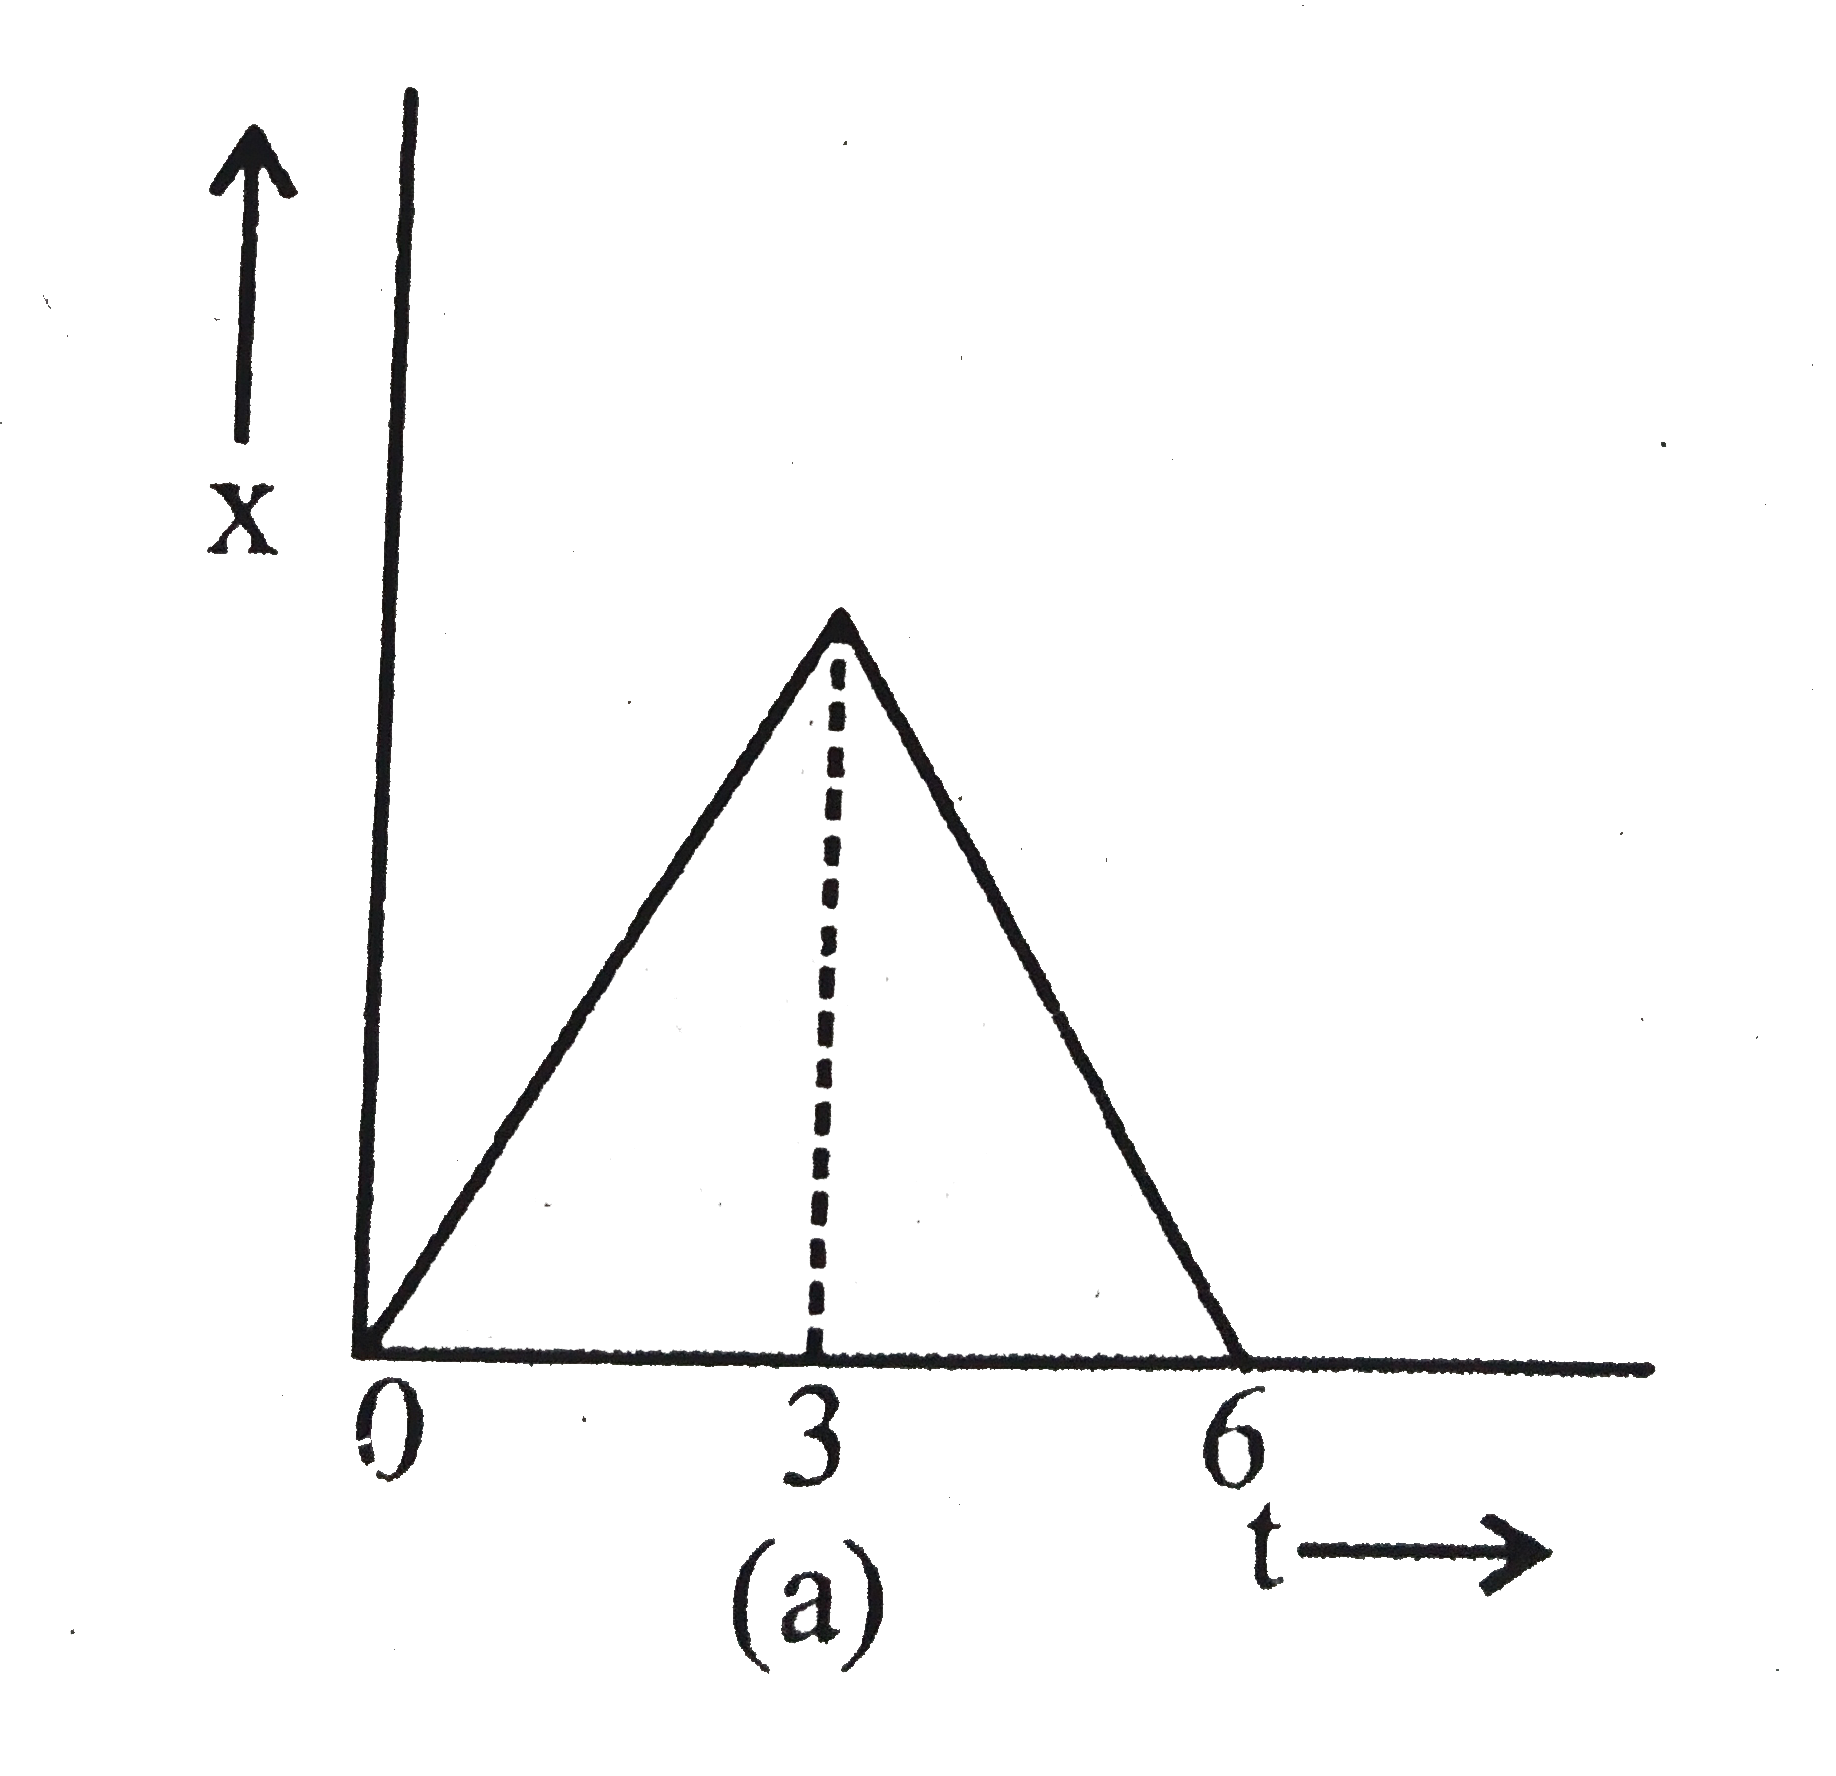
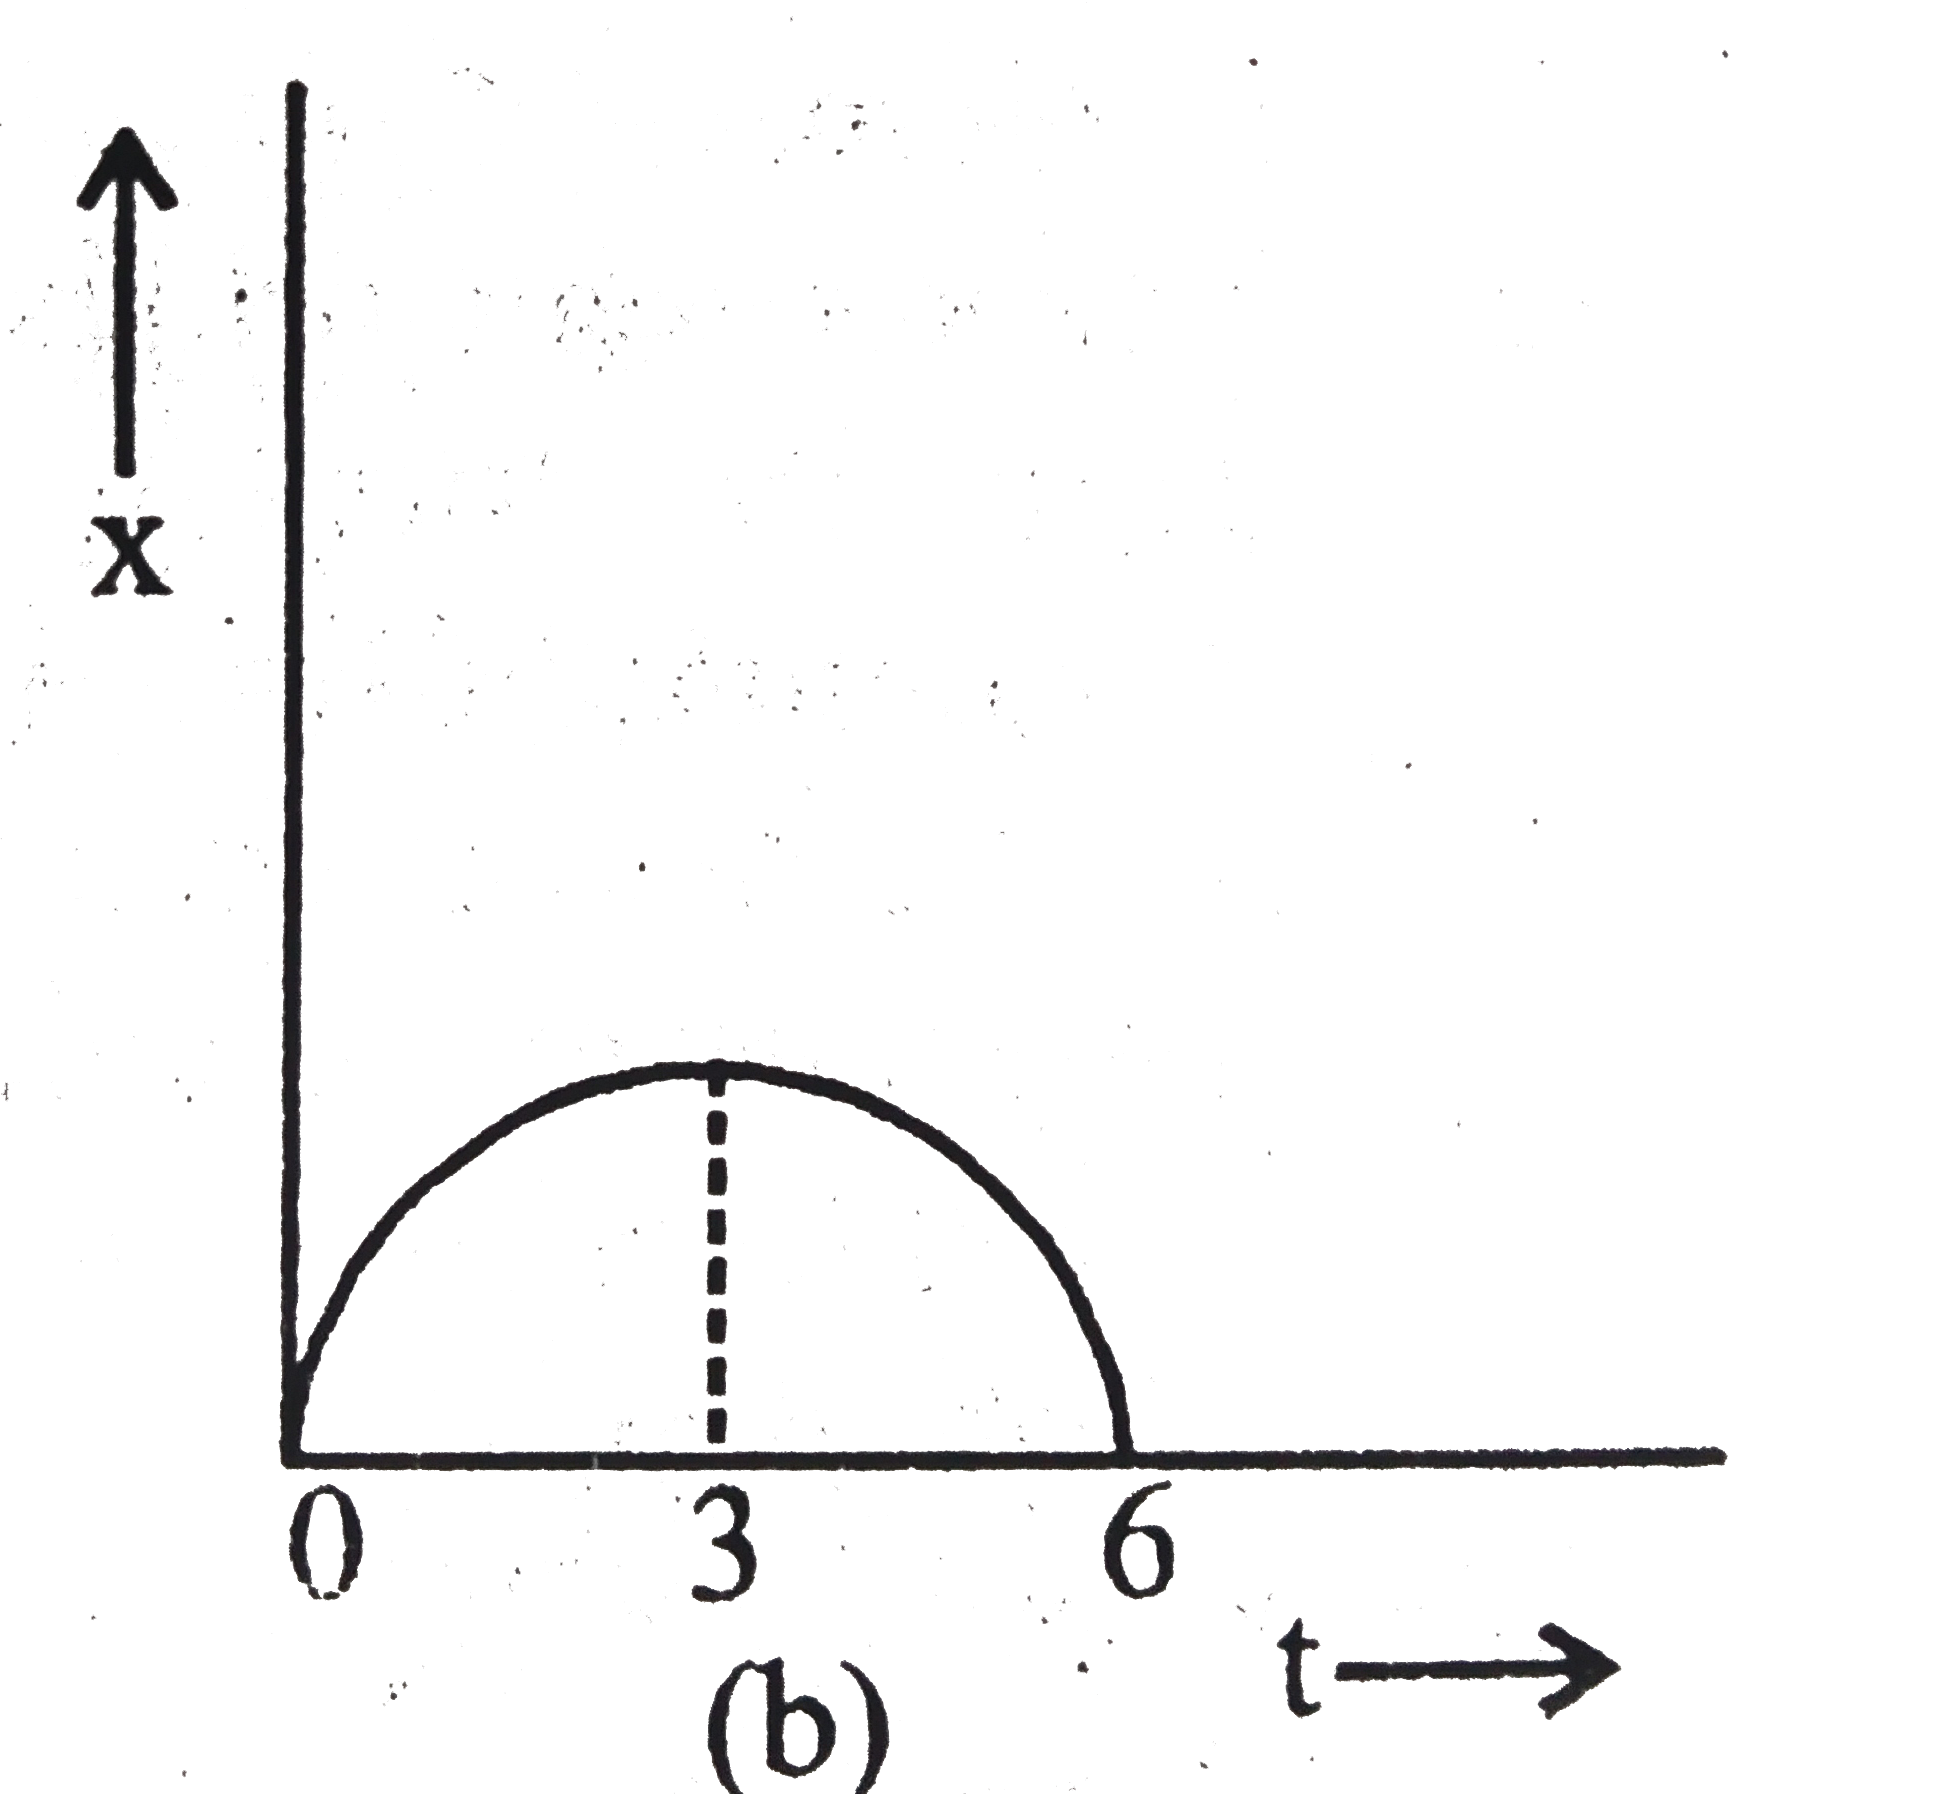
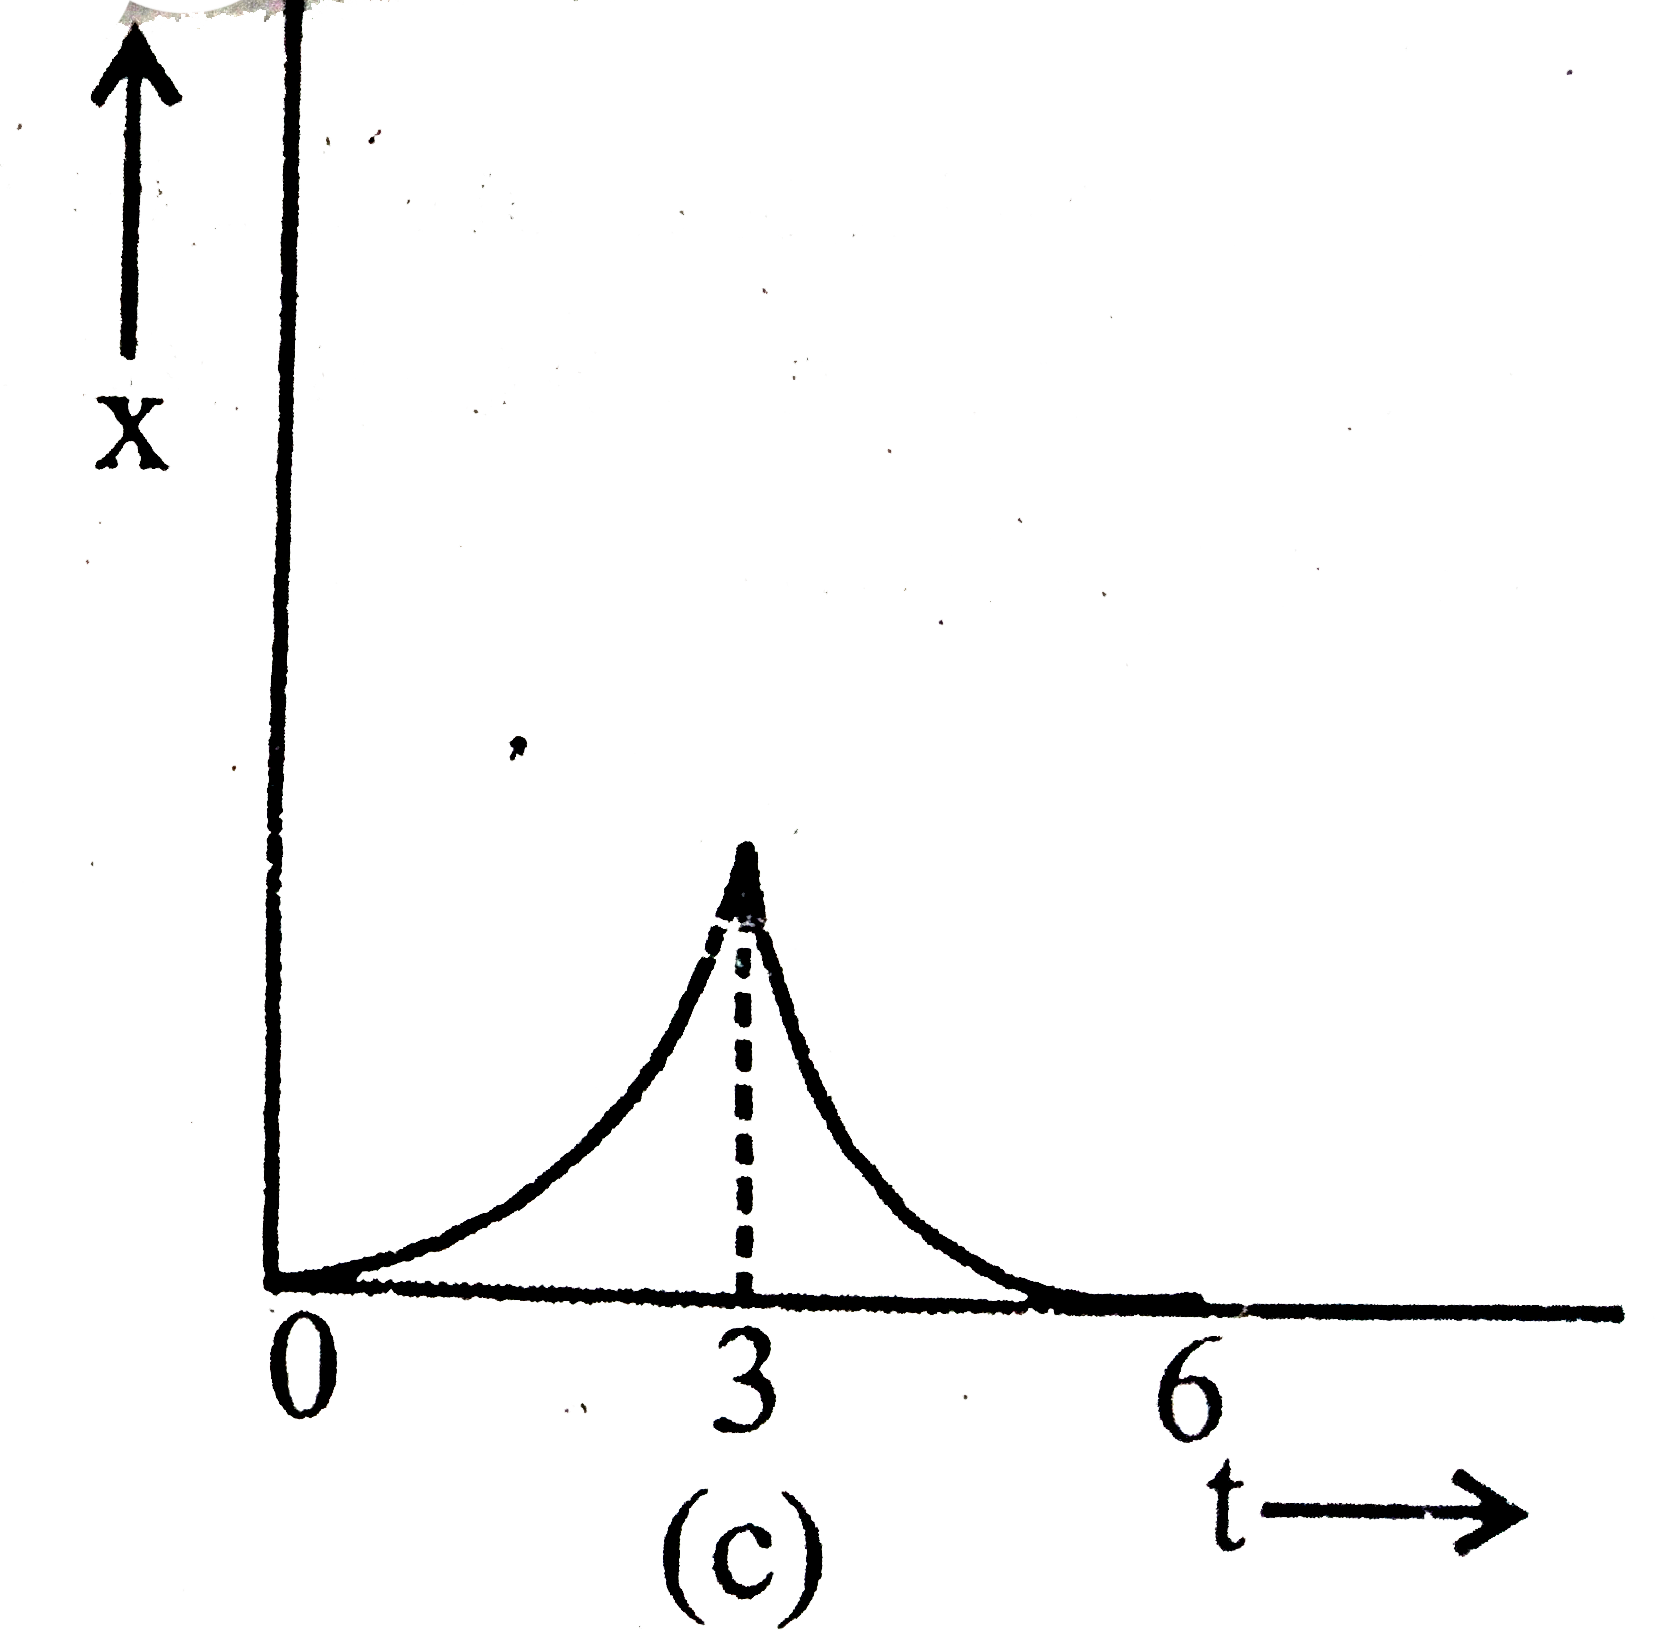
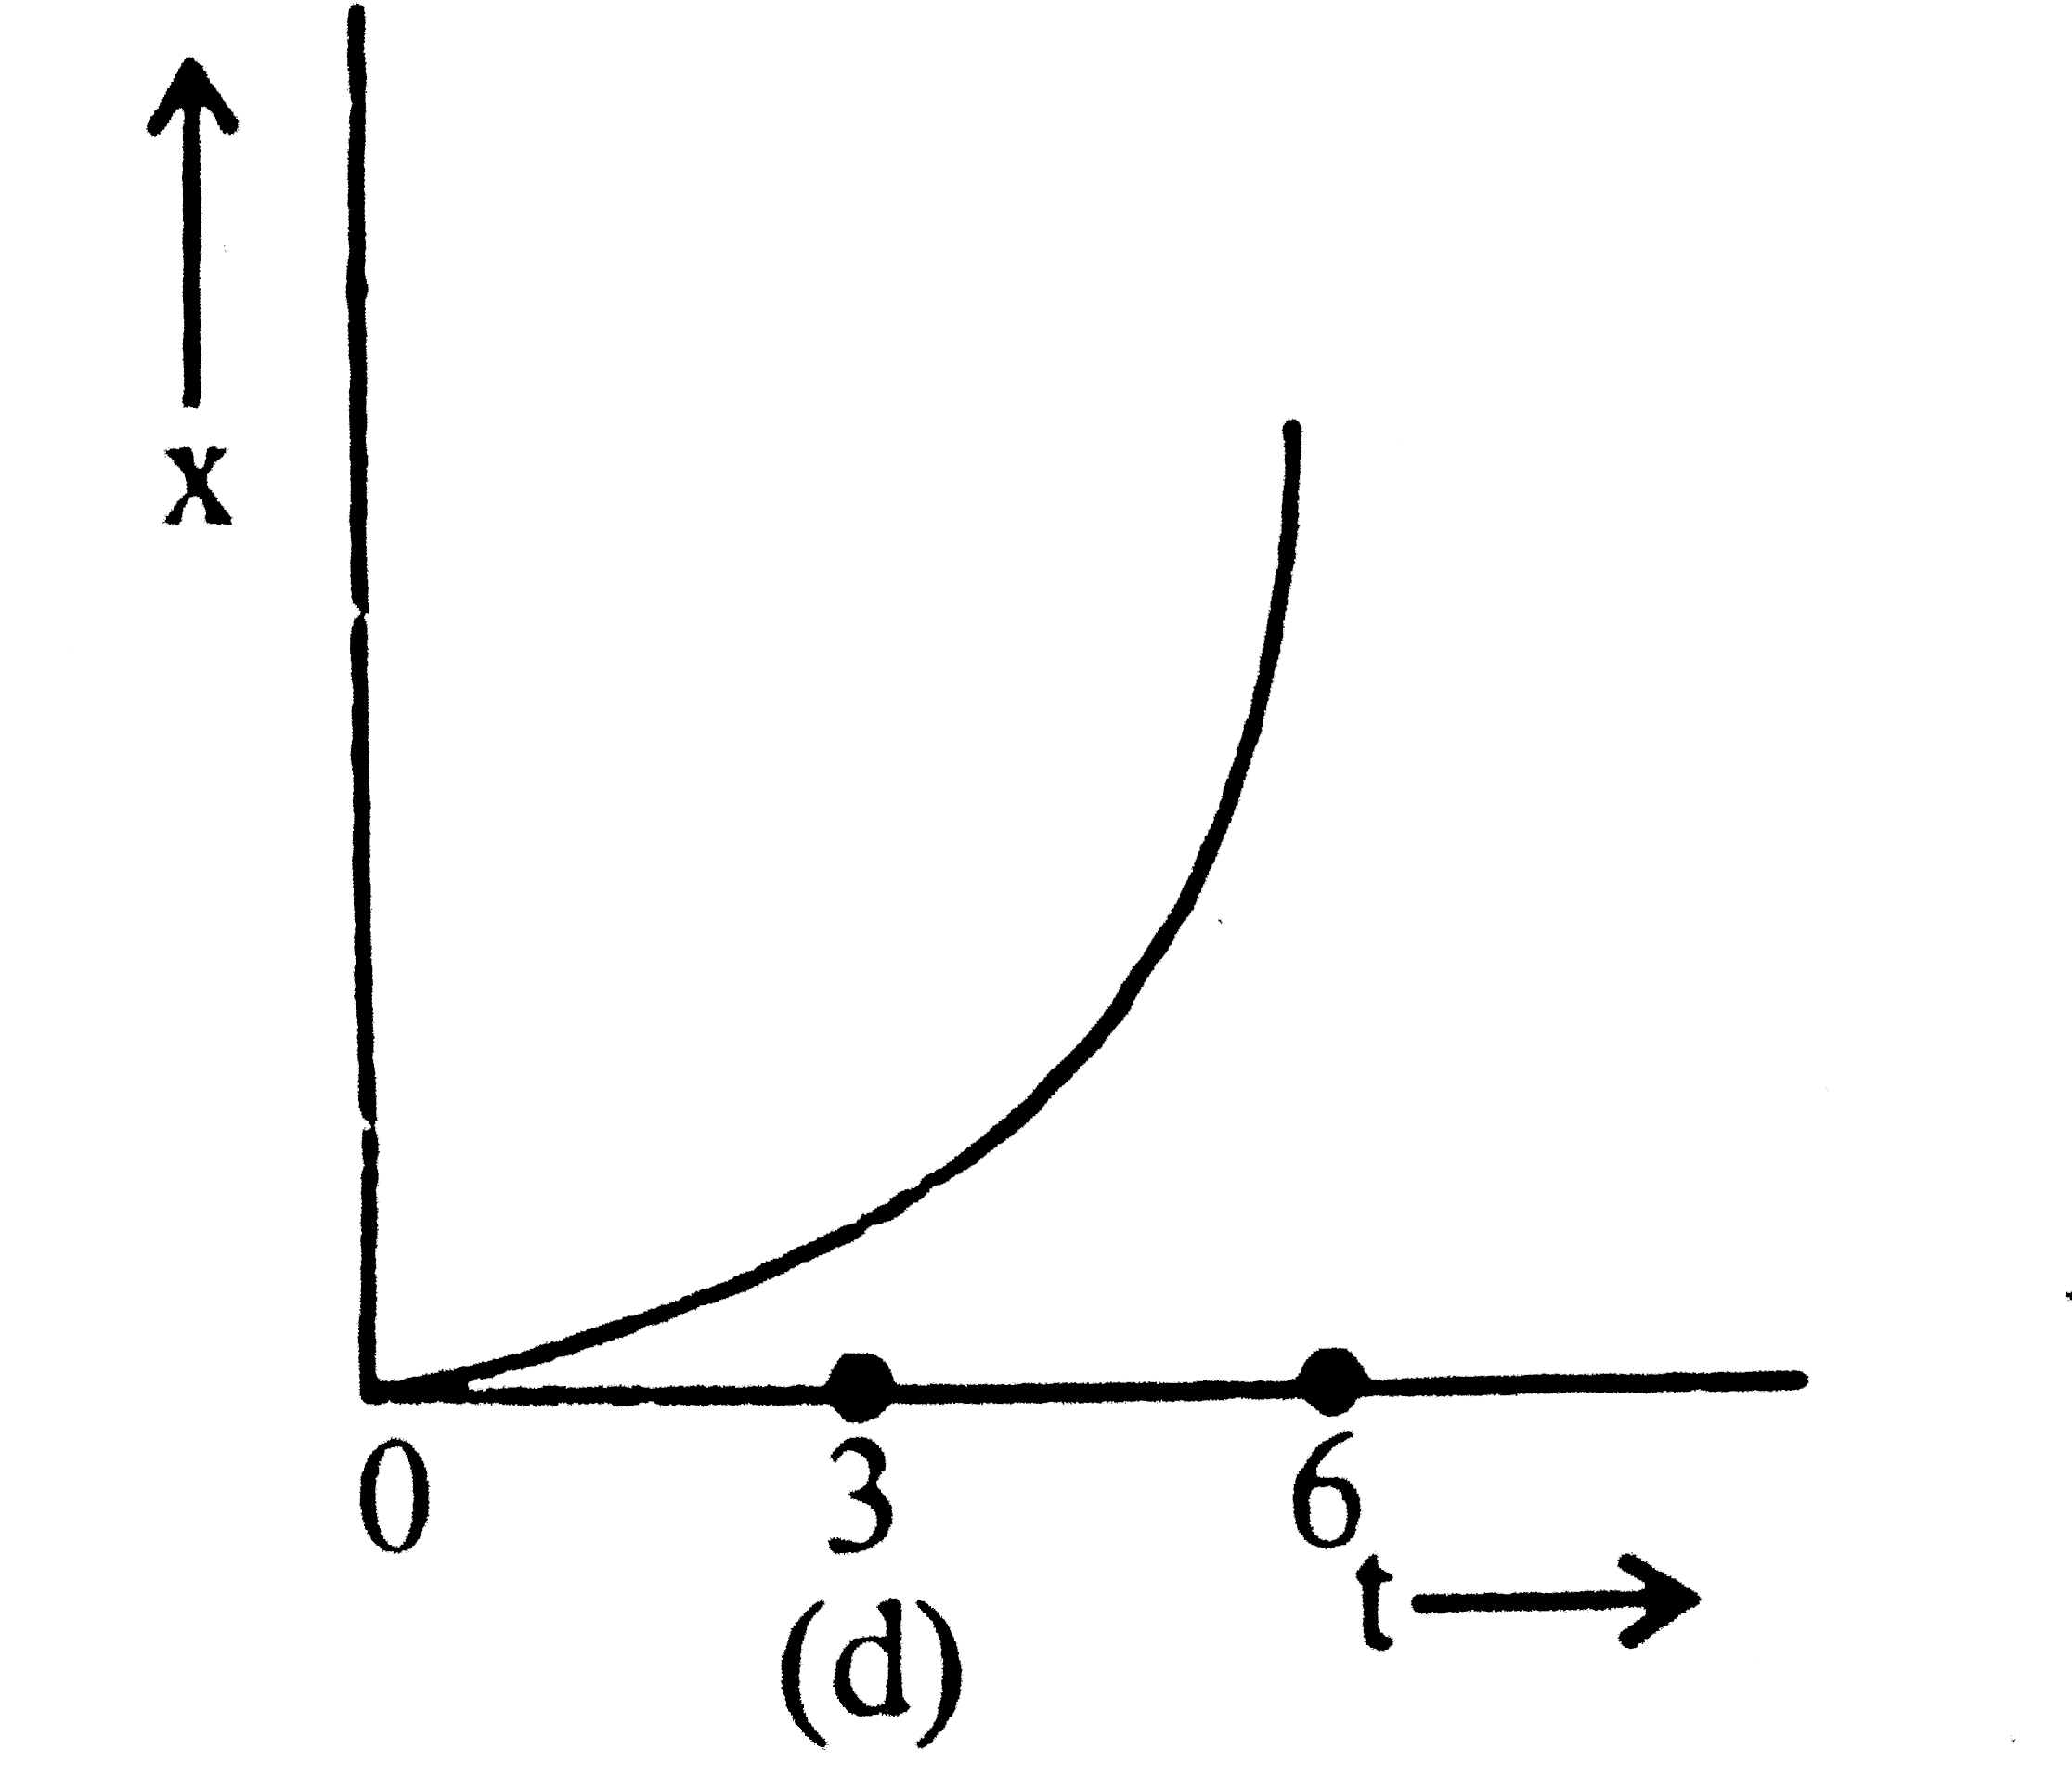
A particle starts from rest, accelerates uniformly for 3 seconds and then decelerates uniformly for 3 seconds and comes to rest. Which one of the following displacement (x)-time (t) graphs represents the motion of the particle?
The correct Answer is:C
To solve the problem, we need to analyze the motion of the particle step by step.
Step 1: Understanding the Motion
The particle starts from rest, accelerates uniformly for 3 seconds, and then decelerates uniformly for another 3 seconds until it comes to rest.
Step 2: Acceleration Phase
During the first 3 seconds, the particle accelerates from rest.
- Initial velocity (u) = 0 m/s
- Time (t) = 3 seconds
- Since the particle accelerates uniformly, we can use the equations of motion.
- The displacement (s) during this phase can be calculated using the formula:
s=ut+12at2
Here, u=0, so:
s=0+12a(3)2=9a2
- The final velocity (v) at the end of this phase can be calculated using:
v=u+at=0+3a=3a
Step 3: Deceleration Phase
In the next 3 seconds, the particle decelerates uniformly to come to rest.
- Initial velocity (u) = 3a (from the end of the first phase)
- Final velocity (v) = 0 m/s
- Time (t) = 3 seconds
- The deceleration (a') can be calculated using:
v=u+a′t⟹0=3a+a′(3)⟹a′=−a
- The displacement (s') during this phase can be calculated as:
s′=ut+12a′t2=3a(3)+12(−a)(32)=9a−9a2=9a2
Step 4: Total Displacement
The total displacement during the entire motion is:
stotal=s+s′=9a2+9a2=9a
The particle starts from rest, accelerates for 3 seconds, reaches a maximum displacement, and then decelerates for another 3 seconds, returning to rest.
Step 5: Graph Analysis
Now, we need to analyze the displacement-time (x-t) graph:
- For the first 3 seconds, the graph will be a curve that increases (since the particle is accelerating).
- For the next 3 seconds, the graph will be a curve that decreases (since the particle is decelerating).
- The graph should start at the origin (0,0) and return to the x-axis at the end of 6 seconds.
Conclusion
The correct displacement-time graph will show a curve that rises for the first 3 seconds and then falls for the next 3 seconds, forming a parabolic shape.
The particle starts from rest, accelerates uniformly for 3 seconds, and then decelerates uniformly for another 3 seconds until it comes to rest.
During the first 3 seconds, the particle accelerates from rest.
- Initial velocity (u) = 0 m/s
- Time (t) = 3 seconds
- Since the particle accelerates uniformly, we can use the equations of motion.
- The displacement (s) during this phase can be calculated using the formula:
s=ut+12at2
Here, u=0, so:
s=0+12a(3)2=9a2
- The final velocity (v) at the end of this phase can be calculated using:
v=u+at=0+3a=3a
In the next 3 seconds, the particle decelerates uniformly to come to rest.
- Initial velocity (u) = 3a (from the end of the first phase)
- Final velocity (v) = 0 m/s
- Time (t) = 3 seconds
- The deceleration (a') can be calculated using:
v=u+a′t⟹0=3a+a′(3)⟹a′=−a
- The displacement (s') during this phase can be calculated as:
s′=ut+12a′t2=3a(3)+12(−a)(32)=9a−9a2=9a2
The total displacement during the entire motion is:
stotal=s+s′=9a2+9a2=9a
The particle starts from rest, accelerates for 3 seconds, reaches a maximum displacement, and then decelerates for another 3 seconds, returning to rest.
Now, we need to analyze the displacement-time (x-t) graph:
- For the first 3 seconds, the graph will be a curve that increases (since the particle is accelerating).
- For the next 3 seconds, the graph will be a curve that decreases (since the particle is decelerating).
- The graph should start at the origin (0,0) and return to the x-axis at the end of 6 seconds.
The correct displacement-time graph will show a curve that rises for the first 3 seconds and then falls for the next 3 seconds, forming a parabolic shape.
Topper's Solved these Questions
Similar Questions
A particle starts from rest and accelerates constantly with 2m/s2 for 10 s and then retards uniformly with same rate till it comes to rest. Draw the x-t, v-t and a-t graphs.
View SolutionA particle starting from rest has a constant acceleration of 4m/s2 for 4 s. It then retards uniformly for next 8 s and comes to rest. Find during the motion of particle (a) average acceleration (b) average speed and (c) average velocity.
View Solution
Knowledge Check
A particle starting from rest travels a distance x in first 2 seconds and a distance y in next two seconds, then
Ay=xBy=2xCy=3xDy=4xA particle starts from rest with uniform acceleration and covers 26m in 7th second find its displacement in 9th sec
A38 mB34 mC32 mD30 mA particle accelerates from rest with uniform acceleration α then decelerates to rest witha constant deceleration β. Find total displacement. Given time is T
AαβT22(α+β)BαβT2α+βCαT2+βT2DαT2+βT22
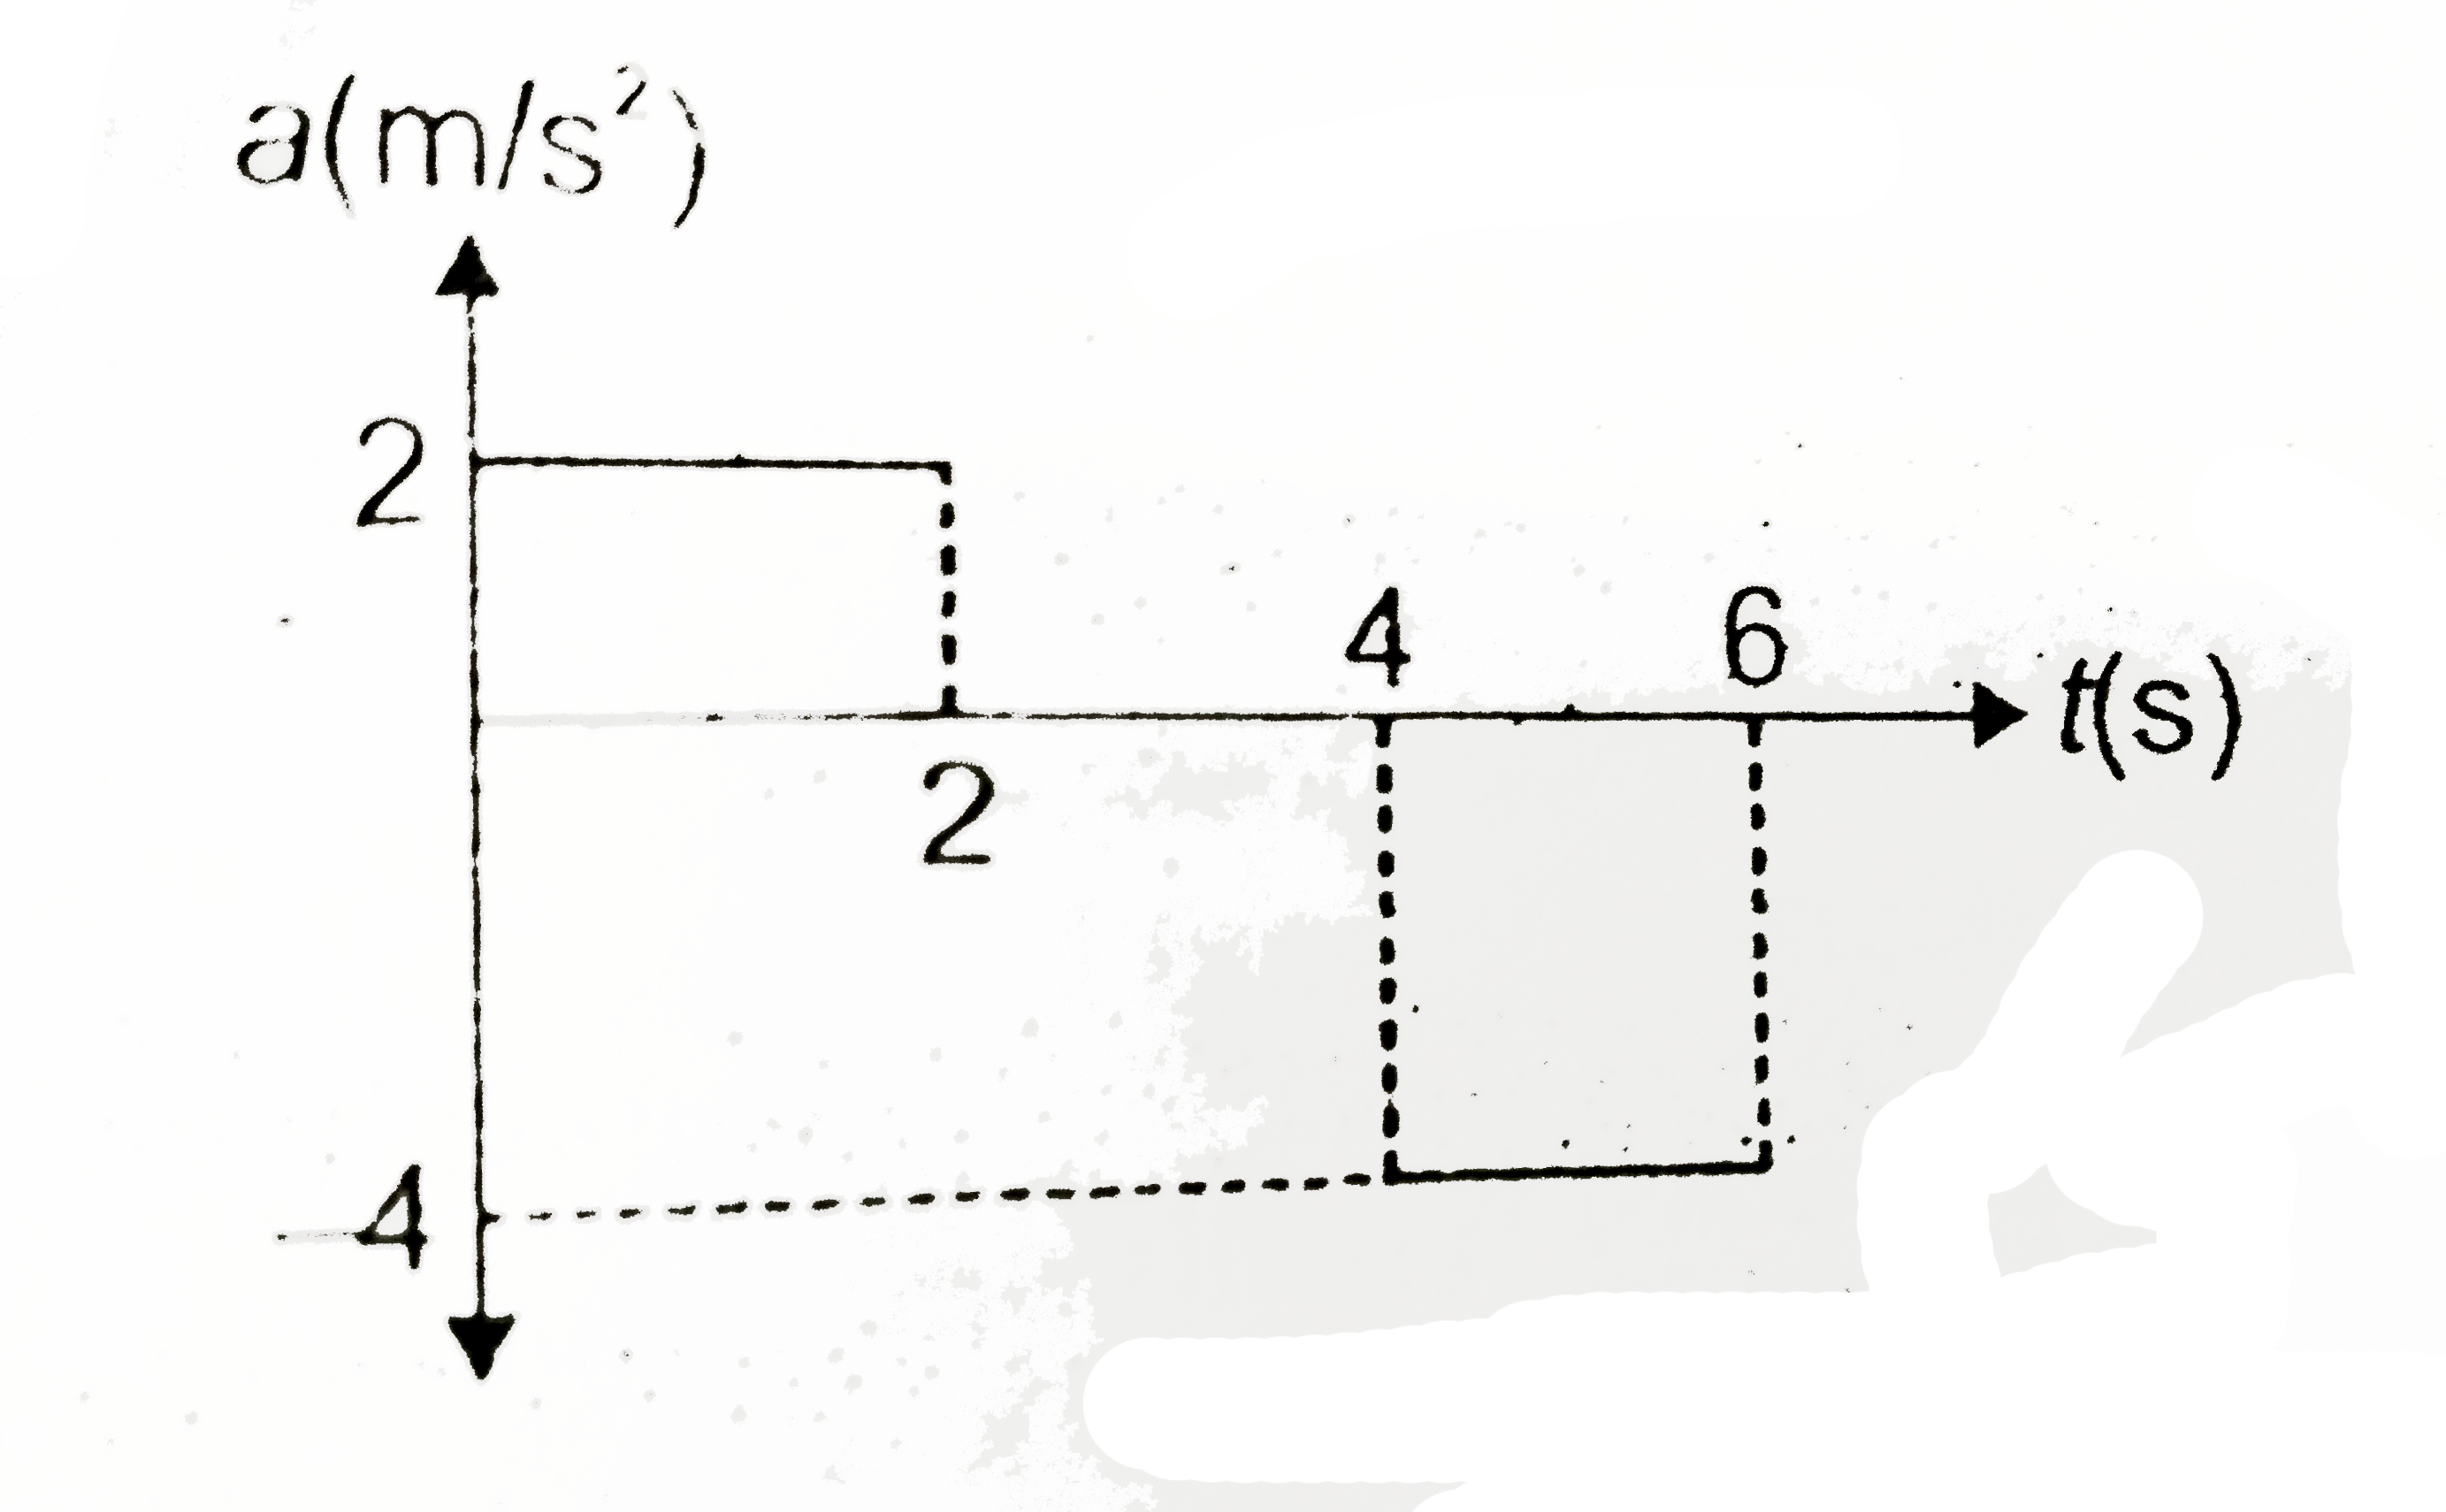
A particle starts from rest. Its acceleration is varying with time as shown in the figure. When the particle comes to rest, its distance from its starting point is
View SolutionA particle starts from rest with uniform acceleration a.Its velocity after "n" seconds is "v" .The displacement of the body in the last two seconds is:
View SolutionA car accelerates uniformly at 4 m s−2 from rest. Find its velocity at the end of 5 seconds.
View SolutionA particle starts from rest with uniform acceleration and it's velocity after n seconds is v. The displacement of the body in last two seconds is.
View SolutionA particle starts from rest with uniform acceleration a. Its velocity after 'n' second is 'v'. The displacement of the body in the last two second is
View Solution
