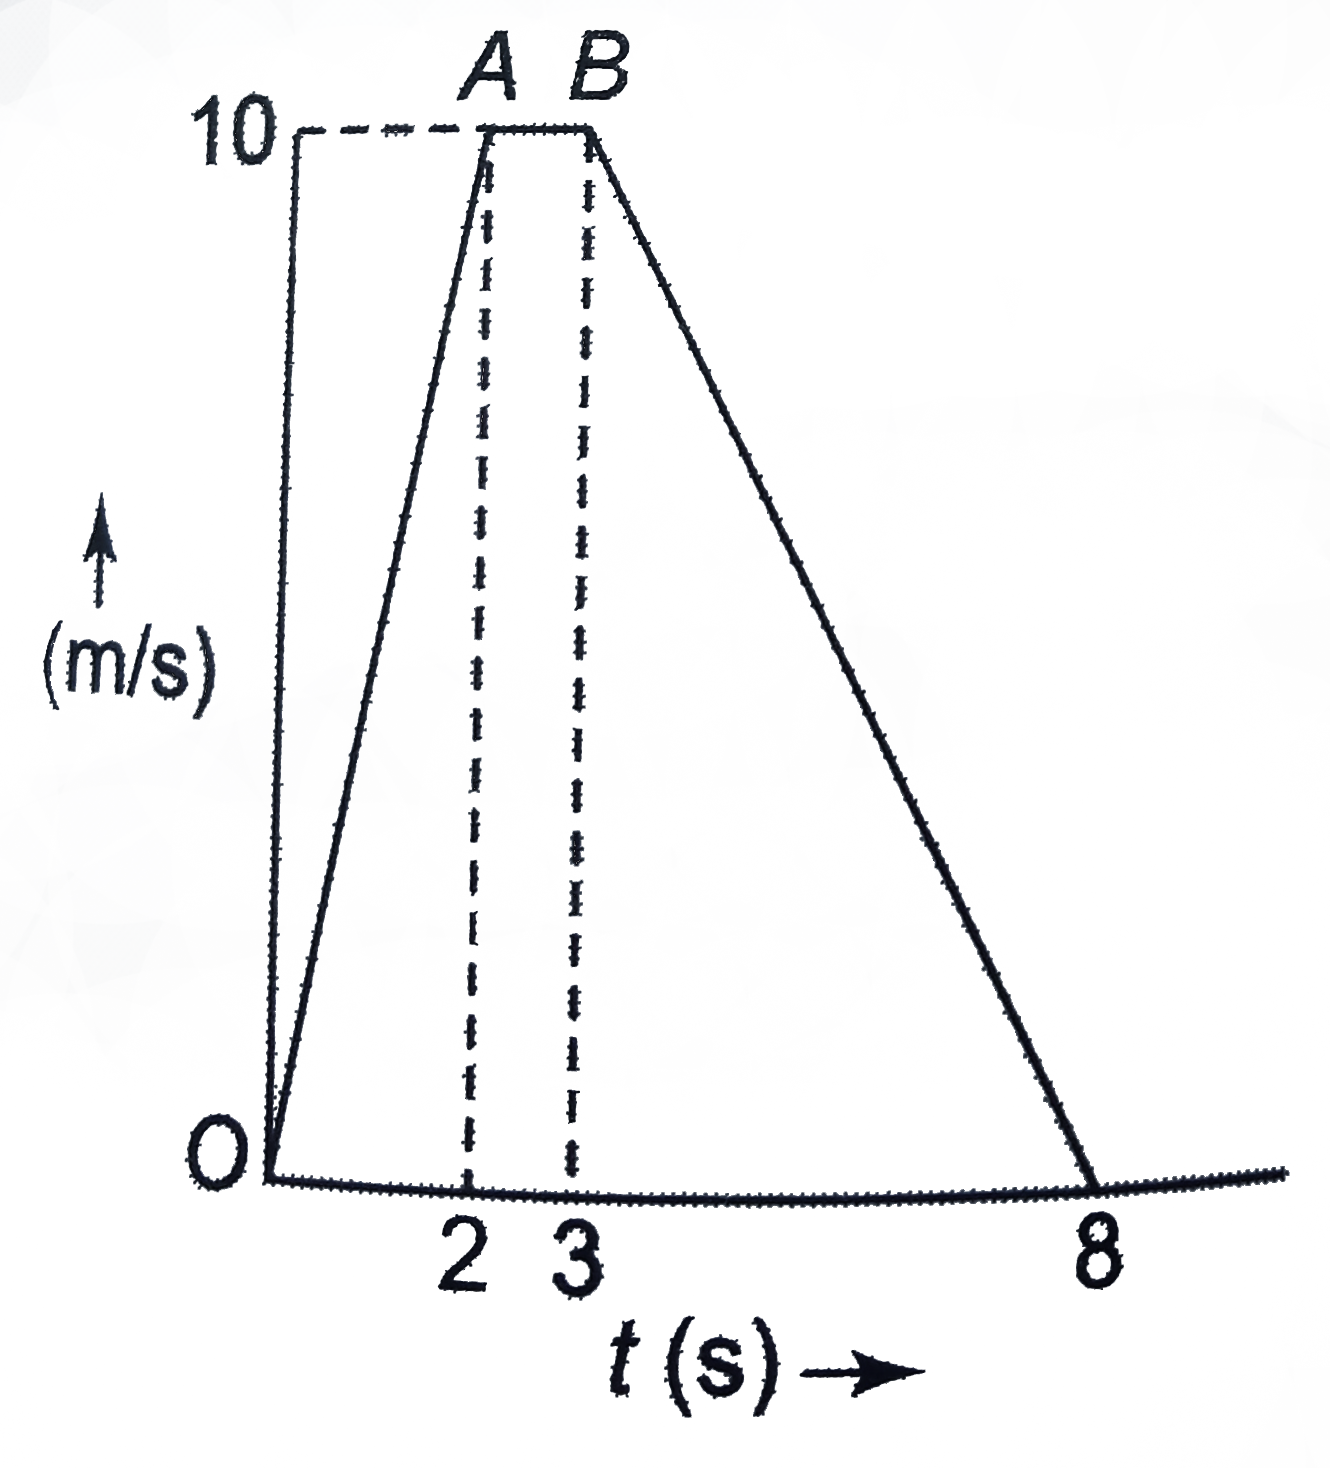
Consider the following velocity and time graph:
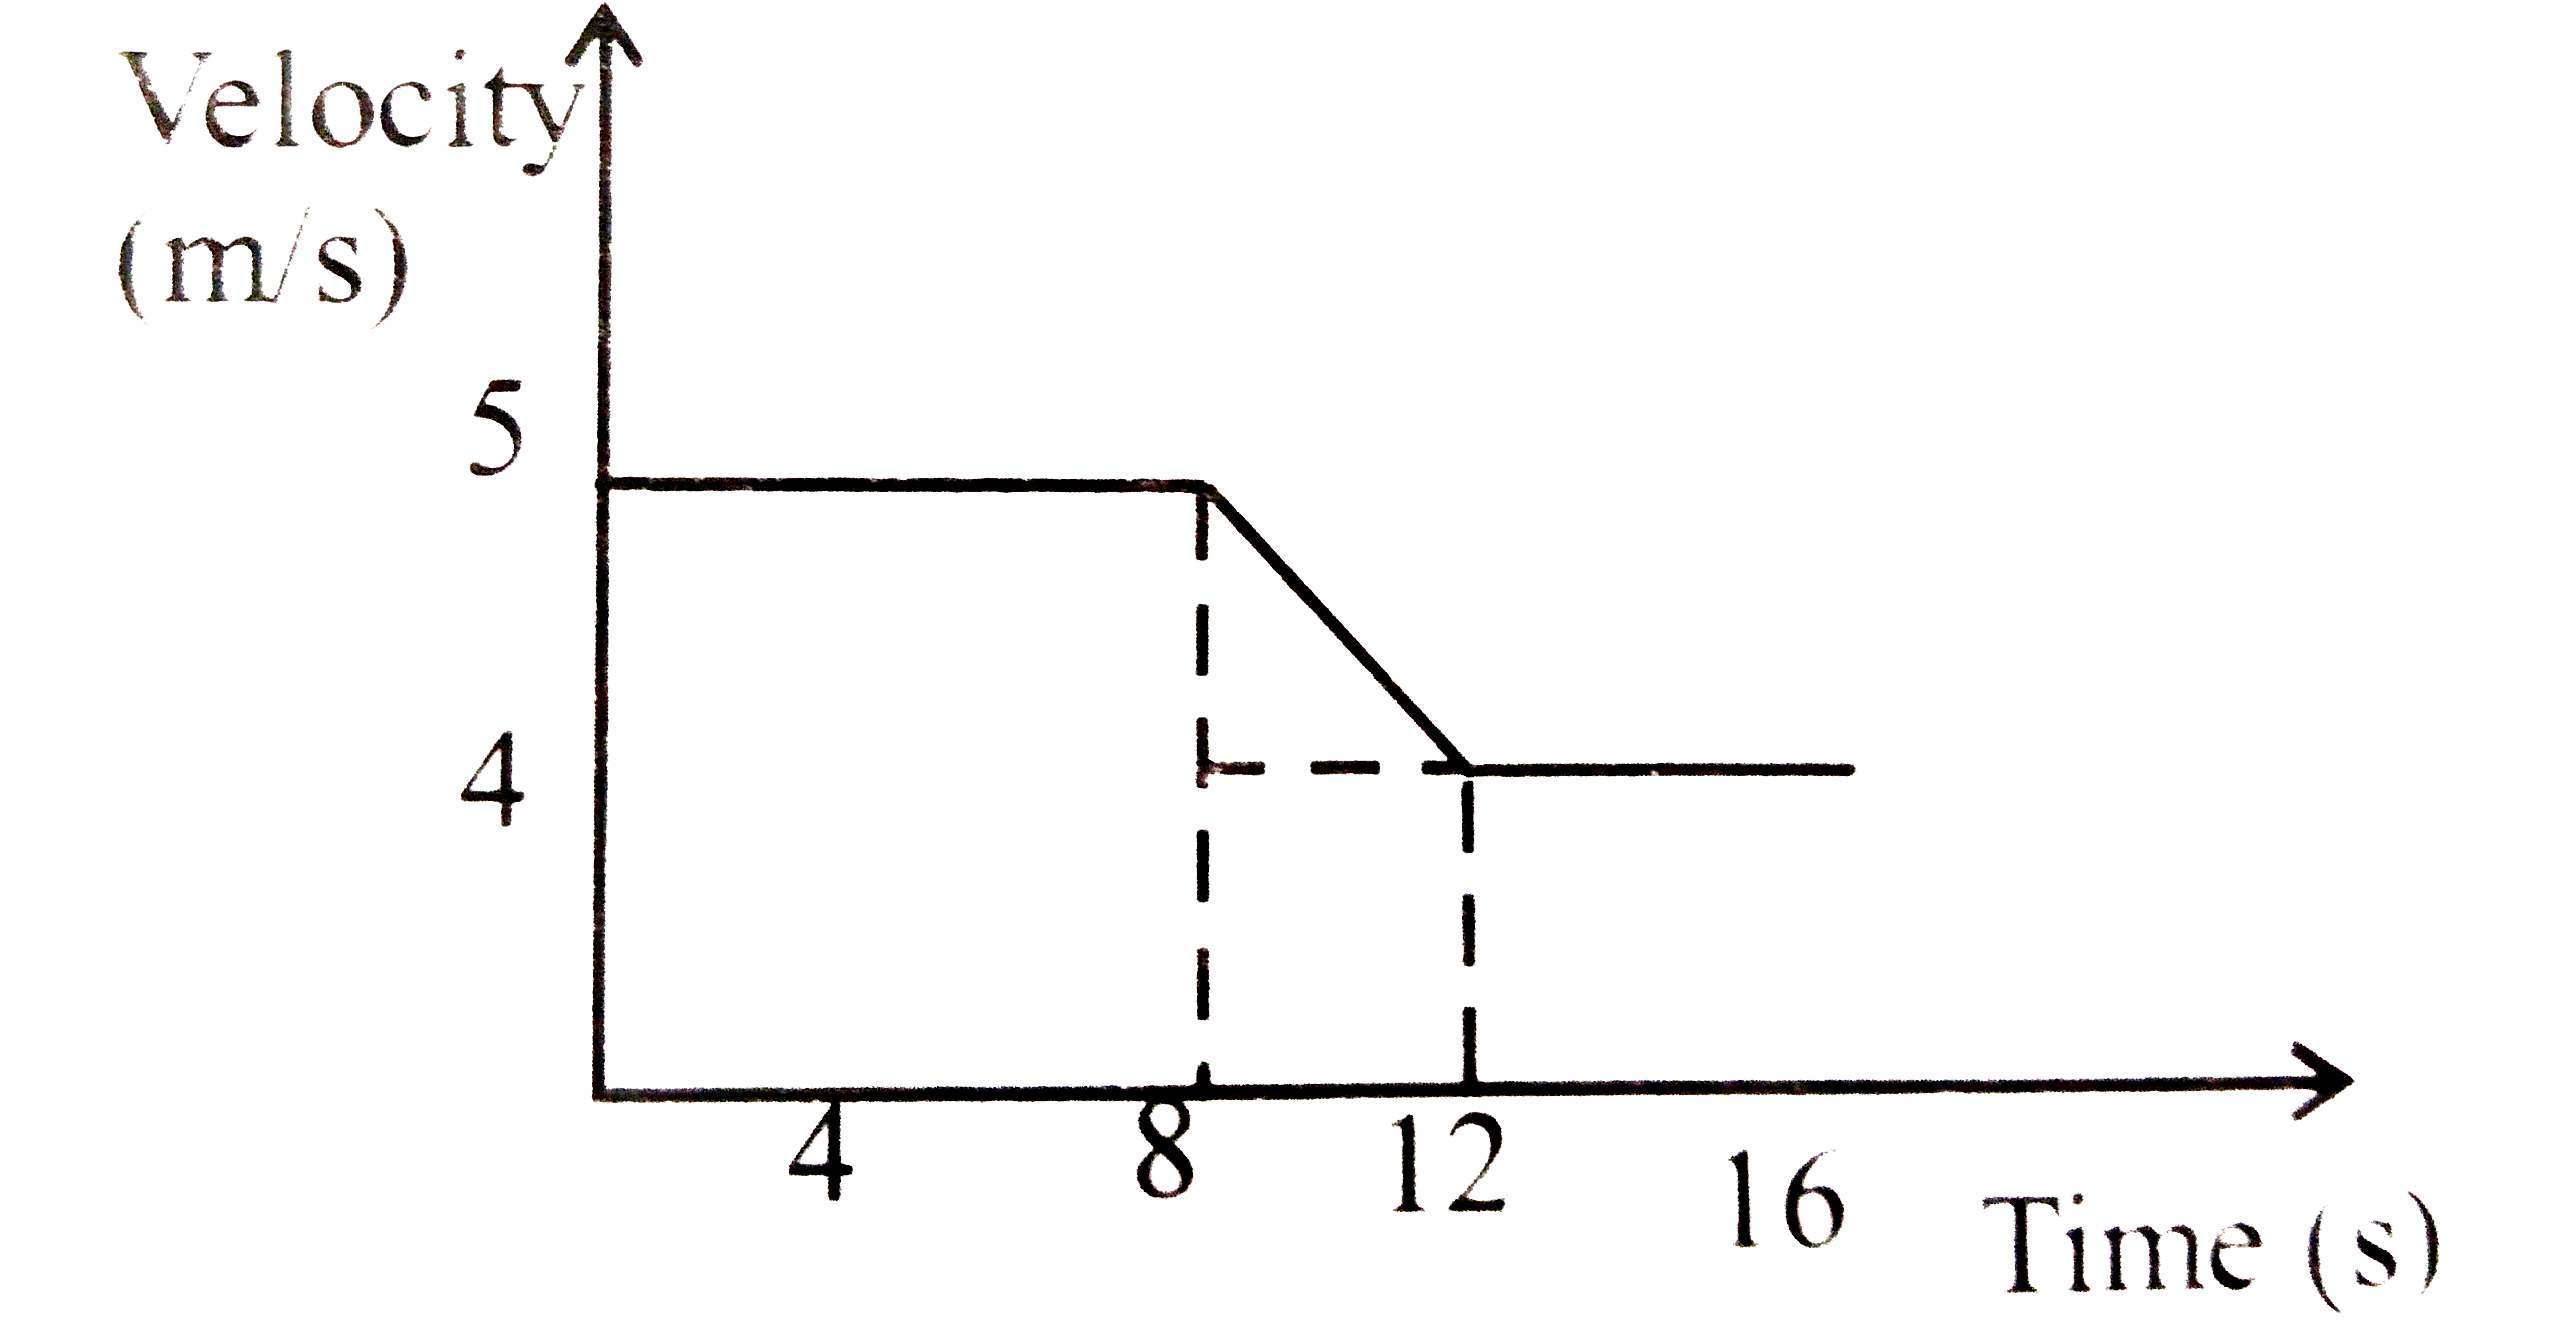
Which one of the following is the value of average acceleration from 8 s to 12 s?
The correct Answer is:D
Acceleration is defined as rate of change of velocity with time, hence,
Topper's Solved these Questions
Similar Questions
The graph below shws the velocity versus time graph for a body
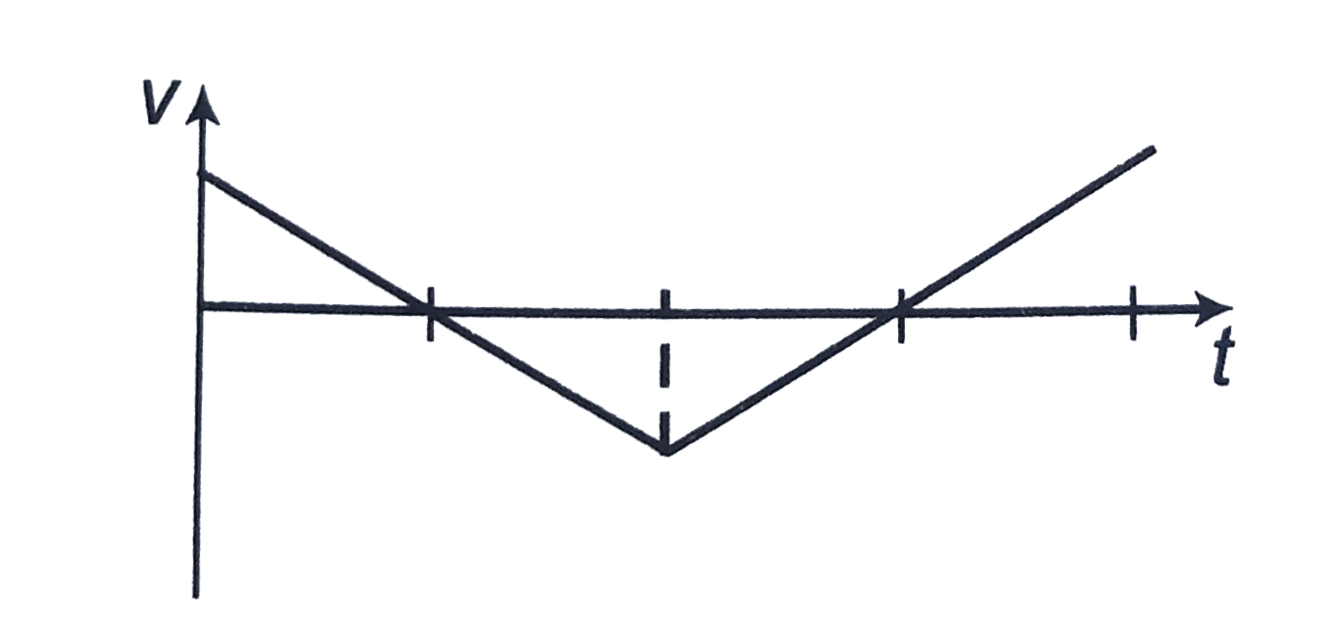
Which of the following graph represents the corresponding acceleration v//s time graph?
View SolutionThe graph shown the variation with times t of the velocity v of an object . Which one of the following graphs best represents the variation of acceleration a of the object with time t?

View Solution
Knowledge Check
The graph below shws the velocity versus time graph for a body

Which of the following graph represents the corresponding acceleration v//s time graph?A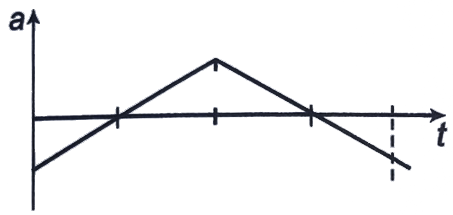 B
B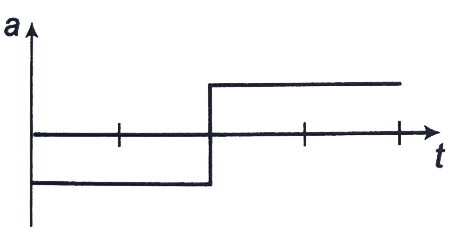 C
C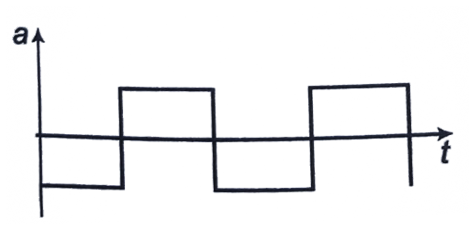 D
D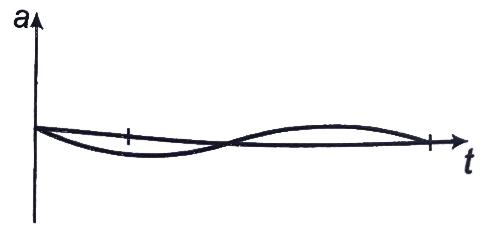
The graph shown the variation with times t of the velocity v of an object . Which one of the following graphs best represents the variation of acceleration a of the object with time t?
 A
A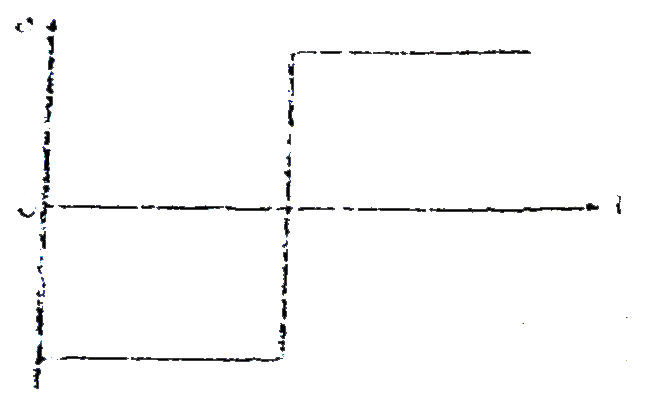 B
B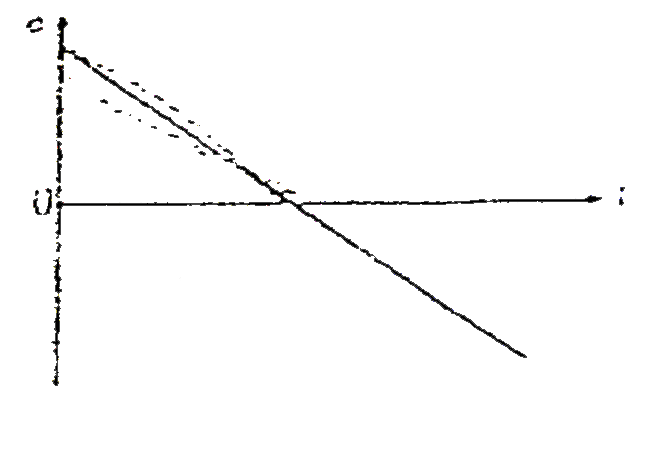 C
C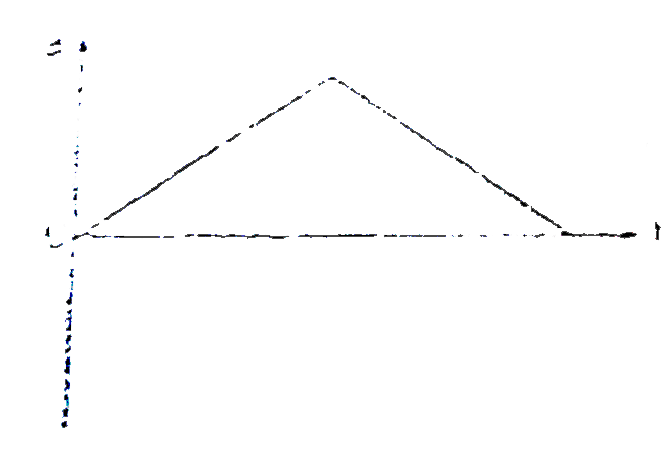 D
D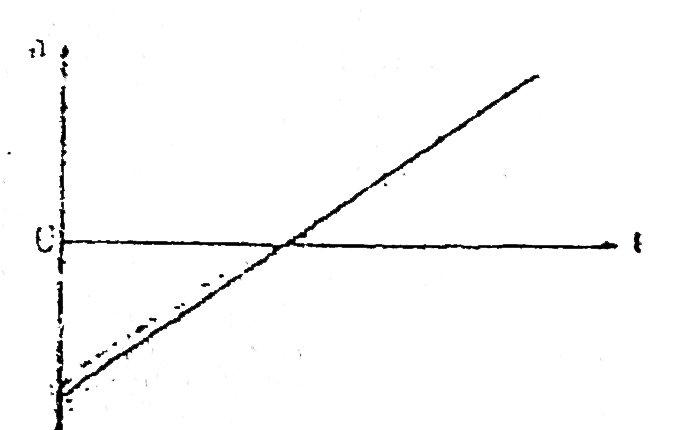
The velocity-time graph of a body is given below. Find the average velocity from t=0 to t=40s.
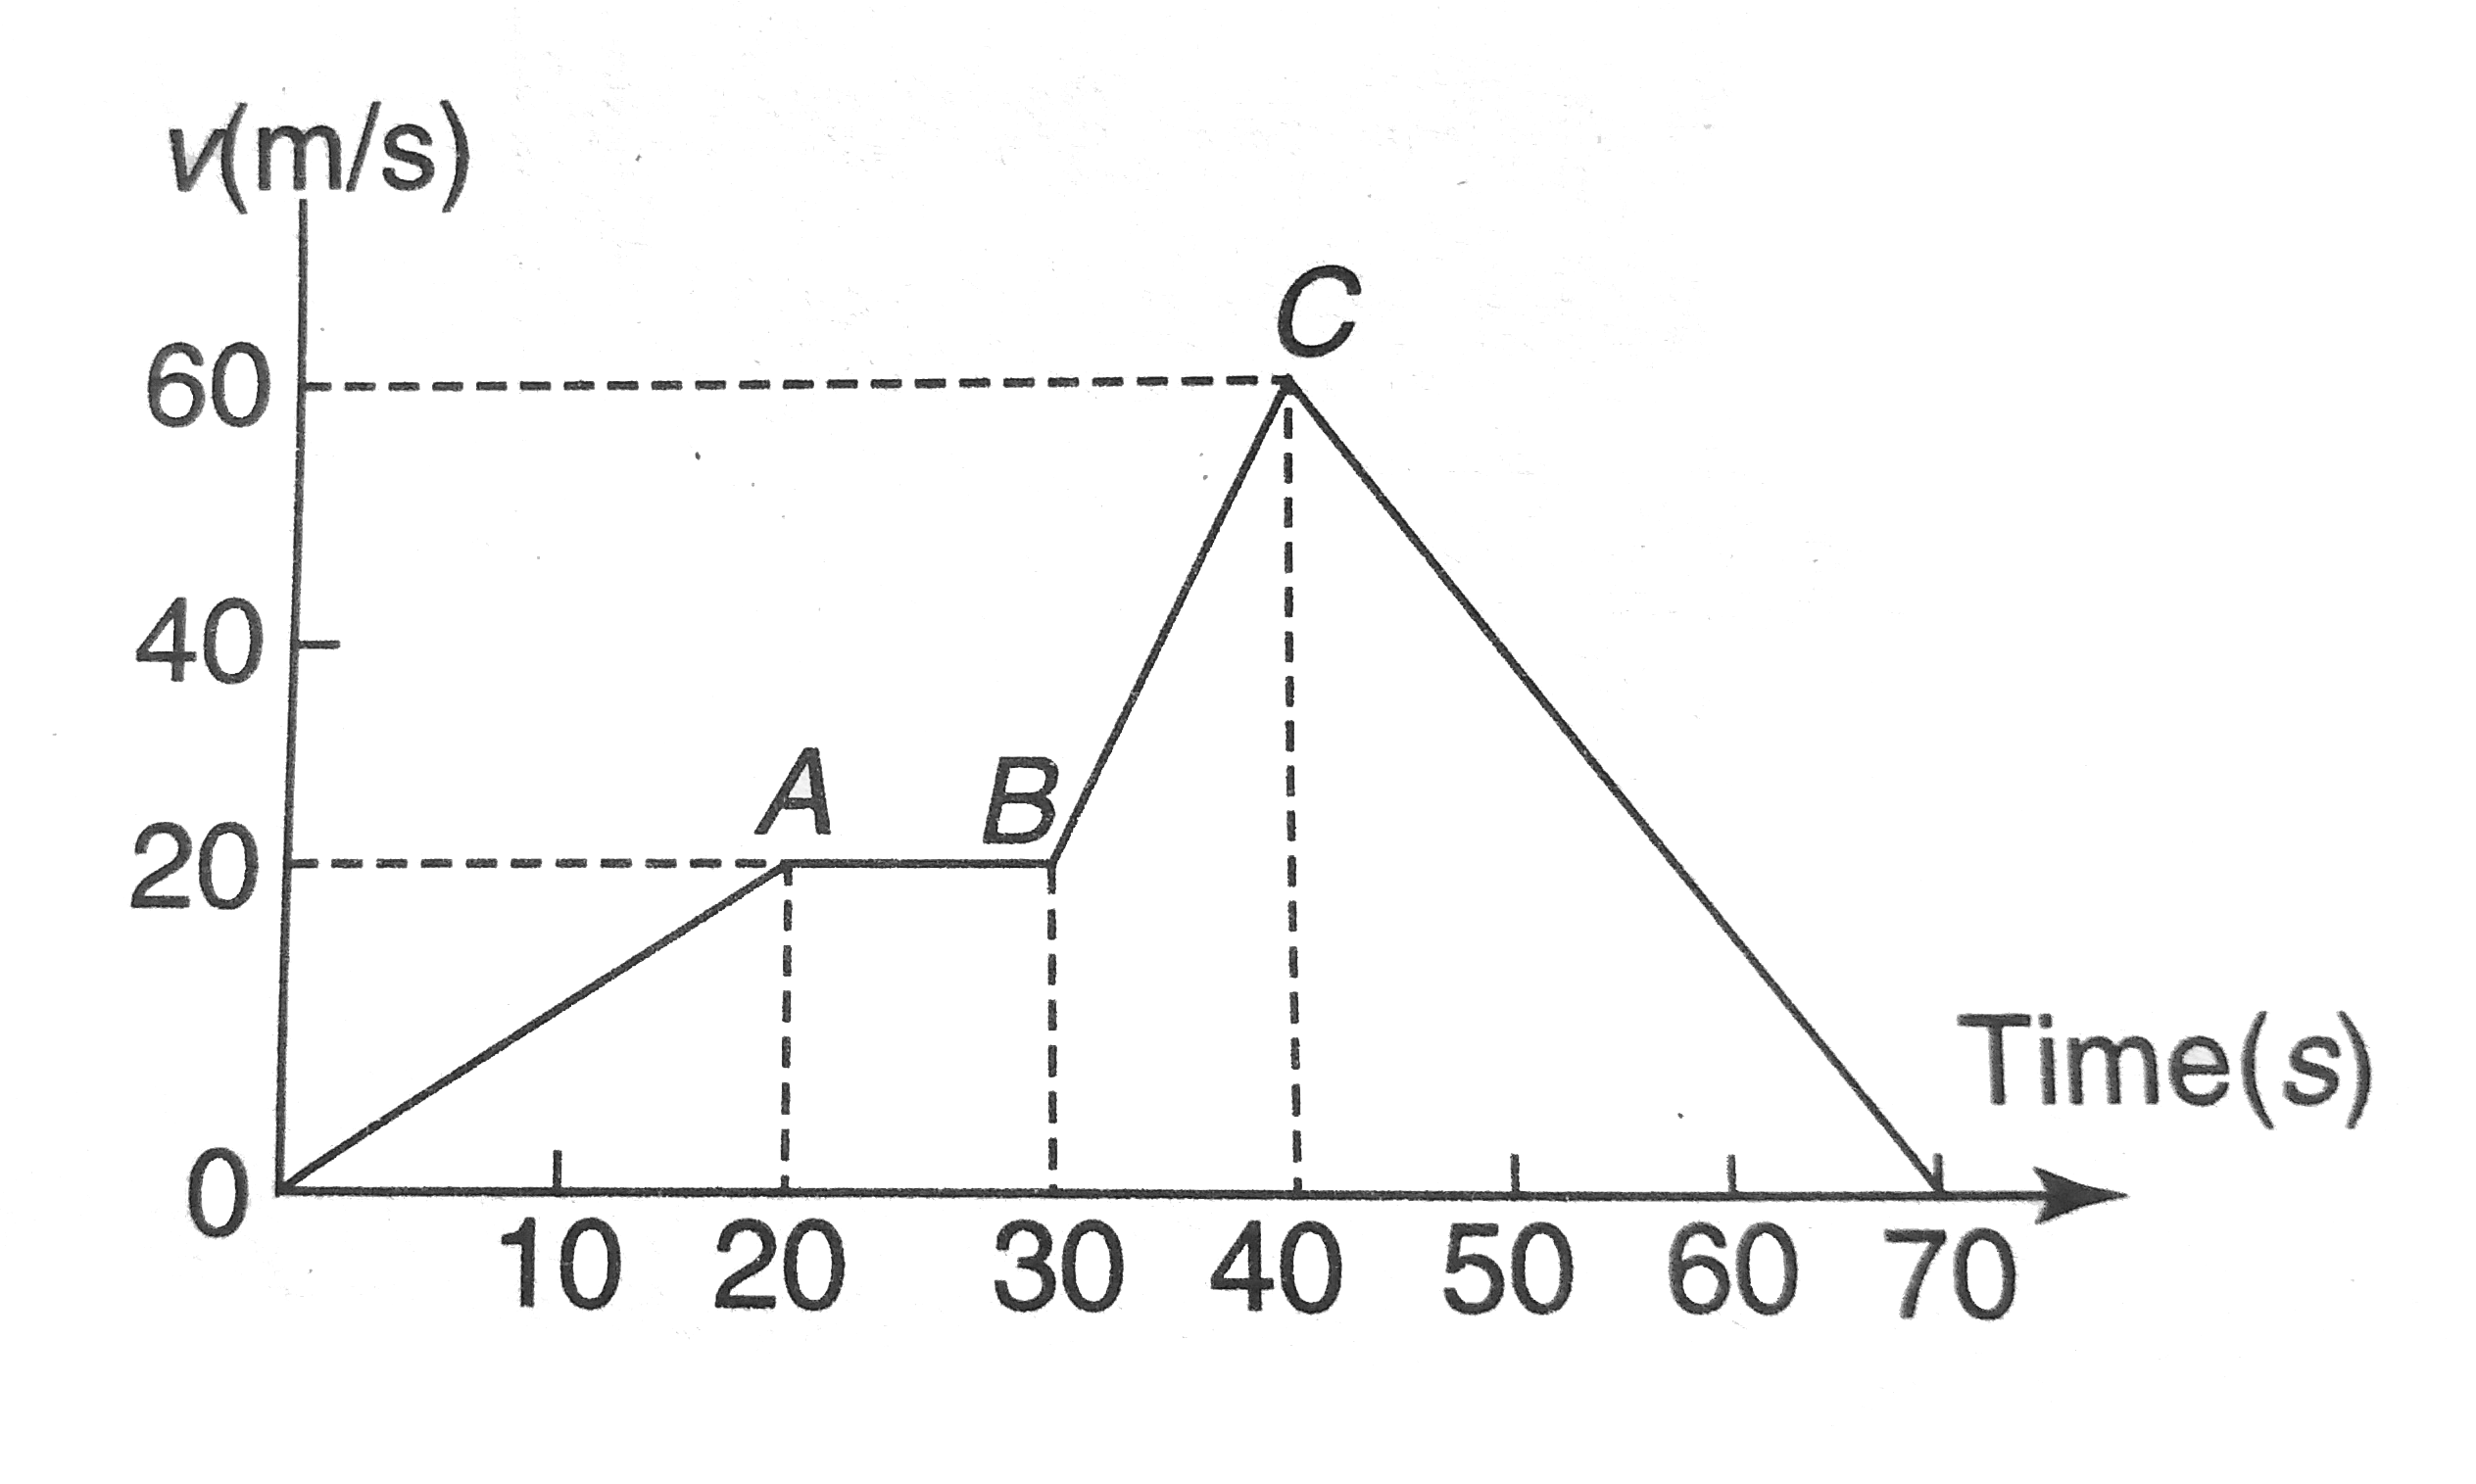 A20m/sB40m/sC50m/sD60m/s
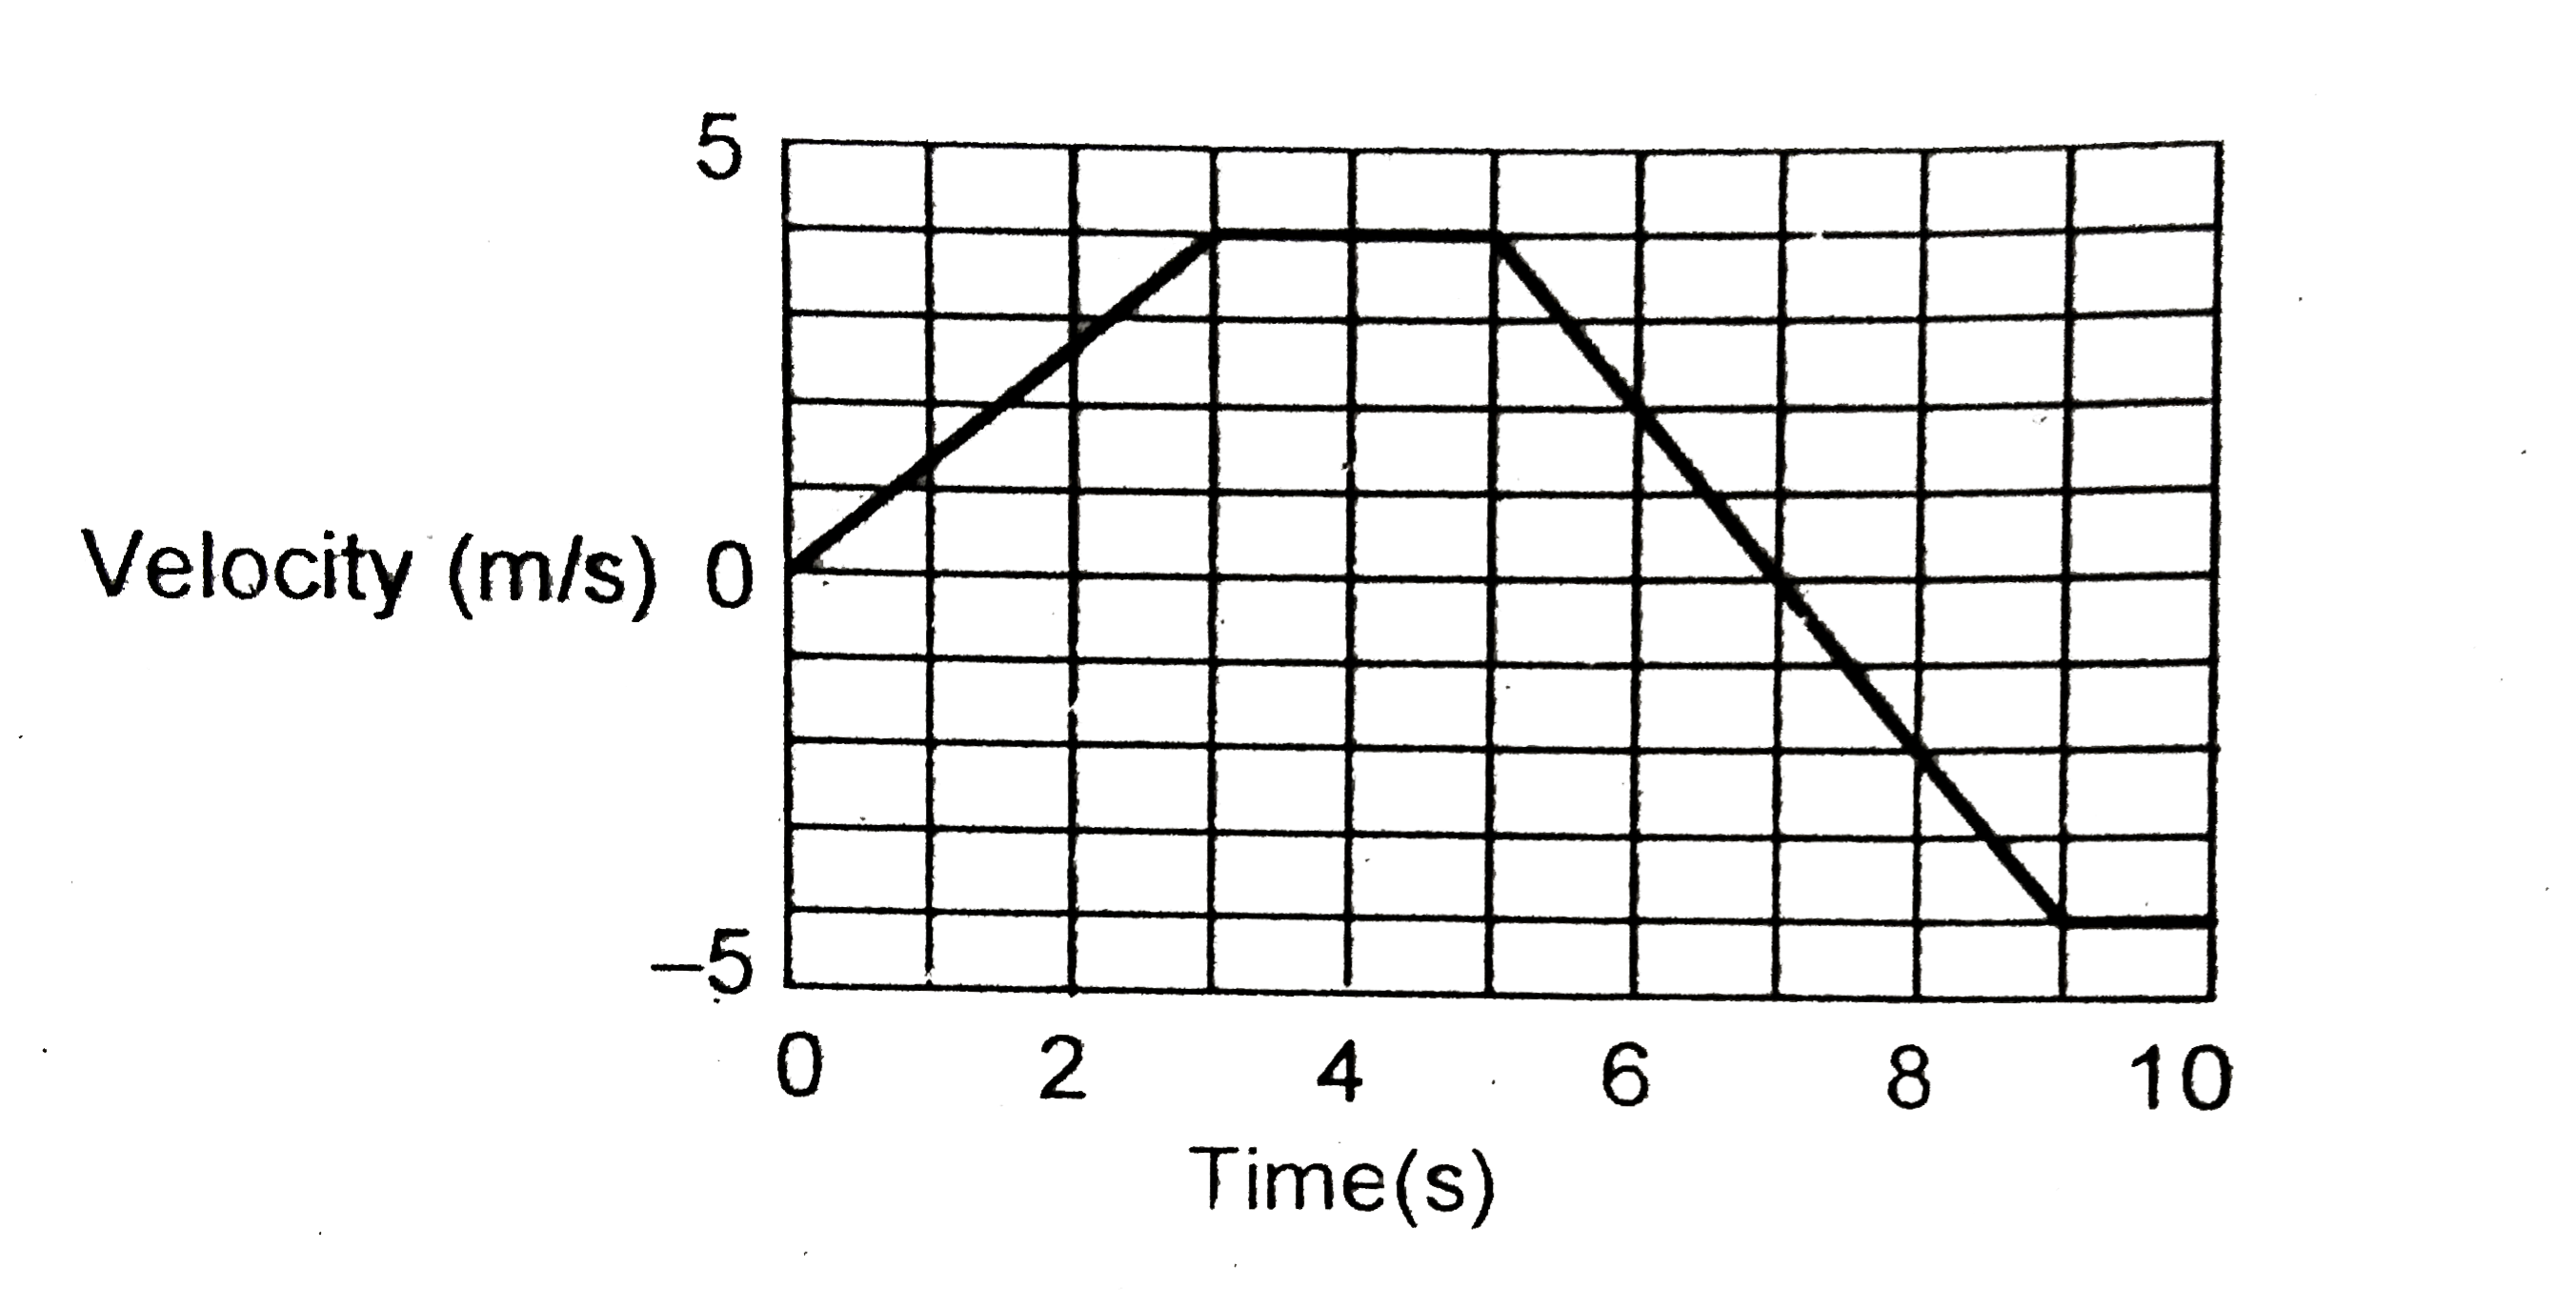
An object starts at the origin in a straight line. Its velocity versus time graph is shown in the figure. Which one of the following choices best gives the proper intervals (s) of time for which the object is moving away from the origin?
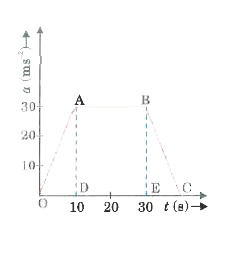
View SolutionFrom the adjoining acceleration-time graph for a particle, find the average acceleration in initial 30s.
View SolutionFor a particle moving in a straight line, the velocity-time graph is as shown in the figure. Find the acceleration at time t=1s2.5s and 5s. Sketch the acceleration time graph.
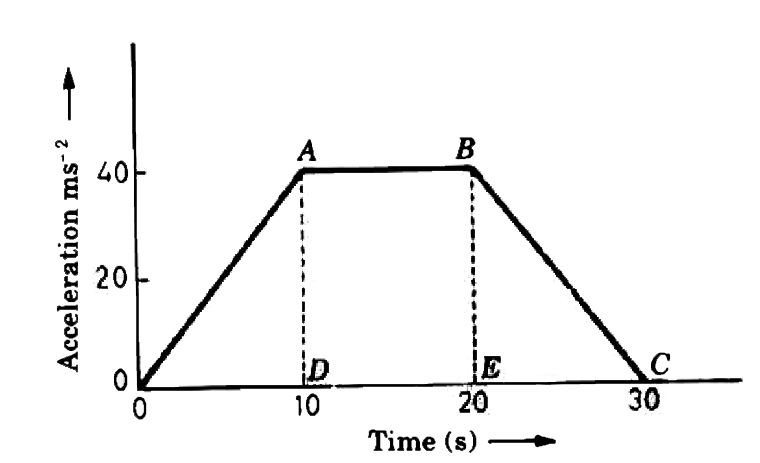
View SolutionFig. 3.39 shows the acceleration - time graph for a particle in rectilinear motion. Find the average acceleration in first 20 s.
View Solution
An object starts at the origin in a straight line. Its velocity versus time graph is shown in the figure. Which one of the following choices best gives the proper intervals (s) of time for which the object is moving away from the origin?
View Solution
