Draw a graph representing the change in specific resistance with temperature.
Drift velocity, Vd=eVτml=eEτm
Topper's Solved these Questions
- CURRENT ELECTRICITYBook:MODERN PUBLICATIONChapter:CURRENT ELECTRICITYExercise:REVISION EXERCISES (ADDITIONAL QUESTIONS)
Explore 11 Videos
- CURRENT ELECTRICITYBook:MODERN PUBLICATIONChapter:CURRENT ELECTRICITYExercise:REVISION EXERCISES (FILL IN THE BLANKS)
Explore 10 Videos
- CURRENT ELECTRICITYBook:MODERN PUBLICATIONChapter:CURRENT ELECTRICITYExercise:HIGHER ORDER THINKING SKILLS & ADVANCED LEVEL
Explore 10 Videos
- ATOMS Book:MODERN PUBLICATIONChapter:ATOMS Exercise:Chapter Practice Test
Explore 16 Videos
- DUAL NATURE OF RADIATION AND MATTER Book:MODERN PUBLICATIONChapter:DUAL NATURE OF RADIATION AND MATTER Exercise:CHAPTER PRACTICE TEST
Explore 15 Videos
Similar Questions
Knowledge Check
which of the following graph represents the variation of resistivity (ρ) with temperature (T) for copper?
A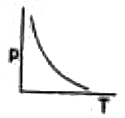 B
B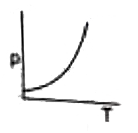 C
C D
D
Which one of the following graphs represents variation of specific heat capacity of water with temperature?
A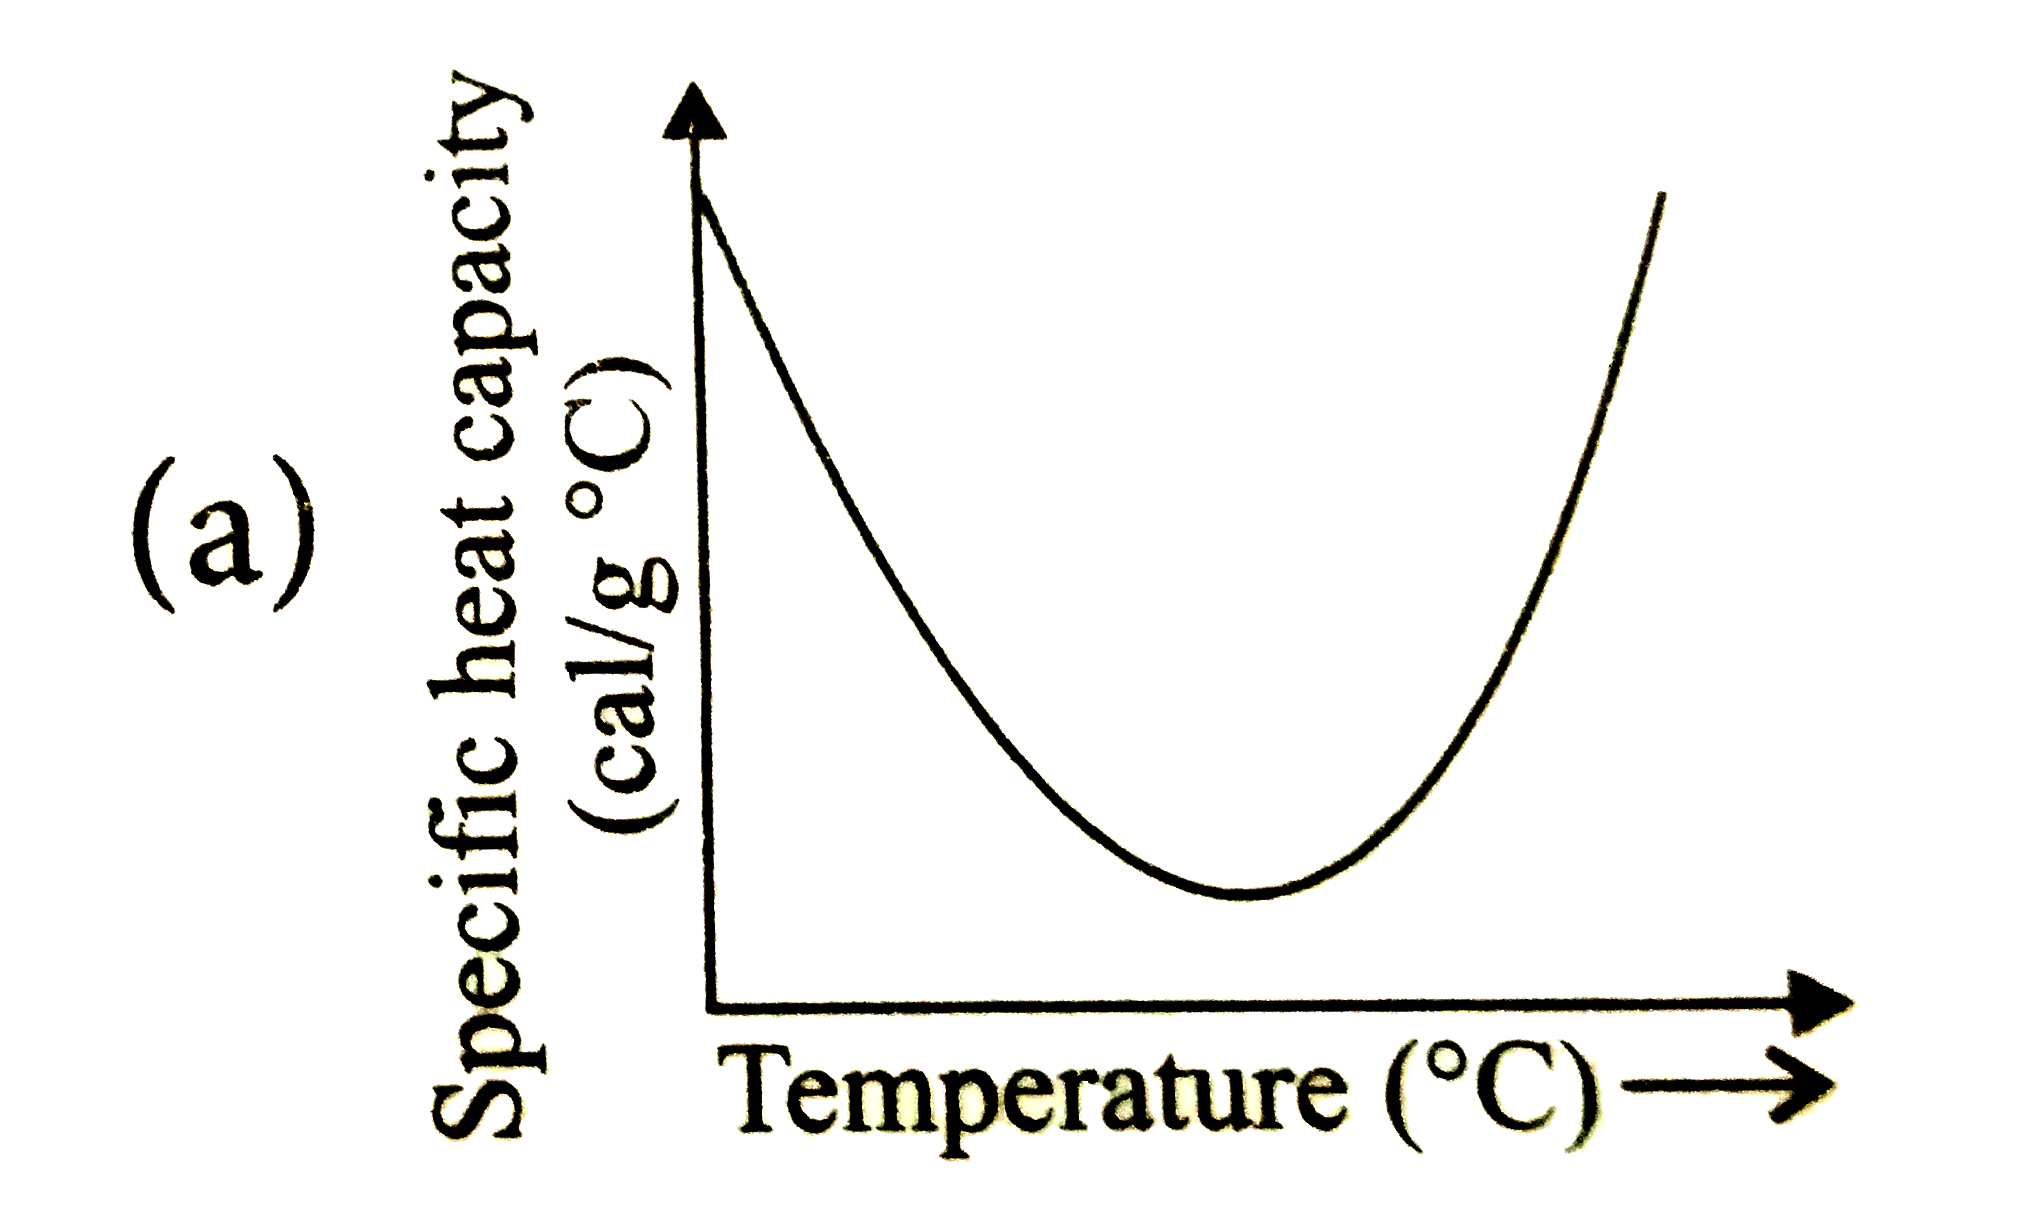 B
B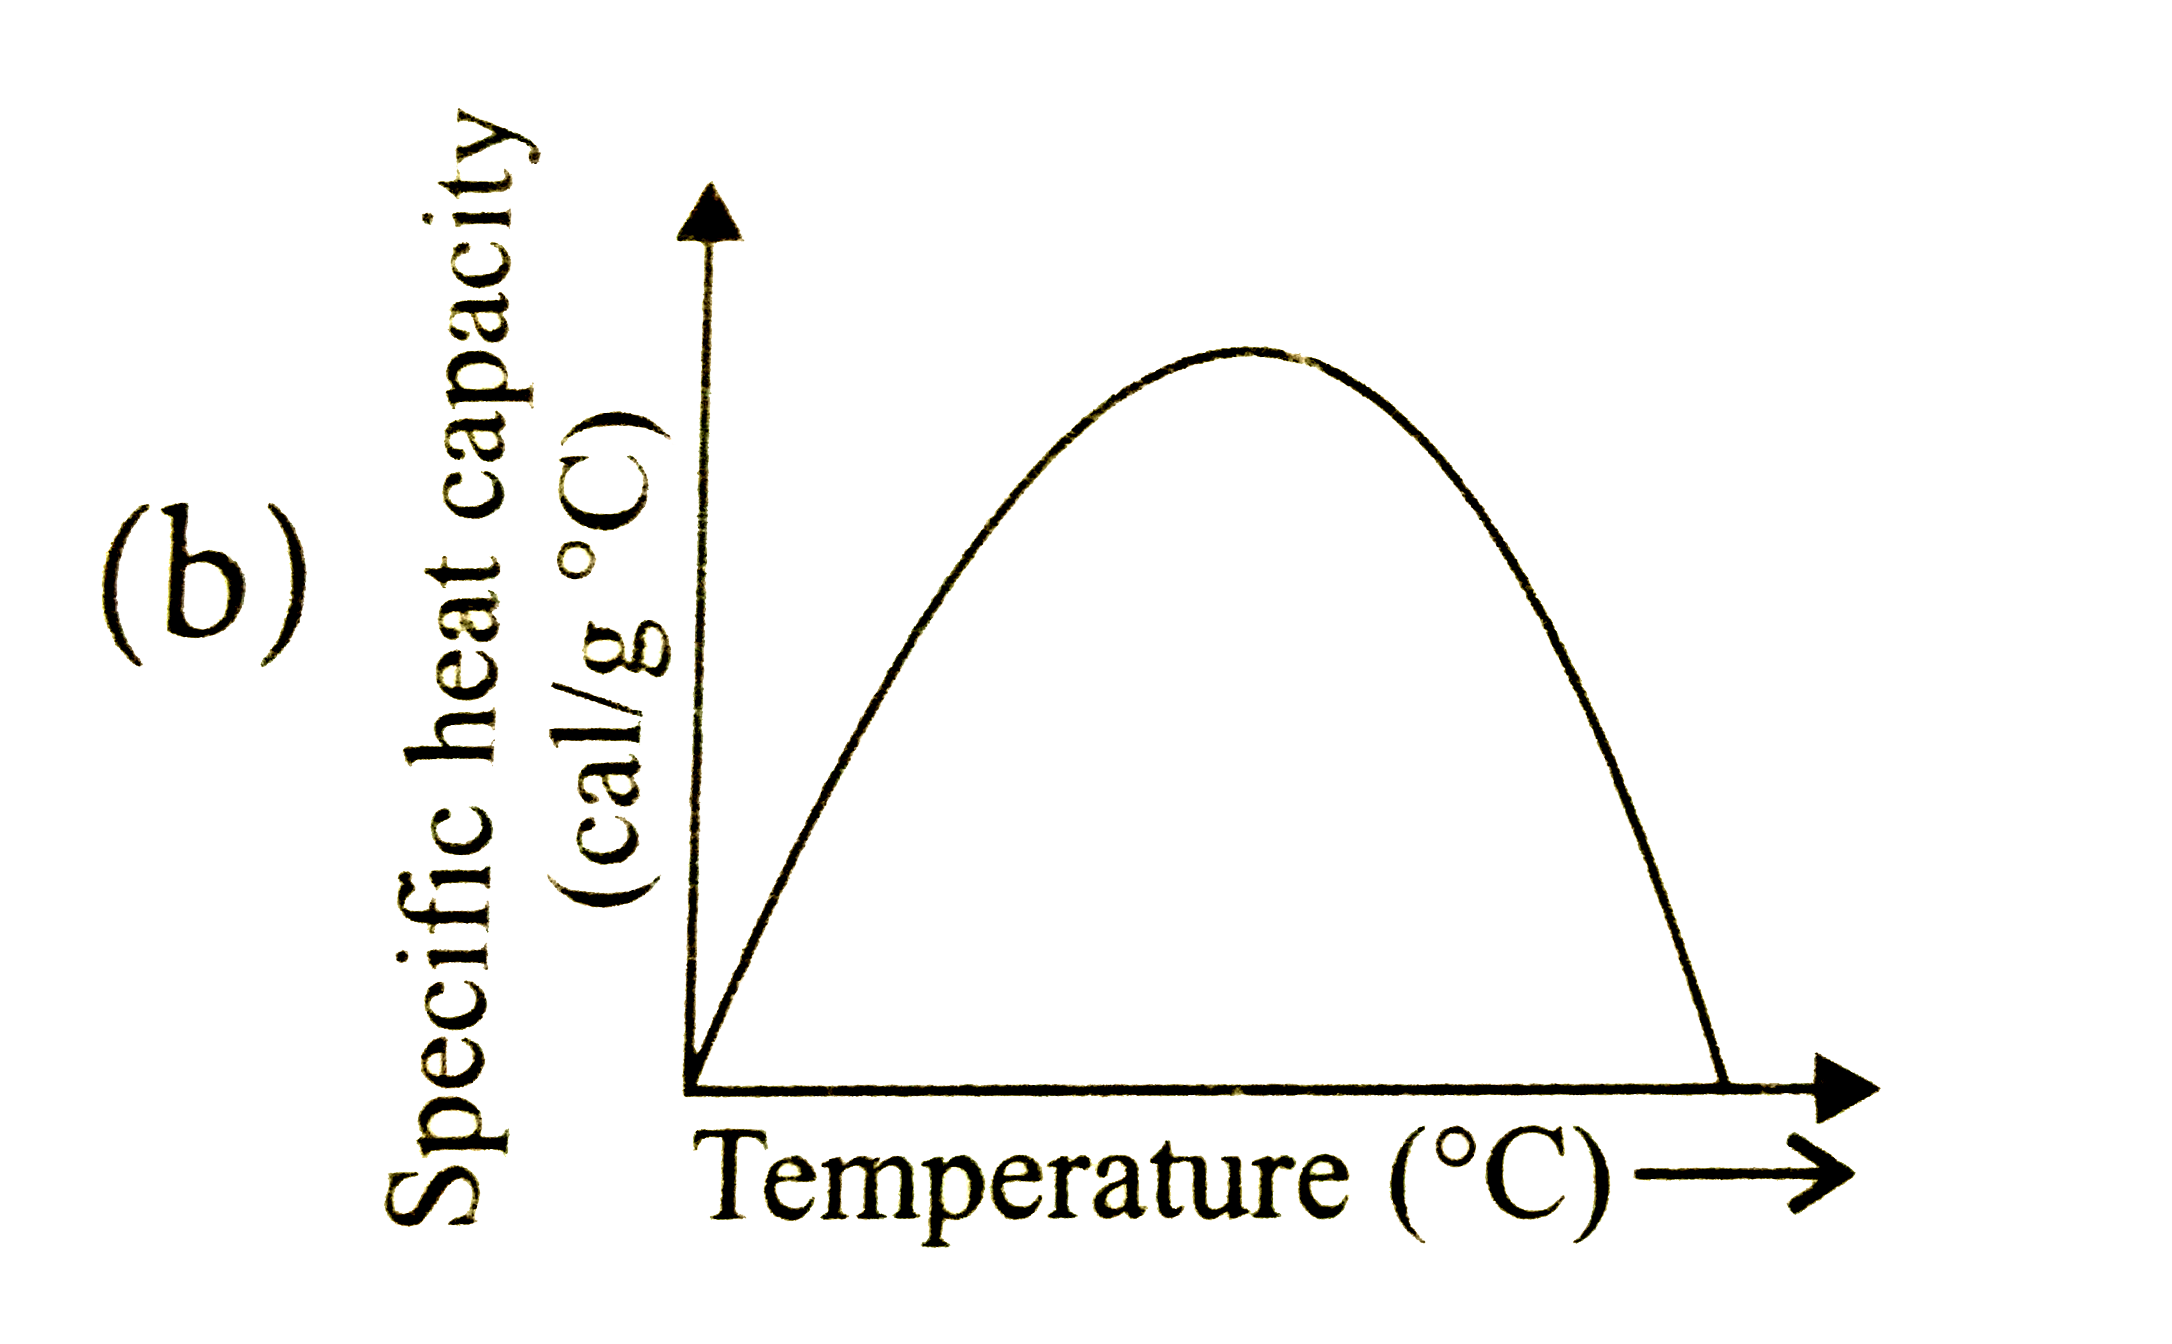 C
C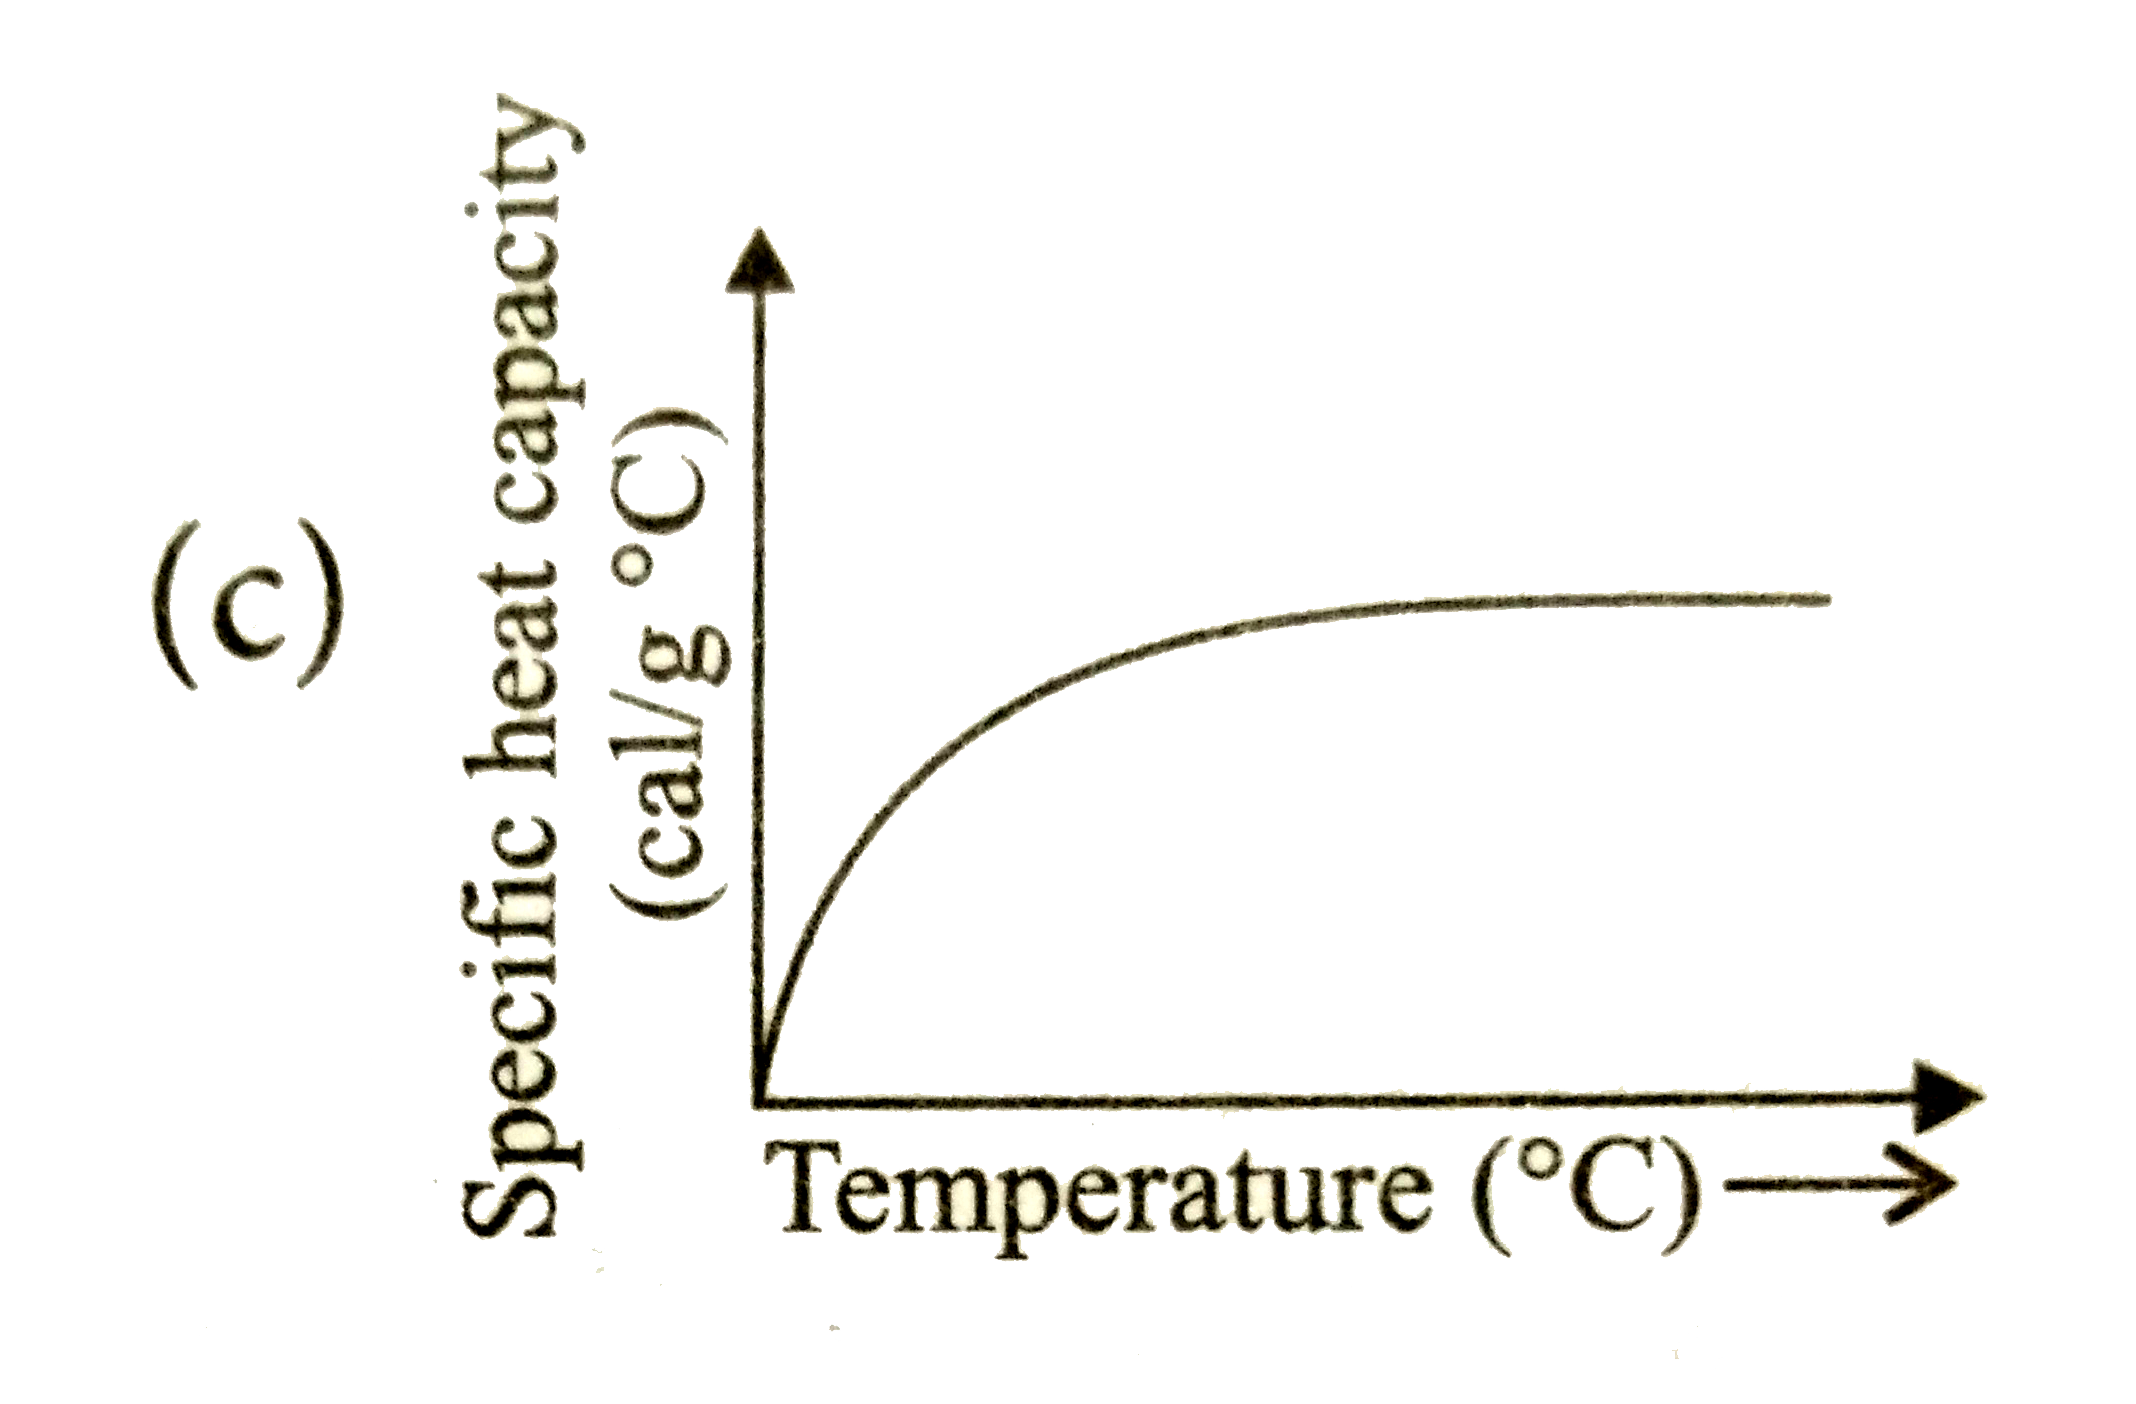 D
D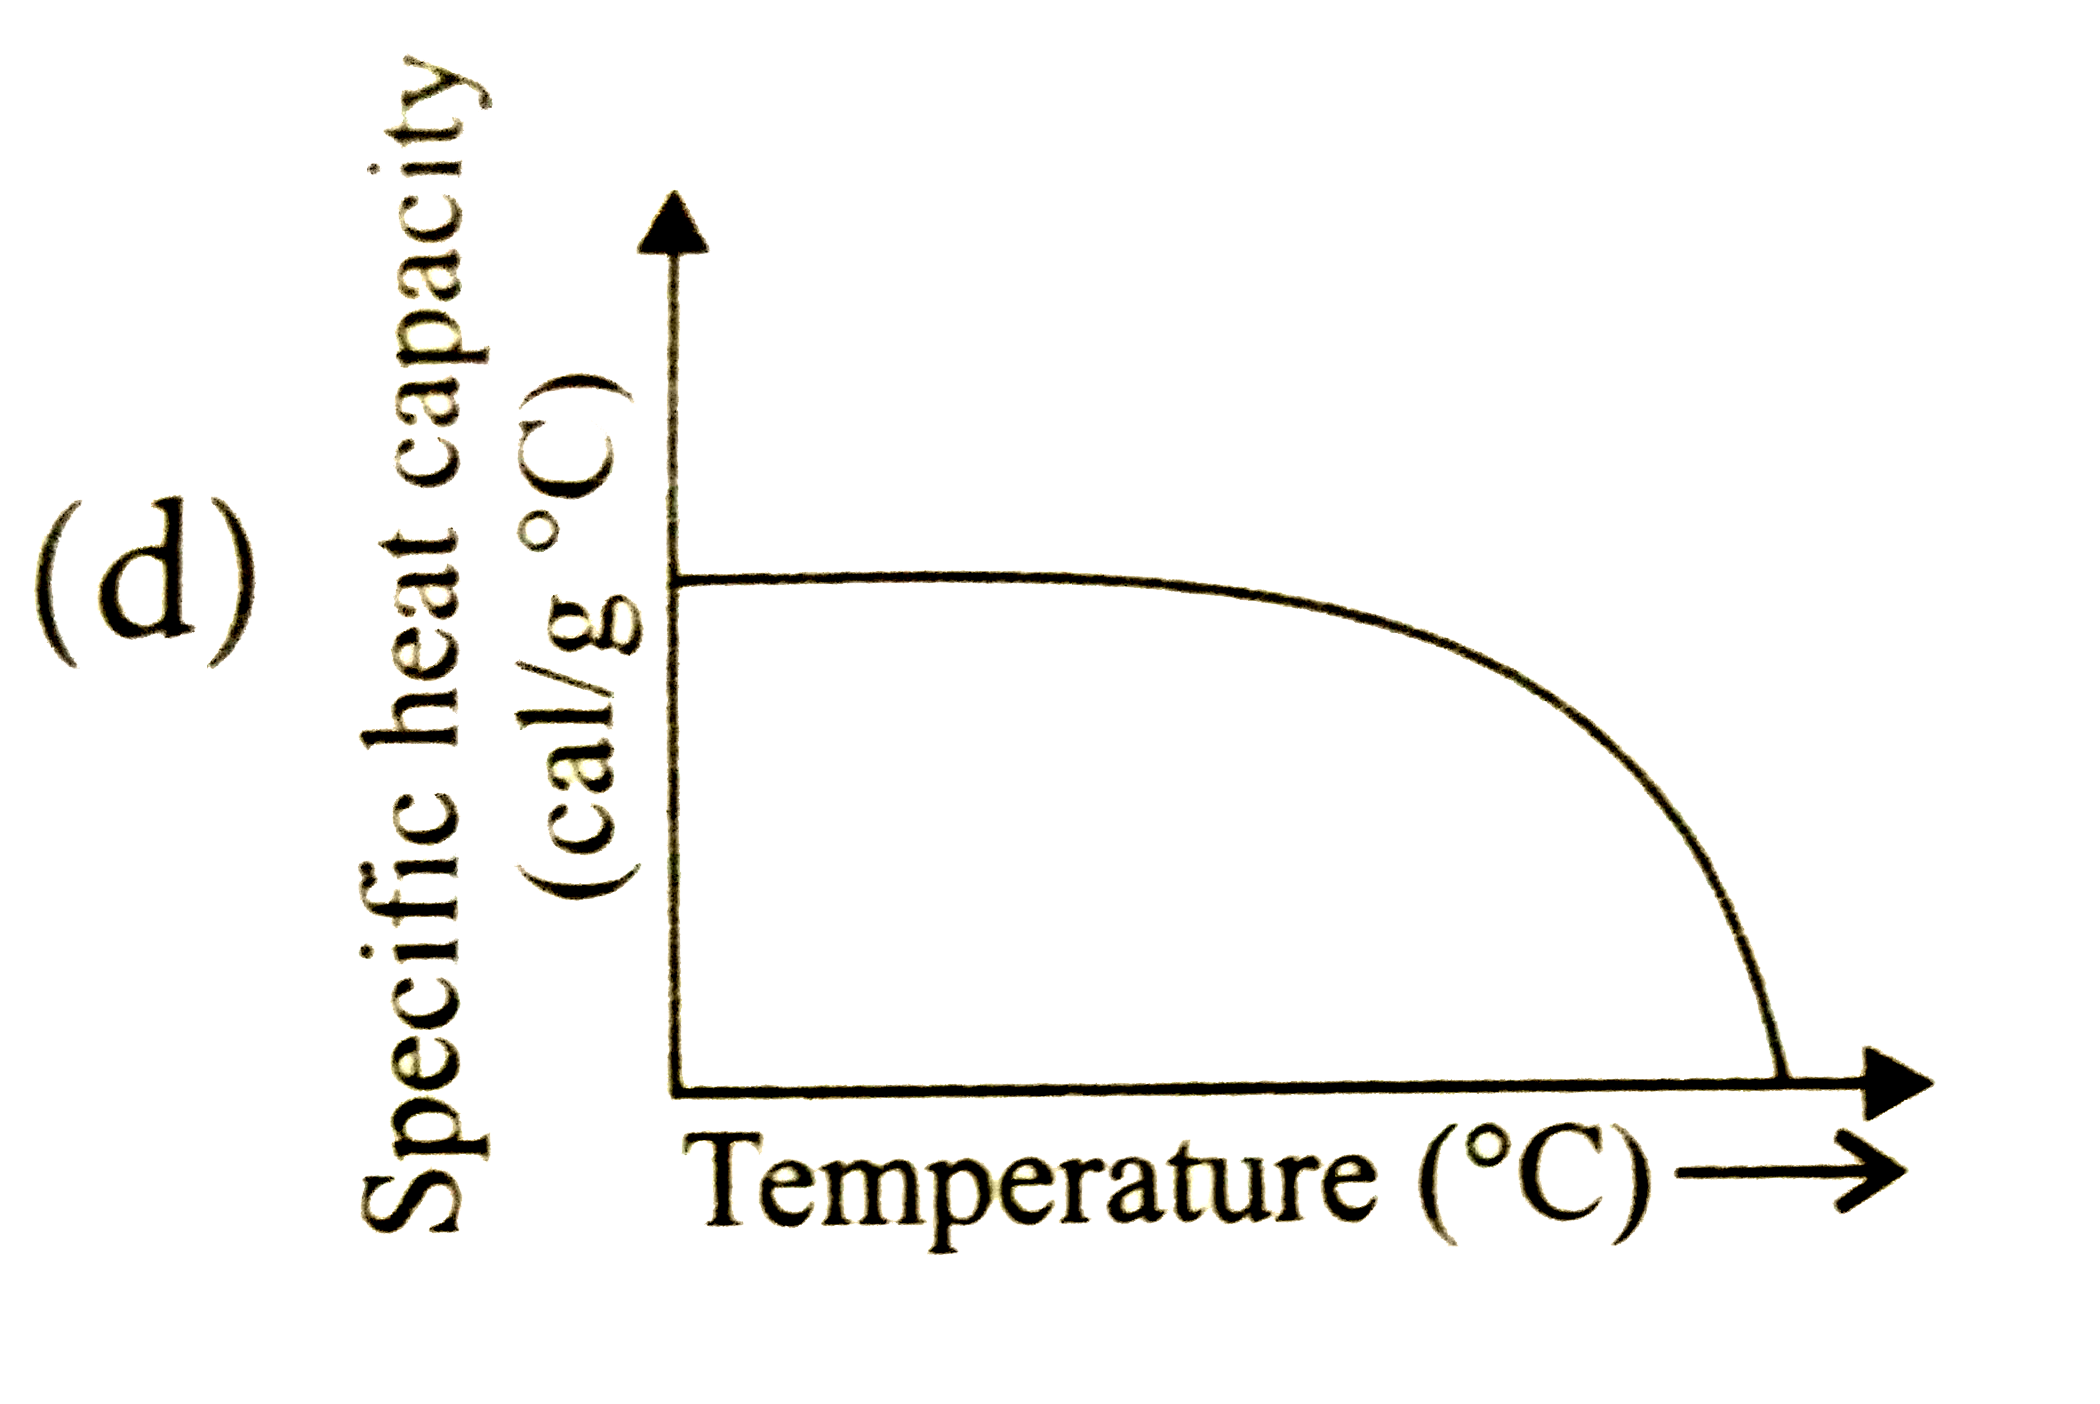
By increasing the temperature, the specific resistance of a conductor and a semiconductor
Aboth conductor and semiconductor increasesBboth conductor and semiconductor decreasesCconductor increases and semiconductor decreasesDconductor decreases and semiconductor increases
Define the terms resistivity and conductivity and state their S. I. units. Draw a graph showing the variation of resistivity with temperature for a typical semiconductor.
View SolutionDefine the term 'temperature coefficient of resistivity' . Write its S.I. unit. Plot a graph showing the variation of resistivity of copper with temperature.
View SolutionWhich graph represents the variation of surface tension with temperature over small temperature ranges for water?
View SolutionDraw a graph showing variation of resistivity with temperature for nichrome. Which property of nichrome is used to make standard resistance coils ?
View SolutionA constant potential difference is applied across a resistance. Consider variation of resistance with temperature. Which graph represents best the variation of power produced in resistance versus resistance?
View Solution