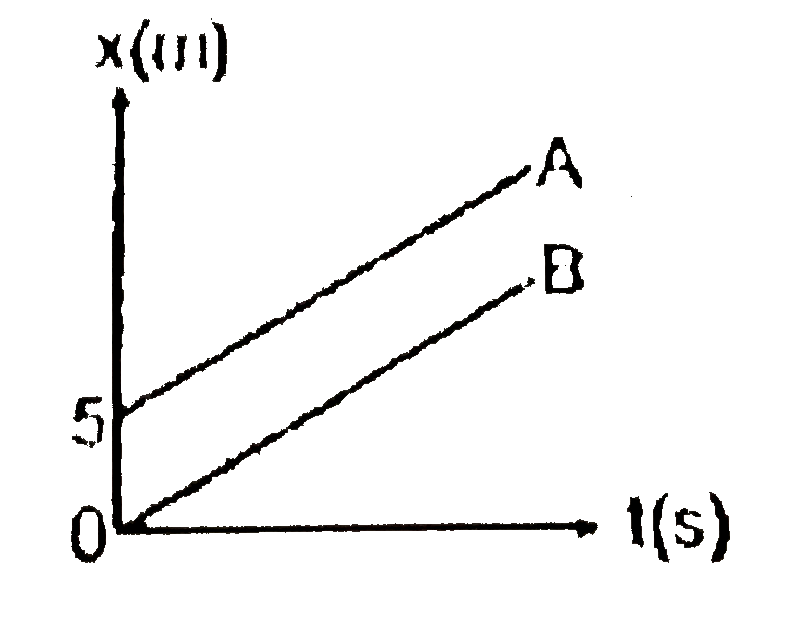
In the above figure distance vs time graphs showing motion of two cars A and B are given. Which car moves fast ? (AS1) Solution in Tamil
Step by step video & image solution for In the above figure distance vs time graphs showing motion of two cars A and B are given. Which car moves fast ? (AS_(1)) by Physics experts to help you in doubts & scoring excellent marks in Class 9 exams.
Updated on:21/07/2023Topper's Solved these Questions
- MOTIONBOOK - NCERT TAMILCHAPTER - MOTIONEXERCISE - LET US IMPROVE OUR LEARNING(HIGHER ORDER THINKING QUESTIONS)
3 Videos
- MOTIONBOOK - NCERT TAMILCHAPTER - MOTIONEXERCISE - LET US IMPROVE OUR LEARNING(MULTIPLE CHOICE QUESTION)
4 Videos
- MOTIONBOOK - NCERT TAMILCHAPTER - MOTIONEXERCISE - LET US IMPROVE OUR LEARNING (REFLECTIONS ON CONCEPTS )
7 Videos
- MEASUREMENT BOOK - NCERT TAMILCHAPTER - MEASUREMENT EXERCISE - Problems
3 Videos
- REFRACTION OF LIGHT AT PLANE SURFACESBOOK - NCERT TAMILCHAPTER - REFRACTION OF LIGHT AT PLANE SURFACESEXERCISE - THINK AND DISCUSS
2 Videos
Similar Questions
When the velocity is constant, can the average velocity over any time interval differ from instantaneous velocity at any instant? If so, give an example, if not explain why. (AS2)
View SolutionThe distance travelled by an object in a specified direction is
View SolutionDistinguish between speed and velocity. (AS1)
View SolutionCalculate the correct reading, if the main scale reading is 8 cm, vernier coincidence is 4 and positive zero error is 0.05 cm.
View SolutionHave you seen a mirage which is an illusion of the appearance of water on a hot road or ion a desert ?
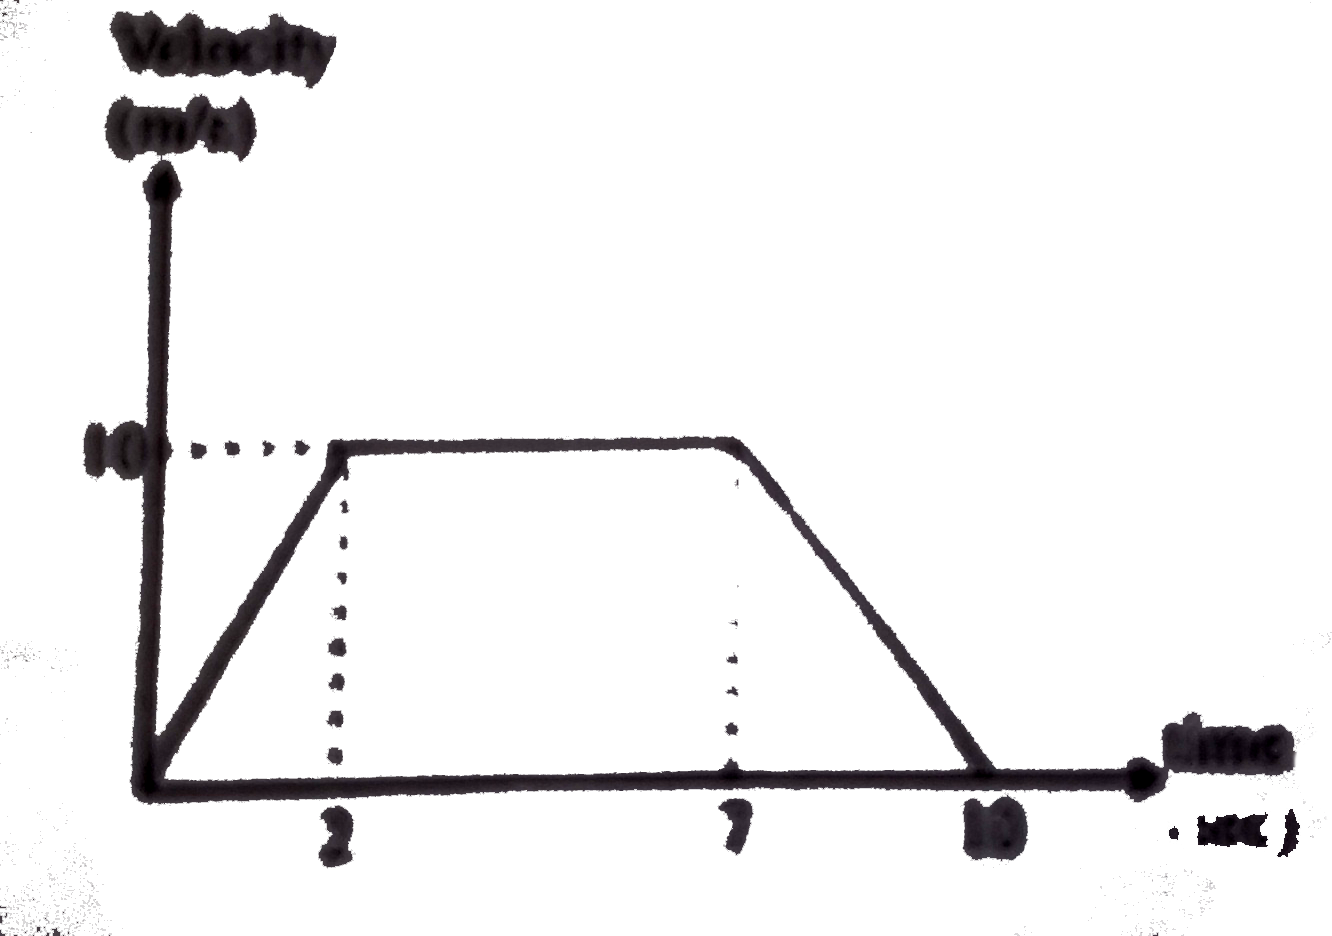
View SolutionThe velocity- time graph of car moving on a straight track is given below. The car weight 1000kg. The distance travelled by the car during the whole motion is:
View SolutionThe velocity- time graph of car moving on a straight track is given below. The car weight 1000kg.
 correct acceleration-time graph representing the motion of car is:
View SolutionFigure given shows the distance - time graph of the motion of a car. It follows from the graph that the car is
View SolutionFigure shows position-time graph of two cars A and B.

View SolutionIn the above figure distance vs time graphs showing motion of two cars A and B are given. Which car moves fast ? (AS1)
View SolutionSpeed - time graph for a car is show in the fig 1.13:Which part of the graph represents uniform motion of the car ?

View SolutionGiven figure shows the distance-time graph of the motion of a car. It follows from the,| graph that the car is
View SolutionFigure below shows the distance -time graph of the motion of a car. It follows from the graph that the car is-

View SolutionThe speed-time graph of a car is shown in figure given below Speed-time graph] (a) Find how far does the car travel in the first 4 second. Shade the area on the graph that represents the distance travelled by the car during the period. (b) Which part of the graph represents uniform motion of the car ?
View SolutionFigure given shows the distance - time graph of the motion of a car. It follows from the graph that the car is
View Solution
