Draw a distance-time graph to show the motion of a car moving with a speed which is not constant (non-uniform speed).
To draw a distance-time graph showing the motion of a car moving with non-uniform speed, follow these steps:
Step 1: Set Up the Axes
- Draw two perpendicular lines to represent the axes of the graph. The horizontal axis (x-axis) will represent time (in seconds), and the vertical axis (y-axis) will represent distance (in meters).
Hint: Label the x-axis as "Time (s)" and the y-axis as "Distance (m)".
Step 2: Determine the Nature of the Motion
- Since the car is moving with non-uniform speed, we need to represent varying speeds. This means that the slope of the graph will change.
Hint: Remember, a steeper slope indicates a higher speed, while a flatter slope indicates a lower speed.
Step 3: Draw the Graph
- Start by plotting a point at the origin (0,0), which represents the starting point of the car at time zero.
- As time progresses, draw a curve that initially rises steeply, indicating that the car is accelerating (speed is increasing).
- After reaching a certain point, the curve should flatten out, indicating that the car is moving at a slower speed (speed is decreasing).
- Then, make the curve steep again, indicating that the car accelerates once more.
- Finally, let the curve flatten again to show that the car is slowing down.
Hint: Use smooth curves instead of straight lines to illustrate the changes in speed.
Step 4: Label the Graph
- Clearly label the graph to indicate the different sections of the motion, such as "Acceleration", "Constant Speed", "Deceleration", etc.
Hint: Adding labels helps in understanding the different phases of motion represented in the graph.
Step 5: Review the Graph
- Check to ensure that the graph accurately represents the non-uniform motion of the car, with varying slopes indicating changes in speed.
Hint: Make sure the graph flows smoothly and logically represents the changes in speed over time.
Final Graph
- Your final distance-time graph should show a curve that rises steeply, flattens, rises steeply again, and then flattens out again, indicating the non-uniform speed of the car.
- Draw two perpendicular lines to represent the axes of the graph. The horizontal axis (x-axis) will represent time (in seconds), and the vertical axis (y-axis) will represent distance (in meters).
- Since the car is moving with non-uniform speed, we need to represent varying speeds. This means that the slope of the graph will change.
- Start by plotting a point at the origin (0,0), which represents the starting point of the car at time zero.
- As time progresses, draw a curve that initially rises steeply, indicating that the car is accelerating (speed is increasing).
- After reaching a certain point, the curve should flatten out, indicating that the car is moving at a slower speed (speed is decreasing).
- Then, make the curve steep again, indicating that the car accelerates once more.
- Finally, let the curve flatten again to show that the car is slowing down.
- Clearly label the graph to indicate the different sections of the motion, such as "Acceleration", "Constant Speed", "Deceleration", etc.
- Check to ensure that the graph accurately represents the non-uniform motion of the car, with varying slopes indicating changes in speed.
- Your final distance-time graph should show a curve that rises steeply, flattens, rises steeply again, and then flattens out again, indicating the non-uniform speed of the car.
Topper's Solved these Questions
- MOTION AND TIMEBook:LAKHMIR SINGH & MANJIT KAURChapter:MOTION AND TIMEExercise:EXERCISE
Explore 108 Videos
- LIGHTBook:LAKHMIR SINGH & MANJIT KAURChapter:LIGHTExercise:EXERCISEE
Explore 130 Videos
- WINDS, STORMS AND CYCLONESBook:LAKHMIR SINGH & MANJIT KAURChapter:WINDS, STORMS AND CYCLONESExercise:EXERCISE
Explore 92 Videos
Similar Questions
Knowledge Check
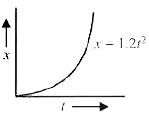
Which of the following distance time graphs shows a truck moving with a speed which is not constant ?
A B
B C
C D
D
Which of the following distance-time graphs shows a truck moving with speed which is not constant?
A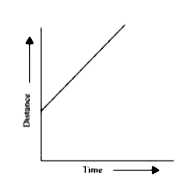 B
B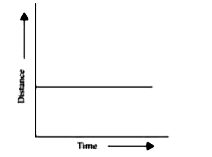 C
C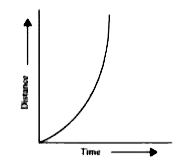 D
D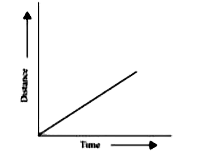
Which of the following distance-time graphs shows a truck moving with speed which is not constant?
A B
B C
C D
D
Show the shape of the distance-time graph for the motion in the following cases:
A car moving with a constant speed.
View SolutionDraw distance time graph of a body moving with constant acceleration.
View SolutionThe shape of thedistance-time graph for the motion in the following case is,A car moving with a constantspeed is
View SolutionThe graph of distance -time graph for uniform motion for an object is
View SolutionGiven figure shows the distance-time graph of the motion of a car. It follows from the,| graph that the car is
View Solution