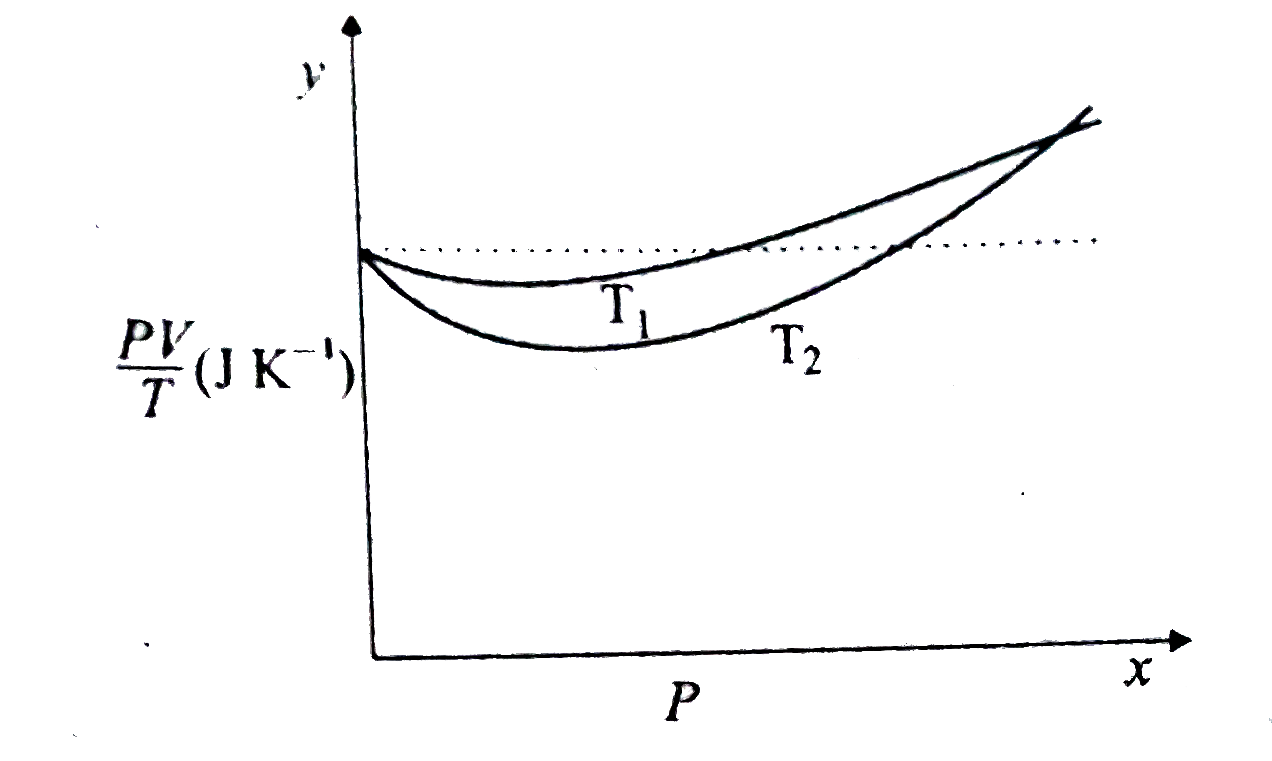
Figure Show plot of PV/T versus P for 1.00×10⁻³ kg of oxygen gas at two different temperatures.
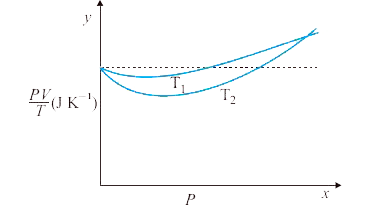
(a) What does the dotted plot signify?
(b) Which is true: T1>T2 or T1<T2?
(c) What is the value of PV/T where the curves meet on the y-axis?
(d) If we obtained similar plots for 1.00×10⁻³ kg of hydrogen, would we get the same value of PV/T at the point where the curves meet on the y-axis? If not, what mass of hydrogen yields the same value of PV/T (for low pressure high temperature region of the plot) ? (Molecular mass of H_(2) = 2.02 u, of O_(2) = 32.0 u, R= 8.31Jmol^(-1)K^(-1).)Solution in Telugu
(a) The dotted plot corresponds to .ideal gas behaviour, (b) T1>T2: (c) 0.26JK−1, (d) No, 6.3×10⁻⁵ kg of H2 would yield the same value
Topper's Solved these Questions
- KINETIC THEORYBOOK - NCERT TELUGUCHAPTER - KINETIC THEORYEXERCISE - ADDITIONAL EXERCISE
3 Videos
- KINETIC THEORYBOOK - NCERT TELUGUCHAPTER - KINETIC THEORYEXERCISE - ADDITIONAL EXERCISE
3 Videos
- GRAVITATIONBOOK - NCERT TELUGUCHAPTER - GRAVITATIONEXERCISE - ADDITIONAL EXERCISES
3 Videos
- LAW OF MOTIONBOOK - NCERT TELUGUCHAPTER - LAW OF MOTIONEXERCISE - EXERCISE (ADDITIONAL EXERCISE)
17 Videos
Similar Questions
A metre long narrow bore held horizontally (and closed at one end) contains a 76 cm long mercury thread, which traps a 15 cm column of air. What happens if the tube is held vertically with the open end at the bottom ?
View SolutionA metre long narrow bore held horizontally (and closed at one end) contains a 76 cm long mercury thread, which traps a 15 cm column of air. What happens if the tube is held vertically with the open end at the bottom ?
View SolutionAs you have learnt in the text, a geostationary satellite orbits the earth at a height of nearly 36,000 km from the surface of the earth. What is the potential due to earth’s gravity at the site of this satellite ? (Take the potential energy at infinity to be zero). Mass of the earth =6.0×1024kg. radius=6400km .
View SolutionFigure shows the position-time graph of a body of mass 0.04 kg. Suggest a suitable physical context for this motion. What is the time between two consecutive impulses received by the body ? What is the magnitude of each impulse ?

View SolutionFig shows of PV/T versus P for 1.00×10⁻³kg of oxygen gas at two different temperatures.
(a) What does the dotted plot signify ?
(b) Which is true : T1<T2orT2<T1?
( c) What is the value of PV/T where the curves meet on the Y-axis ?
(d) If we obtained similar plot for 1.00×10⁻³kg of hydrogen, would we get the same value of PV/T at the point where the curves meet on the y-axis ? If not, what mass of hydrogen yield the same value of PV/T (for low pressure high temperature region of the plot) ? (Molecular mass of H=2.02u, of O=32.0u,R=8.31Jmol−1K−1
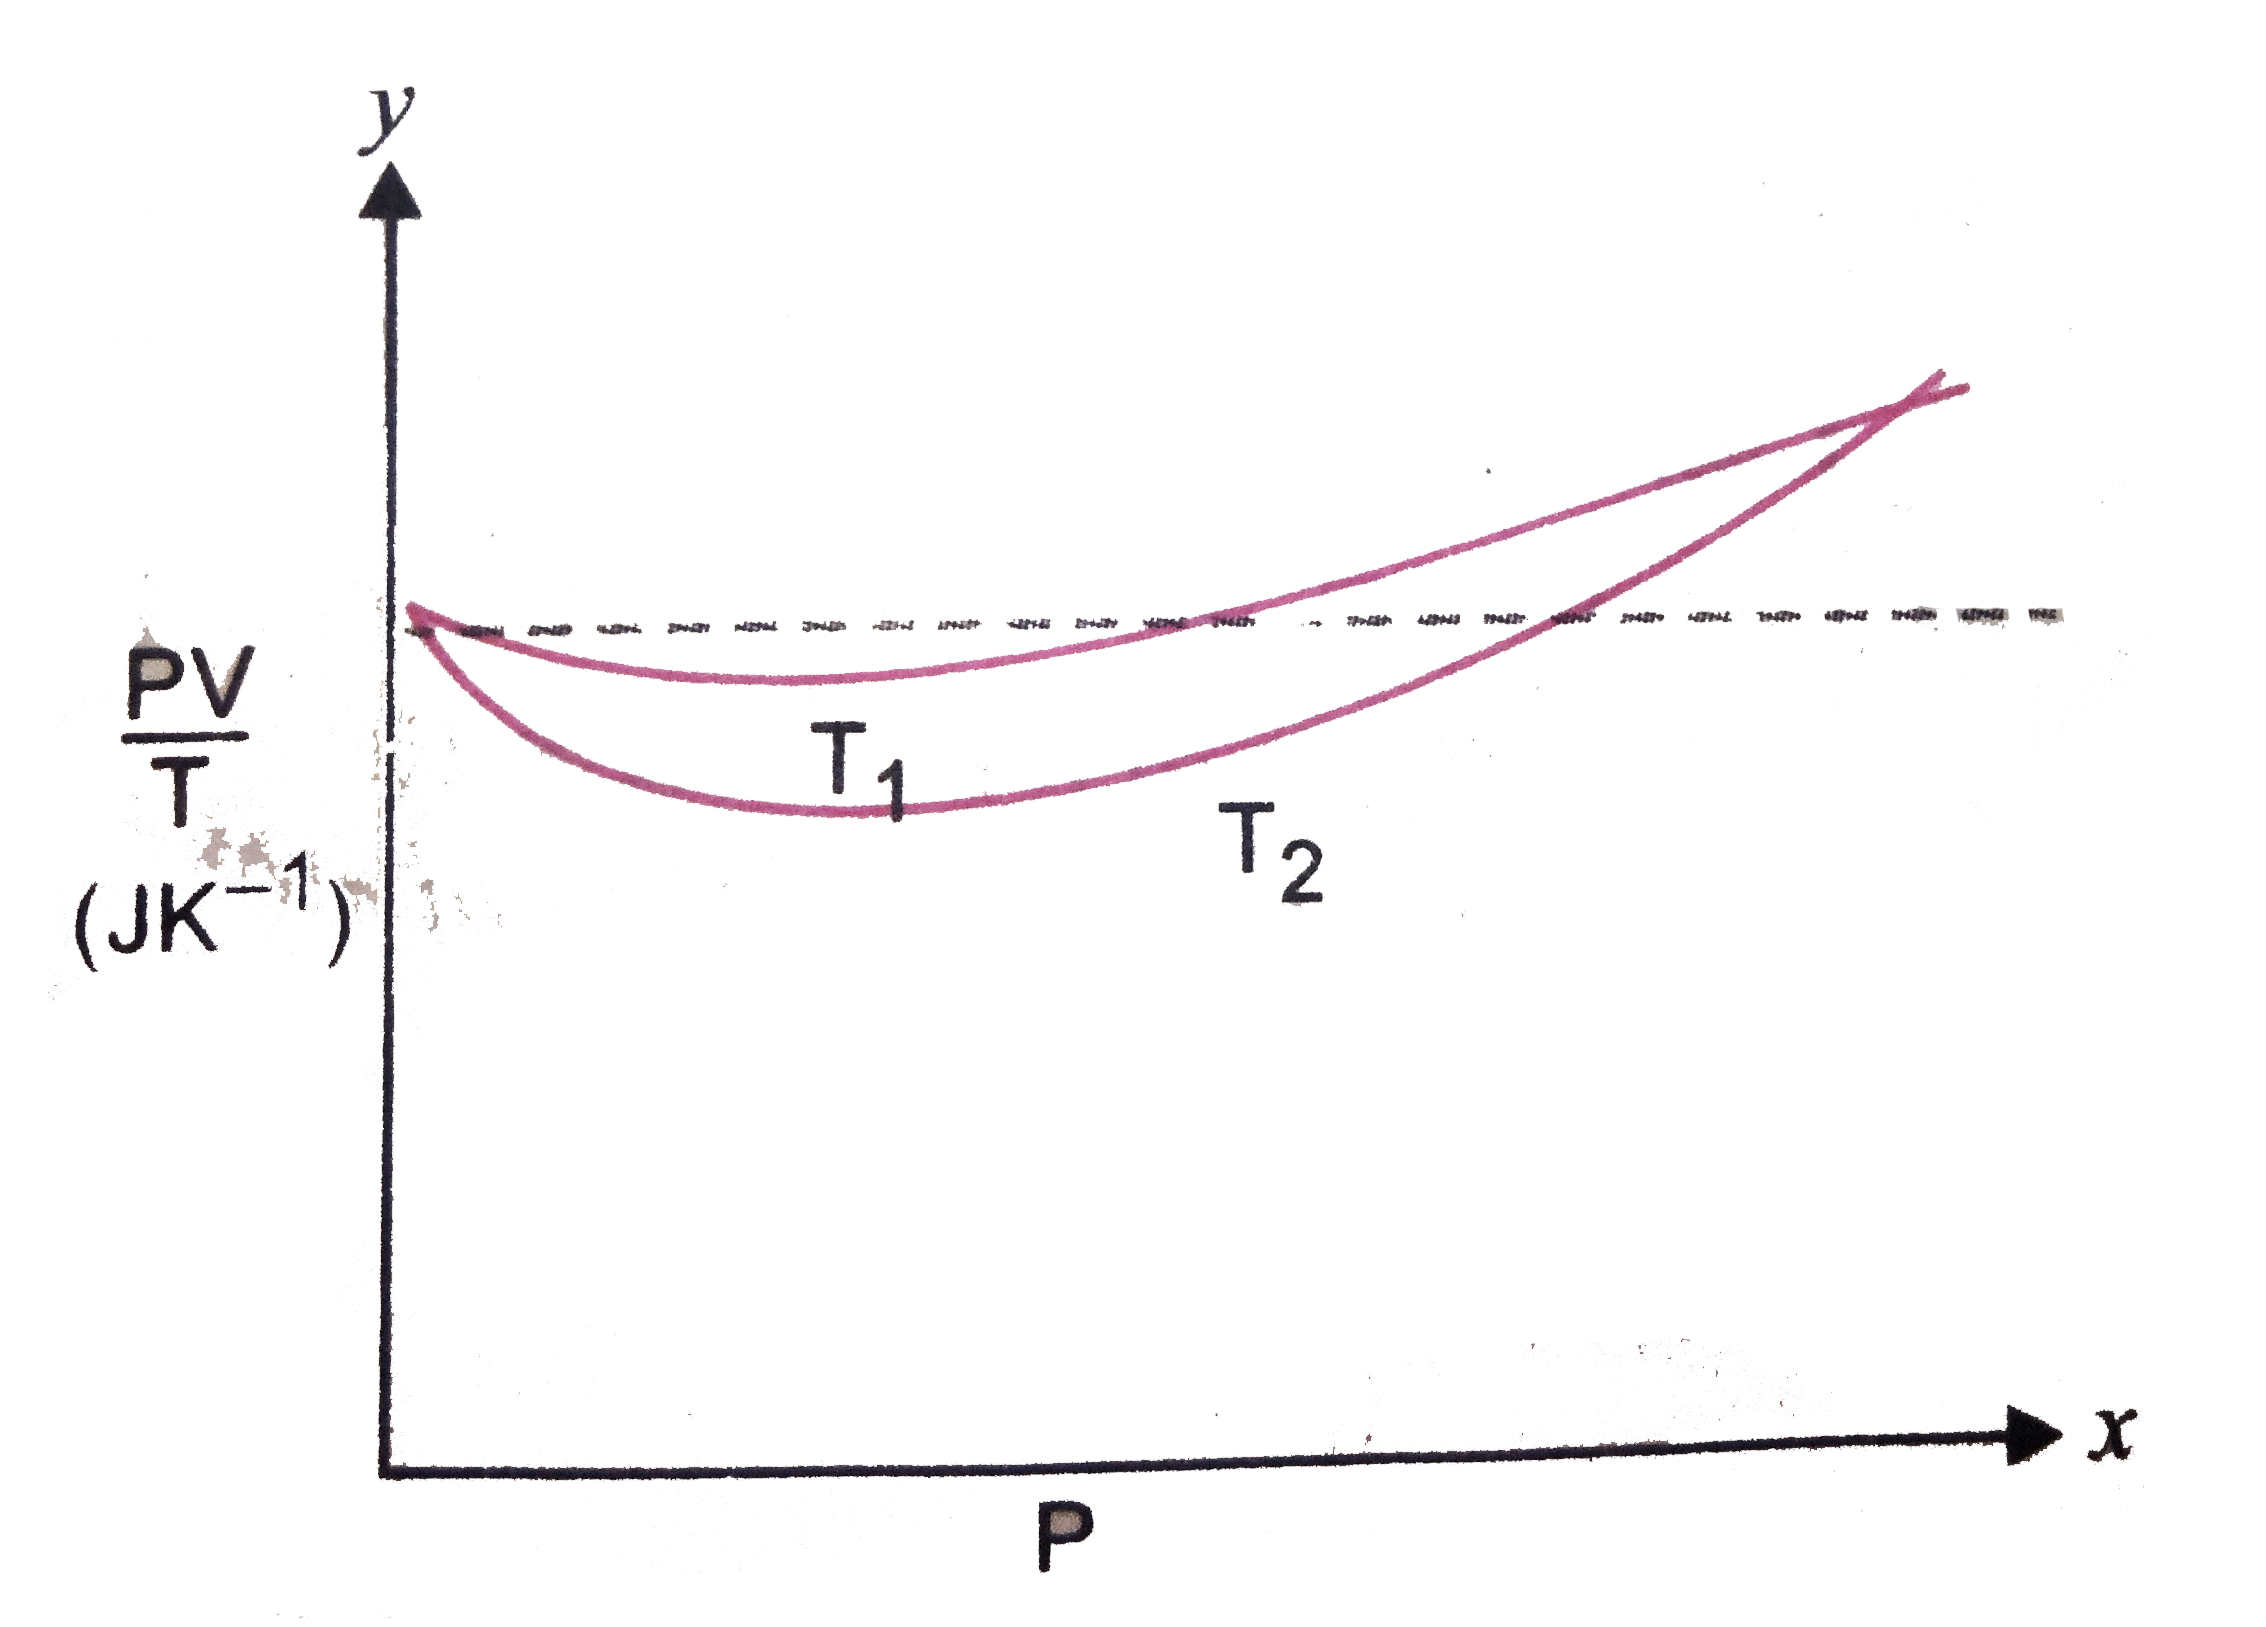
View SolutionGiven is the graph between PVT and P for 1 gm of oxygen gas at two different temperatures T1andT2 Fig. Given, density of oxygen =1.427kgm−3. The value of (PV)/(T) at the point A and the relation between T1andT2 are respectively :
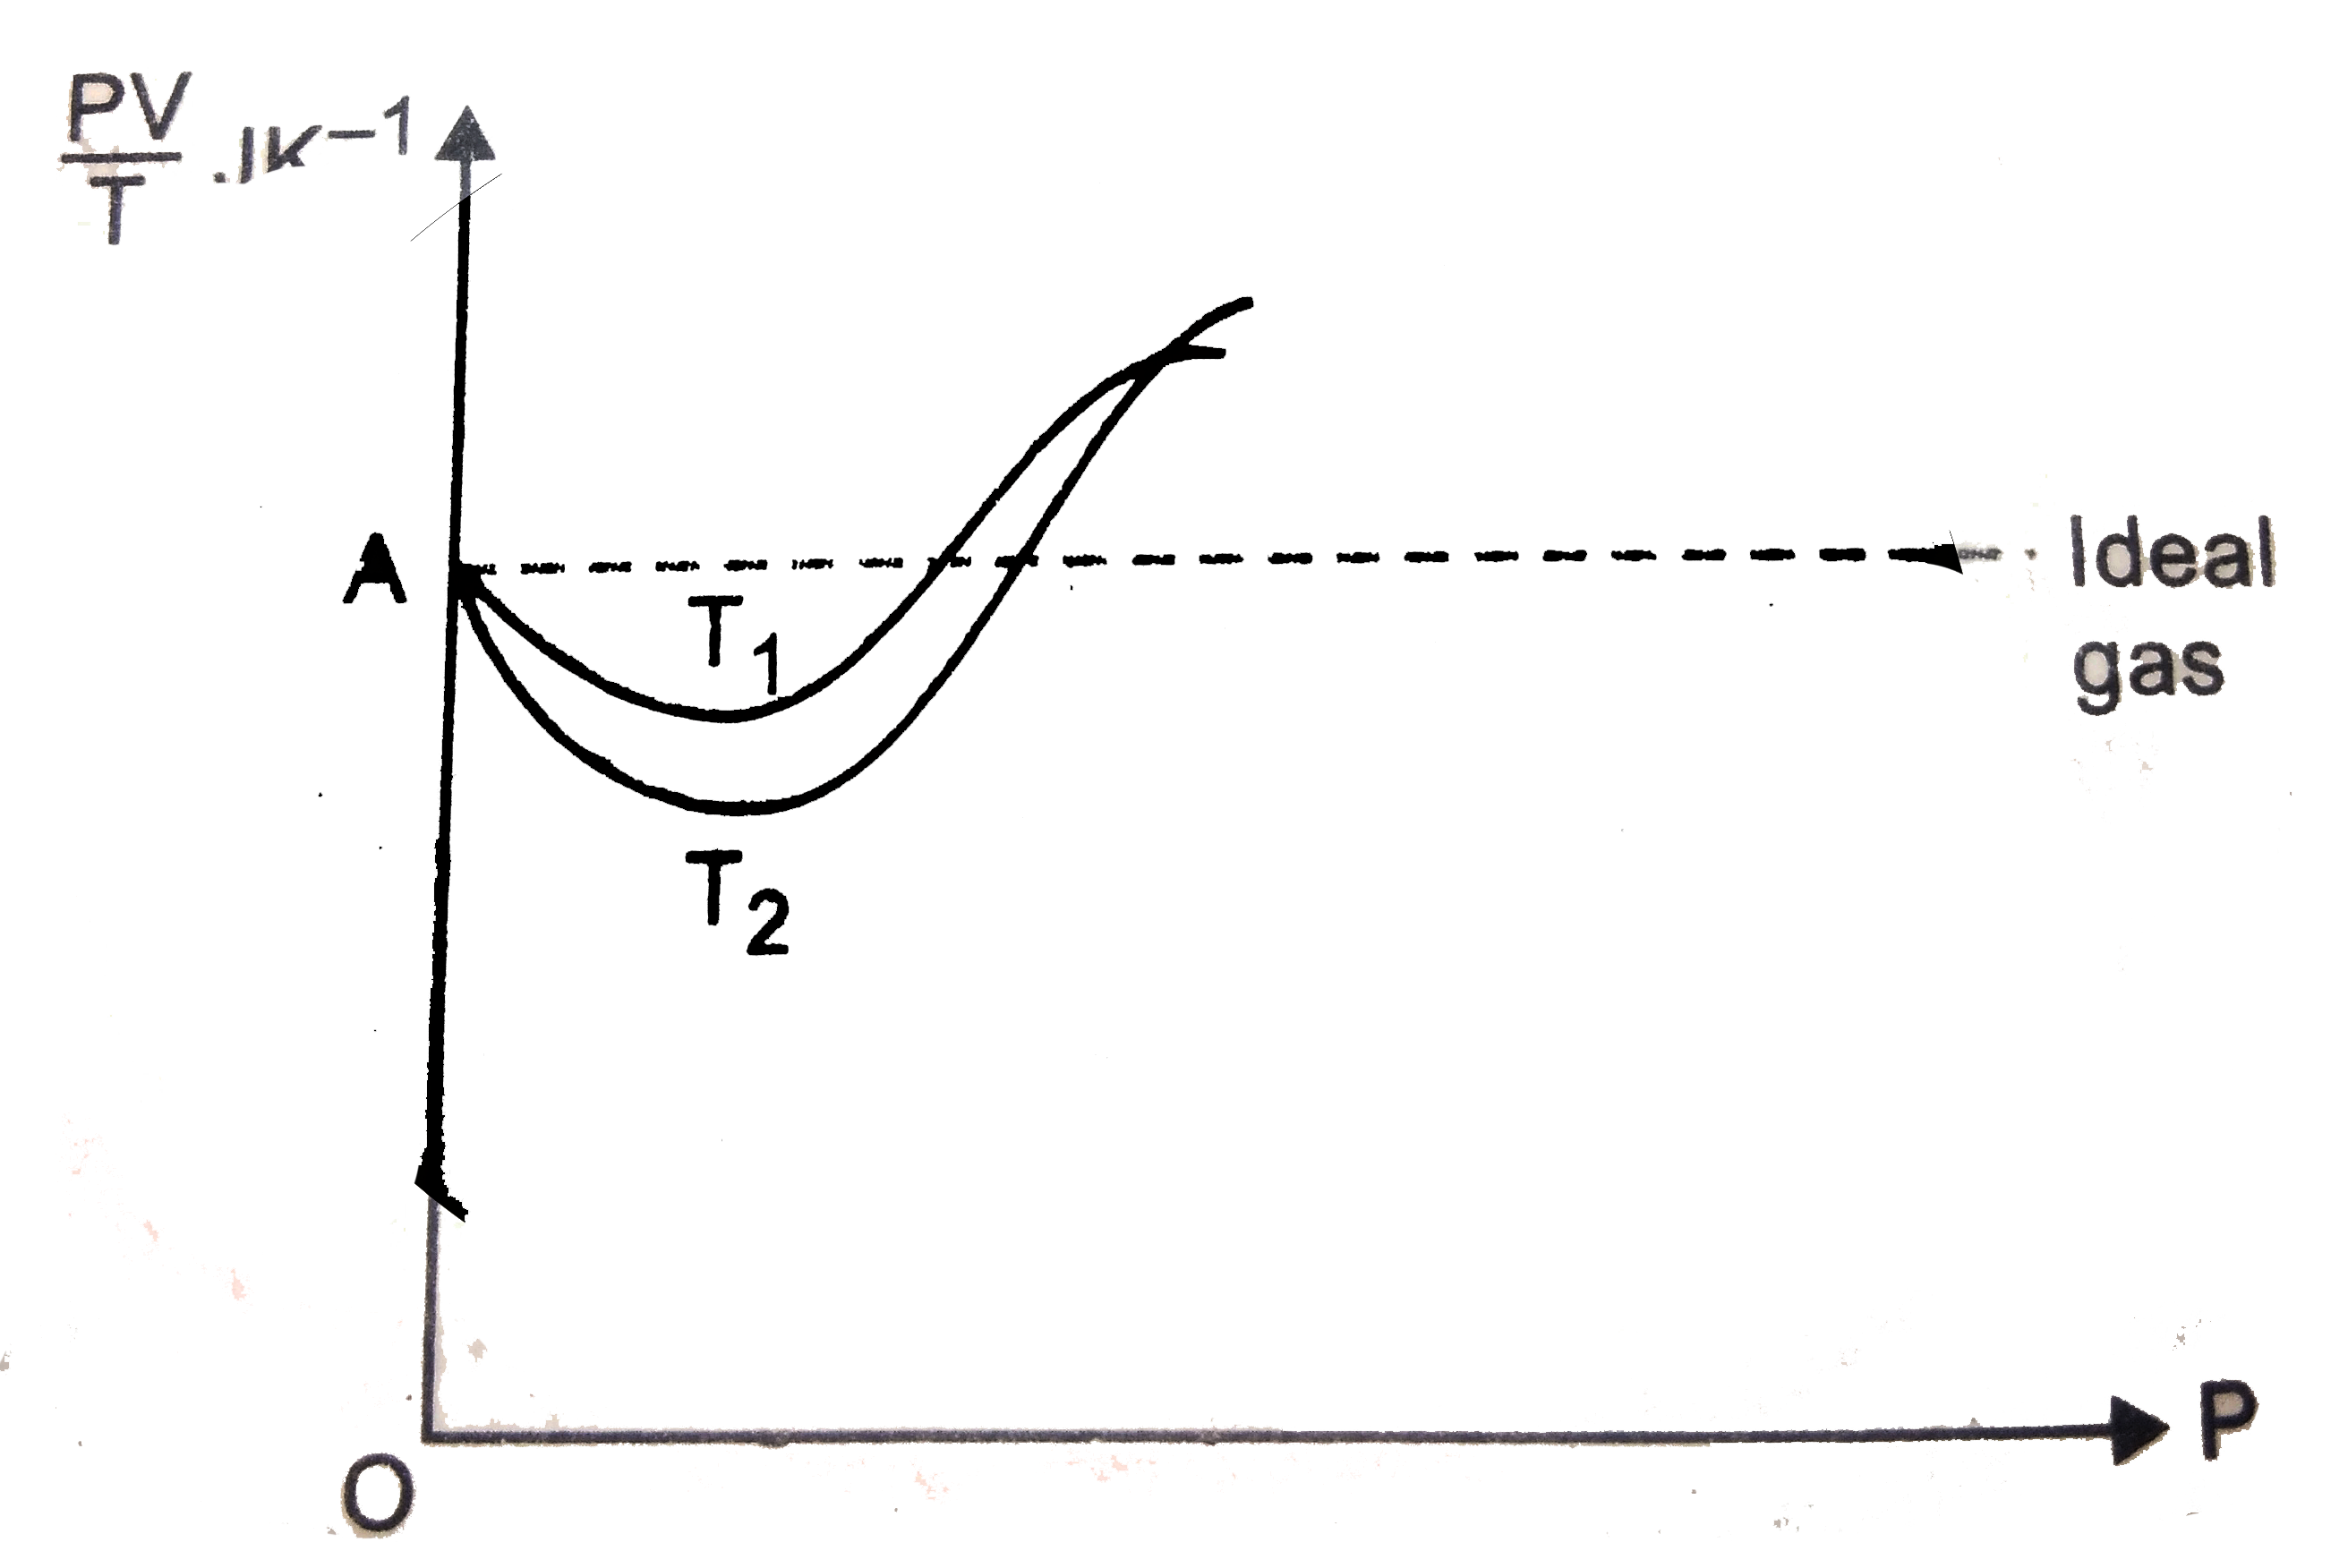
View SolutionThe product of PV is plotted against P at two temperatures T1 and T2 and the result is shown in figure. What is correct about T1 and T2?
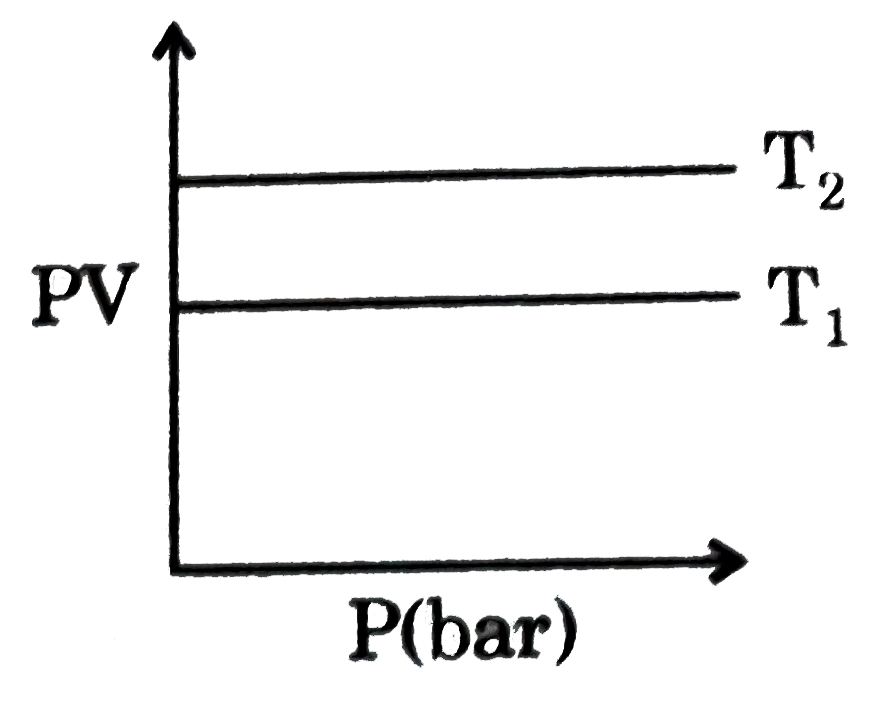
View SolutionFigure shows plot of PV//T versus P"for" 1.00 xx 10^(-3) kg of oxygen gas at two different temperatures. (i) What does the dotted plot signify? (ii) Which is true . T_(1) gt T_(2) "or" T_(1) lt T_(2) ? (iii) What is the value of PV//T where the curves meet on the y-axis?
View Solutionचित्र में ऑक्सीजन के द्रव्यमान के लिए PV/T एवं P में , दो अलग - अलग तापों पर ग्राफ दर्शाये गए है ।
(a ) बिंदुकित रेखा क्या दर्शाती है ?
(b ) क्या सत्य है: T1>T2 अथवा T1<T2?
(c ) y - अक्ष पर जहाँ वक्र मिलते है वहाँ PV/T का मान क्या है ?
( d ) यदि हम ऐसे ही ग्राफ 1.00×10⁻³kg हाइड्रोजन के लिए बनाएँ तो भी क्या उस बिंदु पर जहाँ वक्र y - अक्ष से मिलते है PV/T का मान यही होगा ? यदि नहीं तो हाइड्रोजन के कितने द्रव्यमान के लिए PV/T का मान कम दाब और उच्च ताप के क्षेत्र के लिए वही होगा? (H2 का अणु द्रव्यमान =2.02u,O2 का अणु द्रव्यमान =32.0u,R=8.31Jmol−1K−1)
View SolutionGraphs between pressure and volume are plotted at different temperatures . Which of the following isotherms represent Boyle's law as PV = constant ? (T_(1) gt T_(2) gt T_(3))
View SolutionFigure Show plot of PV/T versus P for 1.00×10⁻³ kg of oxygen gas at two different temperatures.
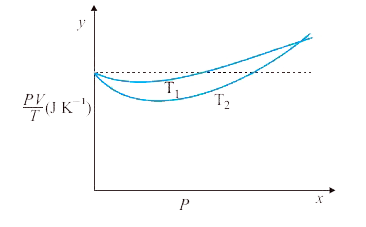
(a) What does the dotted plot signify?
(b) Which is true: T1>T2 or T1<T2?
(c) What is the value of PV/T where the curves meet on the y-axis?
(d) If we obtained similar plots for 1.00×10⁻³ kg of hydrogen, would we get the same value of PV/T at the point where the curves meet on the y-axis? If not, what mass of hydrogen yields the same value of PV/T (for low pressure high temperature region of the plot) ? (Molecular mass of H2=2.02u,ofO2=32.0u,R=8.31Jmol−1K−1.)
View SolutionFigure Show plot of PV/T versus P for 1.00×10⁻³ kg of oxygen gas at two different temperatures.
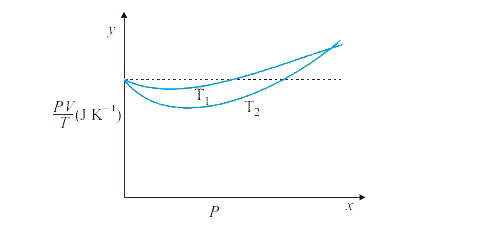
(a) What does the dotted plot signify?
(b) Which is true: T1>T2 or T1<T2?
(c) What is the value of PV/T where the curves meet on the y-axis?
(d) If we obtained similar plots for 1.00×10⁻³ kg of hydrogen, would we get the same value of PV/T at the point where the curves meet on the y-axis? If not, what mass of hydrogen yields the same value of PV/T (for low pressure high temperature region of the plot) ? (Molecular mass of H_(2) = 2.02 u, of O_(2) = 32.0 u, R= 8.31Jmol^(-1)K^(-1).)
View SolutionFigure Show plot of PV/T versus P for 1.00×10⁻³ kg of oxygen gas at two different temperatures.
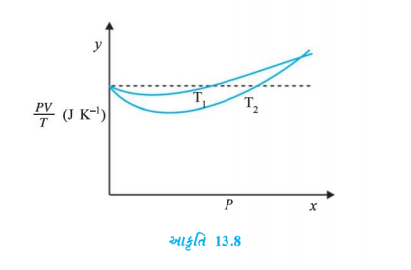
(a) What does the dotted plot signify?
(b) Which is true: T1>T2 or T1<T2?
(c) What is the value of PV/T where the curves meet on the y-axis?
(d) If we obtained similar plots for 1.00×10⁻³ kg of hydrogen, would we get the same value of PV/T at the point where the curves meet on the y-axis? If not, what mass of hydrogen yields the same value of PV/T (for low pressure high temperature region of the plot) ? (Molecular mass of H_(2) = 2.02 u, of O_(2) = 32.0 u, R= 8.31Jmol^(-1)K^(-1).)
View SolutionFigure show plot of (PV)/(T) and P for 2gm of oxygen gas at two different temeratures. (i)The significance of dotted line (ii)The relation between T_(1) and T_(2) (iii)The value of (PV)/(T) where the curves meet on the Y-axis.
View SolutionGiven is the graph between PV/T and P for 1 gm of oxygen gas at two different temperature T_(1) and T_(2) (Given:Density of oxygen= 1.429 kg//m^(3) ).The value of PV/T at the point A and the relation between T_(1) and T_(2) and respectively
View Solution
