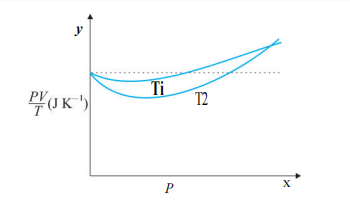
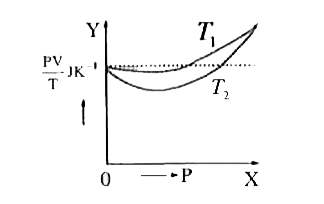
Figure 13.8 shows plot of PV/T versus P for l.OO×lO−3 kg of oxygen gas at two different temperatures. What does the dotted plot signif?:
 Solution in Punjabi
Step by step video & image solution for Figure 13.8 shows plot of PV//T versus P for l.OOxxlO^-3 kg of oxygen gas at two different temperatures. What does the dotted plot signif?: by Physics experts to help you in doubts & scoring excellent marks in Class 11 exams.
Updated on:21/07/2023Topper's Solved these Questions
Similar Questions
Answer the following :- You can shield a charge from electrical forces by putting it inside a hollow conductor. Can you shield a body from the gravitational influence of nearby matter by putting it inside a hollow sphere or by some other means ?
View SolutionGive the magnitude and direction of the net force acting on:- a drop of rain falling down with a constant speed.
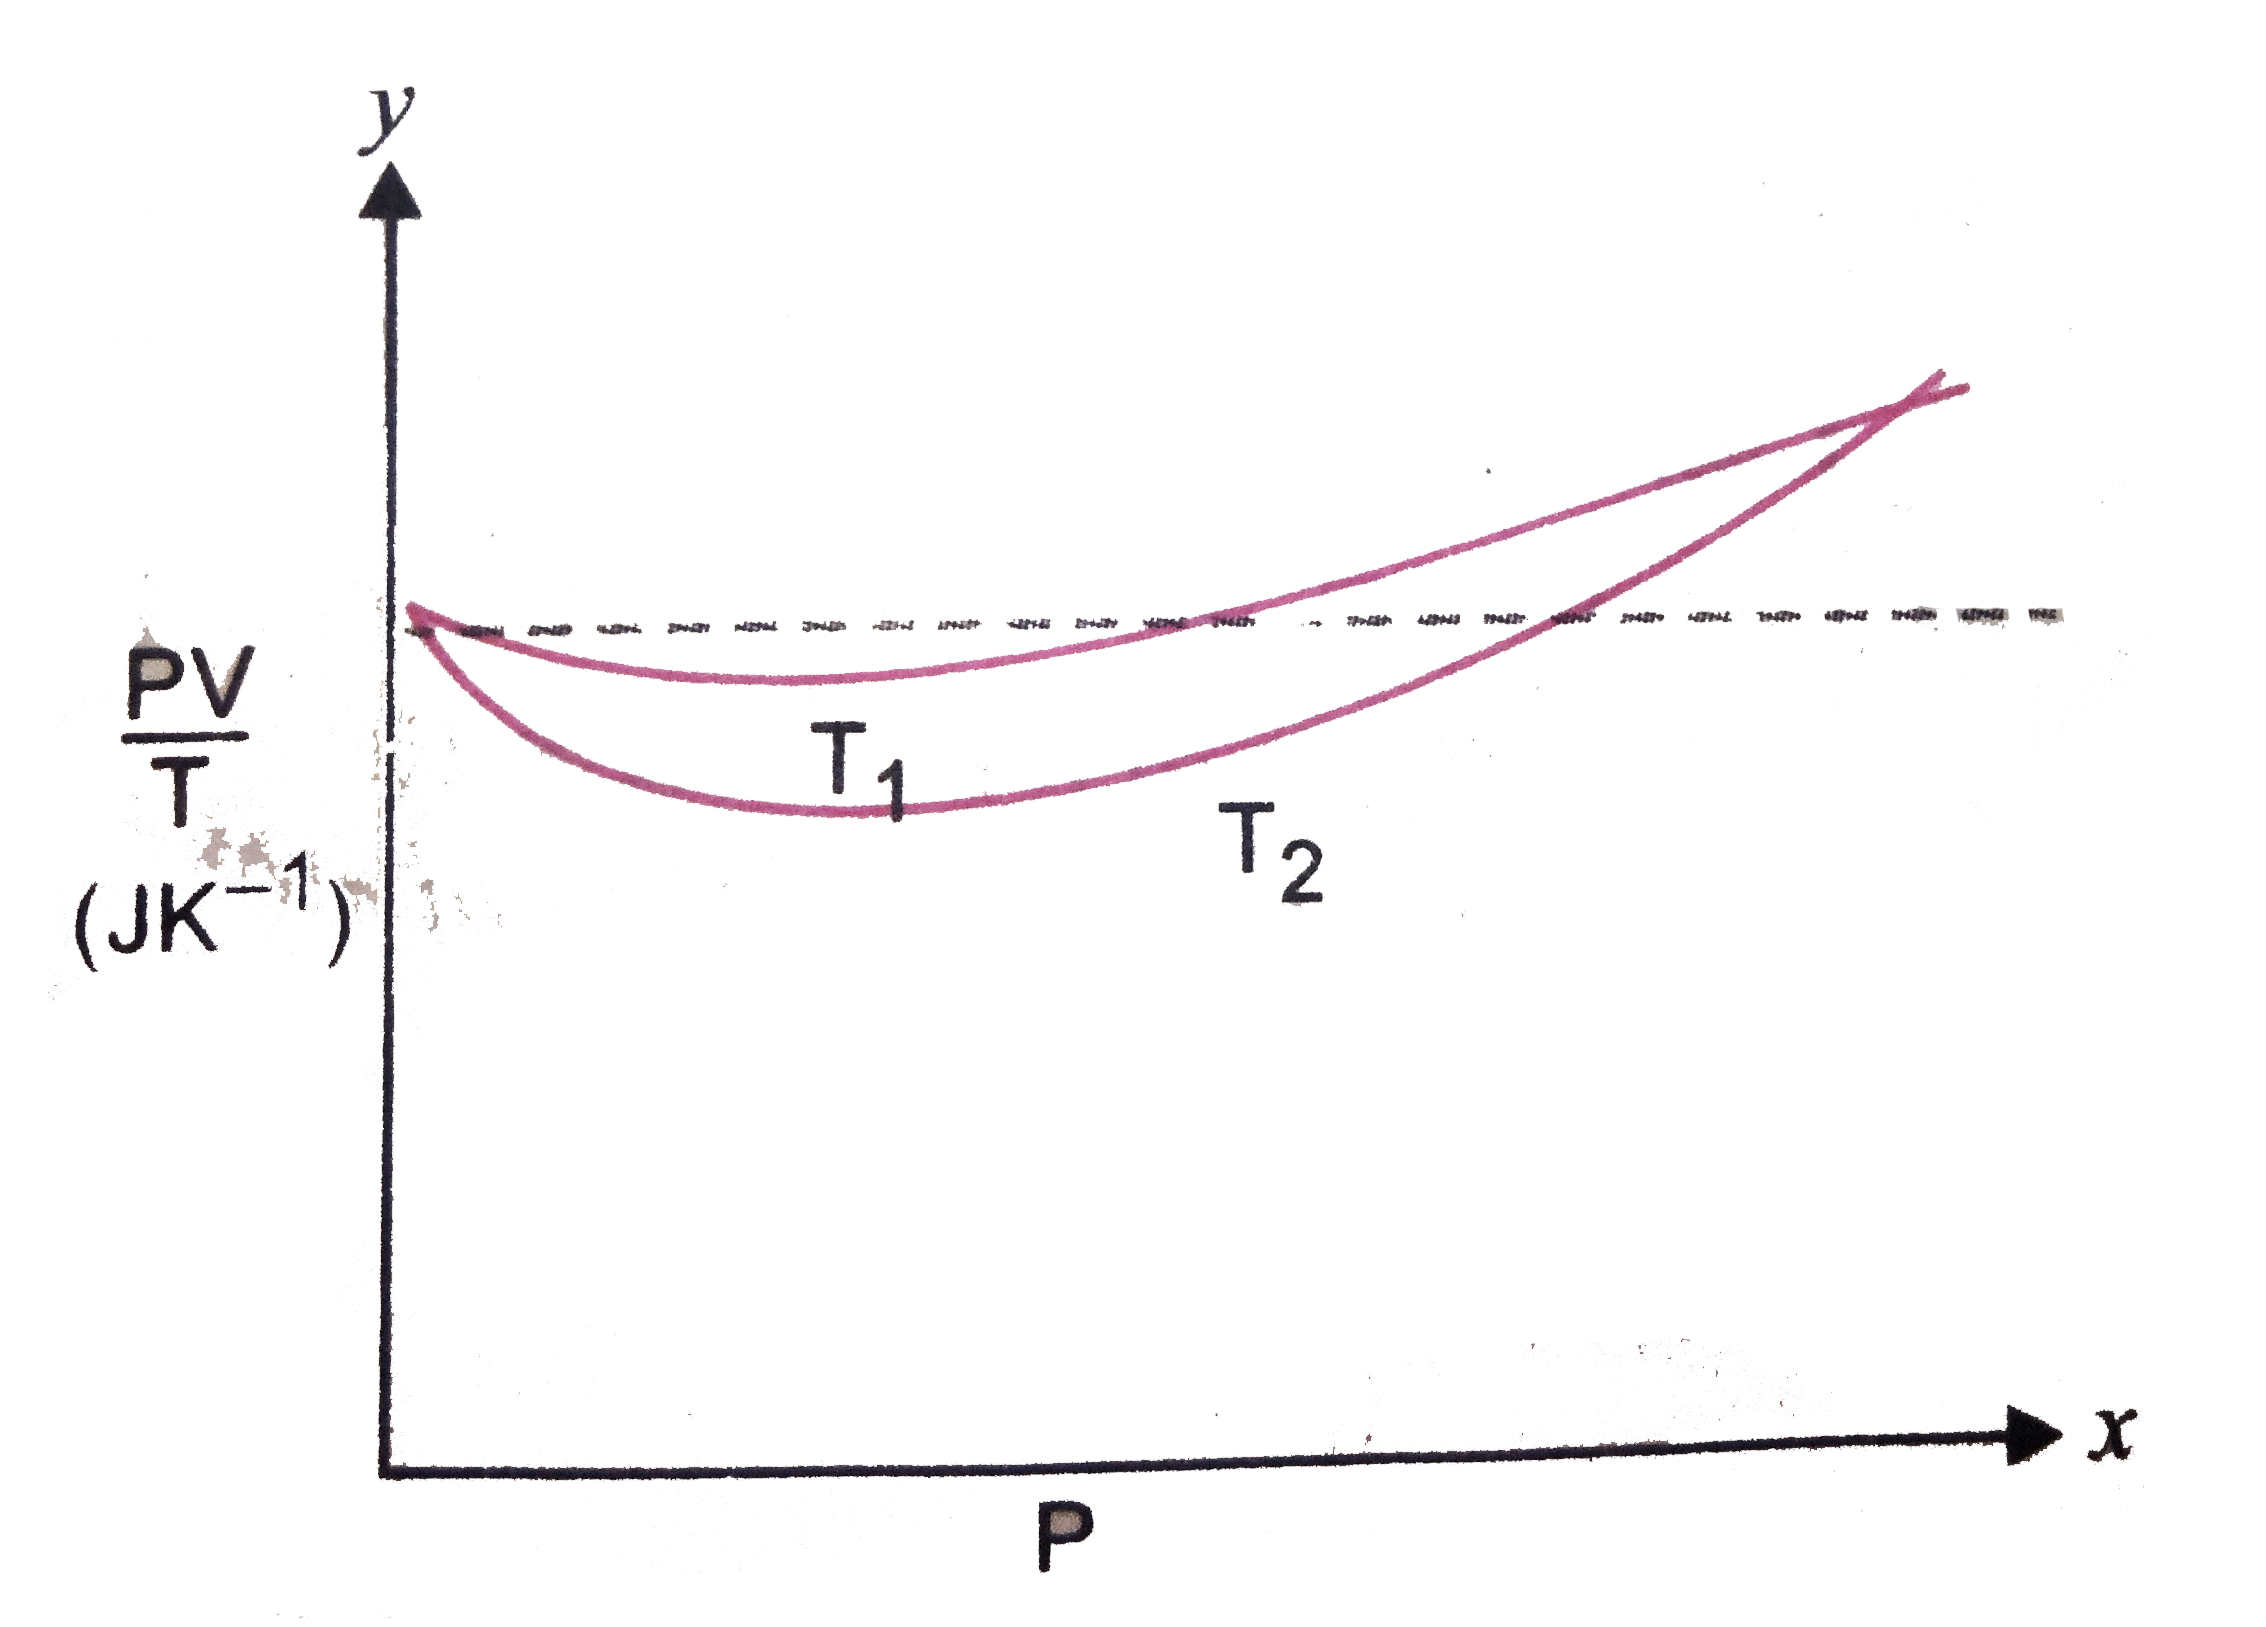
View SolutionFig shows of PV/T versus P for 1.00×10⁻³kg of oxygen gas at two different temperatures.
(a) What does the dotted plot signify ?
(b) Which is true : T1<T2orT2<T1?
( c) What is the value of PV/T where the curves meet on the Y-axis ?
(d) If we obtained similar plot for 1.00×10⁻³kg of hydrogen, would we get the same value of PV/T at the point where the curves meet on the y-axis ? If not, what mass of hydrogen yield the same value of PV/T (for low pressure high temperature region of the plot) ? (Molecular mass of H=2.02u, of O=32.0u,R=8.31Jmol−1K−1
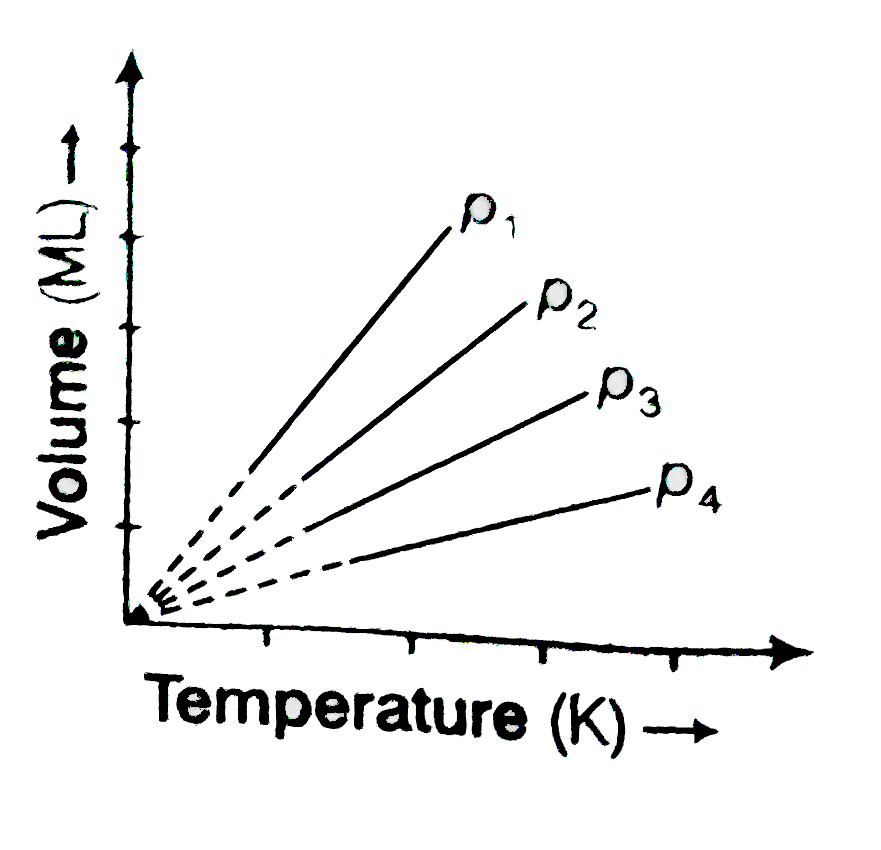
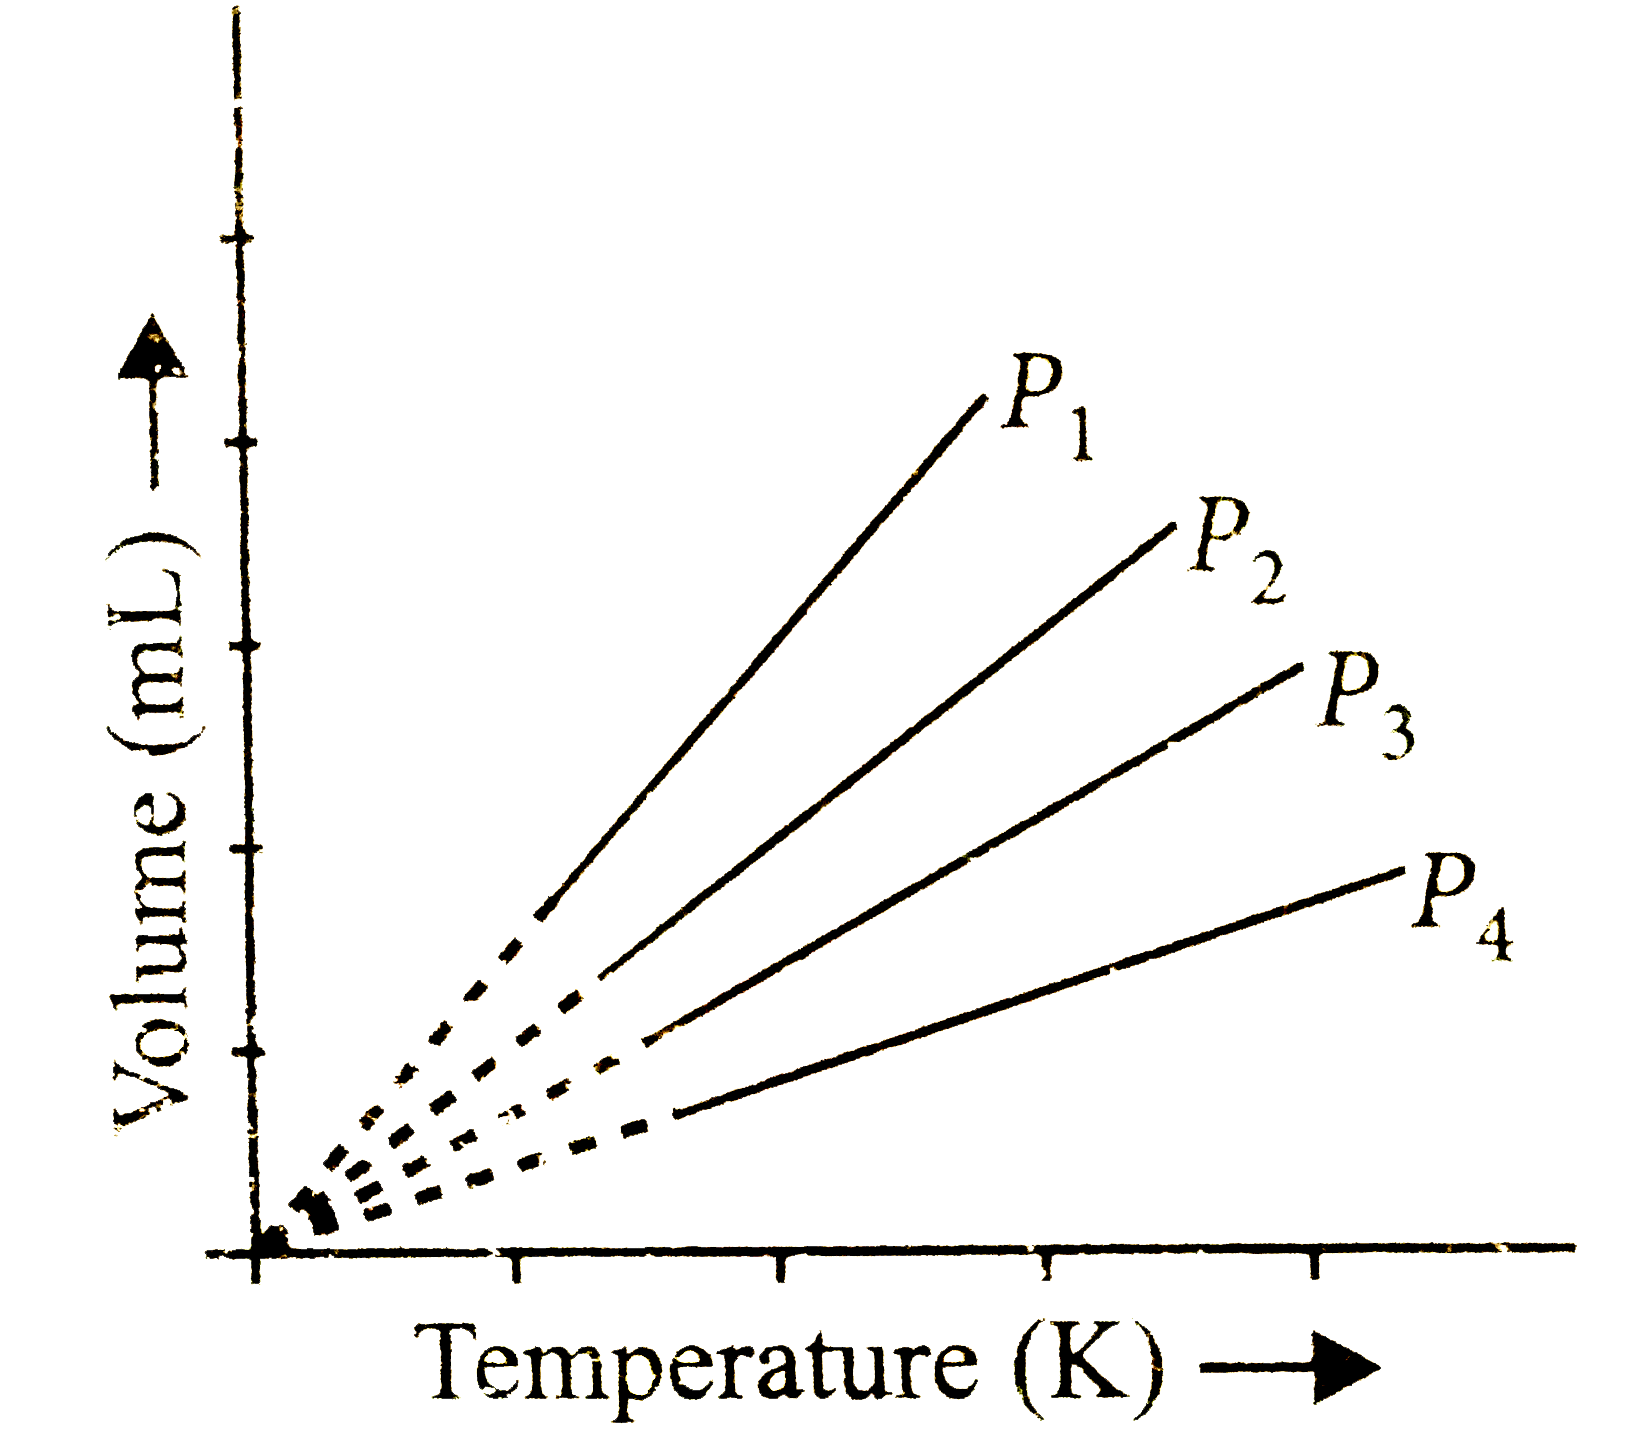
View SolutionA plot of volume (V) versus temperature (T) for a gas at constant pressure is a straight line passing through the origin. The plots at different values of pressure are shown in figure. Which of the following order of pressure is correct for this gas ?
View SolutionFigure shows plot of PV//T versus P"for" 1.00 xx 10^(-3) kg of oxygen gas at two different temperatures. (i) What does the dotted plot signify? (ii) Which is true . T_(1) gt T_(2) "or" T_(1) lt T_(2) ? (iii) What is the value of PV//T where the curves meet on the y-axis?
View SolutionFor an ideal gas. a plot of PV/RT versus T will look like
View SolutionThe figure shows the plot of PVnT vs P, for oxygen gas at two different temperatures then
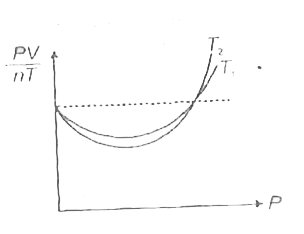
View SolutionFigure Show plot of PV/T versus P for 1.00×10⁻³ kg of oxygen gas at two different temperatures.
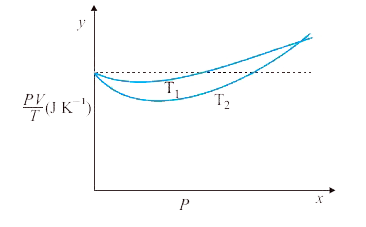
(a) What does the dotted plot signify?
(b) Which is true: T1>T2 or T1<T2?
(c) What is the value of PV/T where the curves meet on the y-axis?
(d) If we obtained similar plots for 1.00×10⁻³ kg of hydrogen, would we get the same value of PV/T at the point where the curves meet on the y-axis? If not, what mass of hydrogen yields the same value of PV/T (for low pressure high temperature region of the plot) ? (Molecular mass of H2=2.02u,ofO2=32.0u,R=8.31Jmol−1K−1.)
View SolutionFigure Show plot of PV/T versus P for 1.00×10⁻³ kg of oxygen gas at two different temperatures.
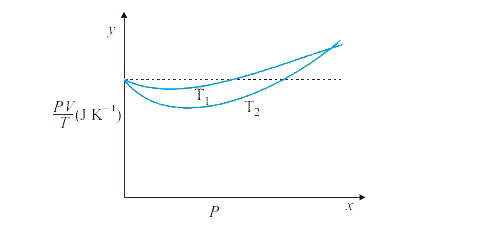
(a) What does the dotted plot signify?
(b) Which is true: T1>T2 or T1<T2?
(c) What is the value of PV/T where the curves meet on the y-axis?
(d) If we obtained similar plots for 1.00×10⁻³ kg of hydrogen, would we get the same value of PV/T at the point where the curves meet on the y-axis? If not, what mass of hydrogen yields the same value of PV/T (for low pressure high temperature region of the plot) ? (Molecular mass of H_(2) = 2.02 u, of O_(2) = 32.0 u, R= 8.31Jmol^(-1)K^(-1).)
View SolutionFigure Show plot of PV/T versus P for 1.00×10⁻³ kg of oxygen gas at two different temperatures.
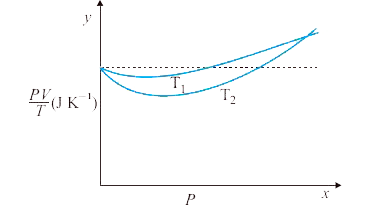
(a) What does the dotted plot signify?
(b) Which is true: T1>T2 or T1<T2?
(c) What is the value of PV/T where the curves meet on the y-axis?
(d) If we obtained similar plots for 1.00×10⁻³ kg of hydrogen, would we get the same value of PV/T at the point where the curves meet on the y-axis? If not, what mass of hydrogen yields the same value of PV/T (for low pressure high temperature region of the plot) ? (Molecular mass of H_(2) = 2.02 u, of O_(2) = 32.0 u, R= 8.31Jmol^(-1)K^(-1).)
View SolutionFigure Show plot of PV/T versus P for 1.00×10⁻³ kg of oxygen gas at two different temperatures.
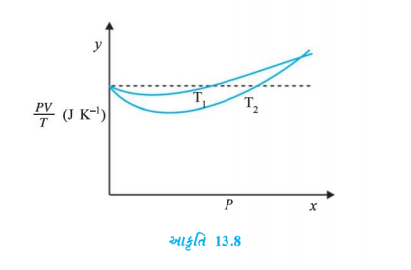
(a) What does the dotted plot signify?
(b) Which is true: T1>T2 or T1<T2?
(c) What is the value of PV/T where the curves meet on the y-axis?
(d) If we obtained similar plots for 1.00×10⁻³ kg of hydrogen, would we get the same value of PV/T at the point where the curves meet on the y-axis? If not, what mass of hydrogen yields the same value of PV/T (for low pressure high temperature region of the plot) ? (Molecular mass of H_(2) = 2.02 u, of O_(2) = 32.0 u, R= 8.31Jmol^(-1)K^(-1).)
View SolutionA plot of volume (V) versus temperature (T) for a gas at constant pressure is a straight line passing through the origin. The plots at different values of pressure are shown in figure. Which of the following order of pressure is correct for this gas ?

View SolutionFigure show plot of (PV)/(T) and P for 2gm of oxygen gas at two different temeratures. (i)The significance of dotted line (ii)The relation between T_(1) and T_(2) (iii)The value of (PV)/(T) where the curves meet on the Y-axis.
View SolutionFigure shows plot of PVT and P for 2gm of oxygen gas at two different temperatures
(i) The significance of dotted line
(ii) The relation between T1andT2
(iii) The value of PVT where the curves meet on the x-axis.
View SolutionA plot of volume (V) versus temperature (T) for a gas at constant pressure is a straight line passing through the origin . The plots at different values of pressure are shown in figure .
Which of the following order of pressure is correct for this gas ?
View Solution