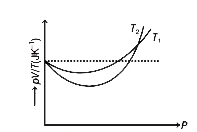
Figure shows plot of PVT and P for 2gm of oxygen gas at two different temperatures 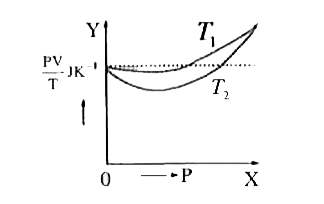
(i) The significance of dotted line
(ii) The relation between T1andT2
(iii) The value of PVT where the curves meet on the x-axis.
(i) For the dotted line, PVT= constant
It represents the behaviour of an ideal gas.
(ii) The gas equation PV=RT is true only at high temperature in fig, curves for T1 is closer to the dotted line than curve for T2
Hence the relation between T1andT2 is T1>T2
(iii) PVT=μ,R. So, the value of PVT where the curves meet on the Y-axis gives the value of μR.
In this case μ=mM=232=116
PVT=μR=116×8.31=0.519J/K
Topper's Solved these Questions
- BOOK - AAKASH SERIESCHAPTER - KINETIC THEORY OF GASESEXERCISE - Exercise -I50videos
KINETIC THEORY OF GASES
- BOOK - AAKASH SERIESCHAPTER - KINETIC THEORY OF GASESEXERCISE - Exercise -II32videos
KINETIC THEORY OF GASES
- BOOK - AAKASH SERIESCHAPTER - KINETIC THEORY OF GASESEXERCISE - EXERCISE-3(Various speed of gas molecules)10videos
KINETIC THEORY OF GASES
- BOOK - AAKASH SERIESCHAPTER - KINEMATICSEXERCISE - ADDITIONAL PRACTICE EXERCISE (PRACTICE SHEET (ADVANCED)) (Integer Type Questions)12videos
KINEMATICS
- BOOK - AAKASH SERIESCHAPTER - LAWS OF MOTIONEXERCISE - PRACTICE EXERCISE108videos
LAWS OF MOTION
Similar Questions
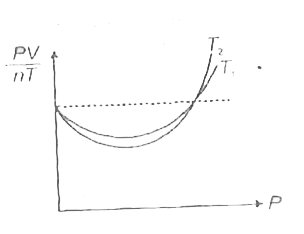
The figure shows the plot of PVnT vs P, for oxygen gas at two different temperatures then
 View Solution
Figure shows plot of PV/T versus Pfor1.00×10−3 kg of oxygen gas at two different temperatures.
(i) What does the dotted plot signify?
(ii) Which is true . T1>T2orT1<T2?
(iii) What is the value of PV/T where the curves meet on the y-axis?_E01_262_Q01.png) View Solution
View Solution
Knowledge Check
- Question 1 - Select One
The figure shows the plot of PVnT vs P, for oxygen gas at two different temperatures then
 AT1>T2BT2>T1CT1=T2Dmay be (1) & (2)
 - Question 2 - Select One
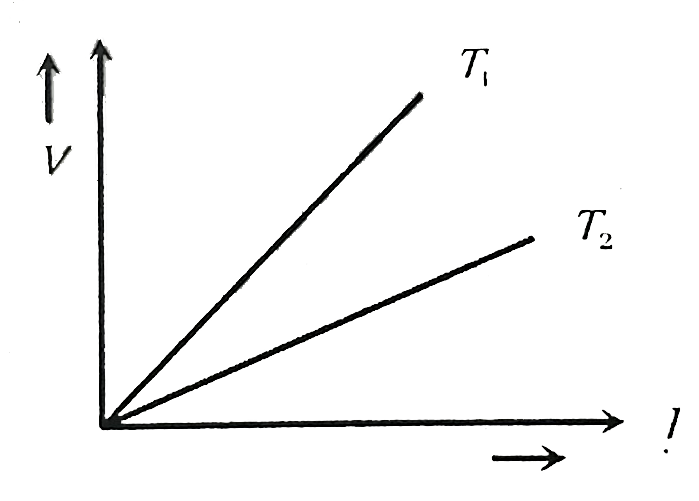
The voltage V and current I graph for a conductor at two different temperatures T1 and T2 are shown in the figure. The relation between T1 and T2 is
 AT1>T2BT1≈T2CT1=T2DT1<T2
 - Question 3 - Select One
The voltage V and current I v graphs for a conductor at two different temperatures T1andT2 are shown in the figure. The relation between T1andT2 is
 AT1>T2BT1<T2CT1=T2DT1=1T2
Figure shows plot of PV/T versus Pfor1.00×10−3 kg of oxygen gas at two different temperatures.
(i) What does the dotted plot signify?
(ii) Which is true . T1>T2orT1<T2?
(iii) What is the value of PV/T where the curves meet on the y-axis?_E01_262_Q01.png) View Solution
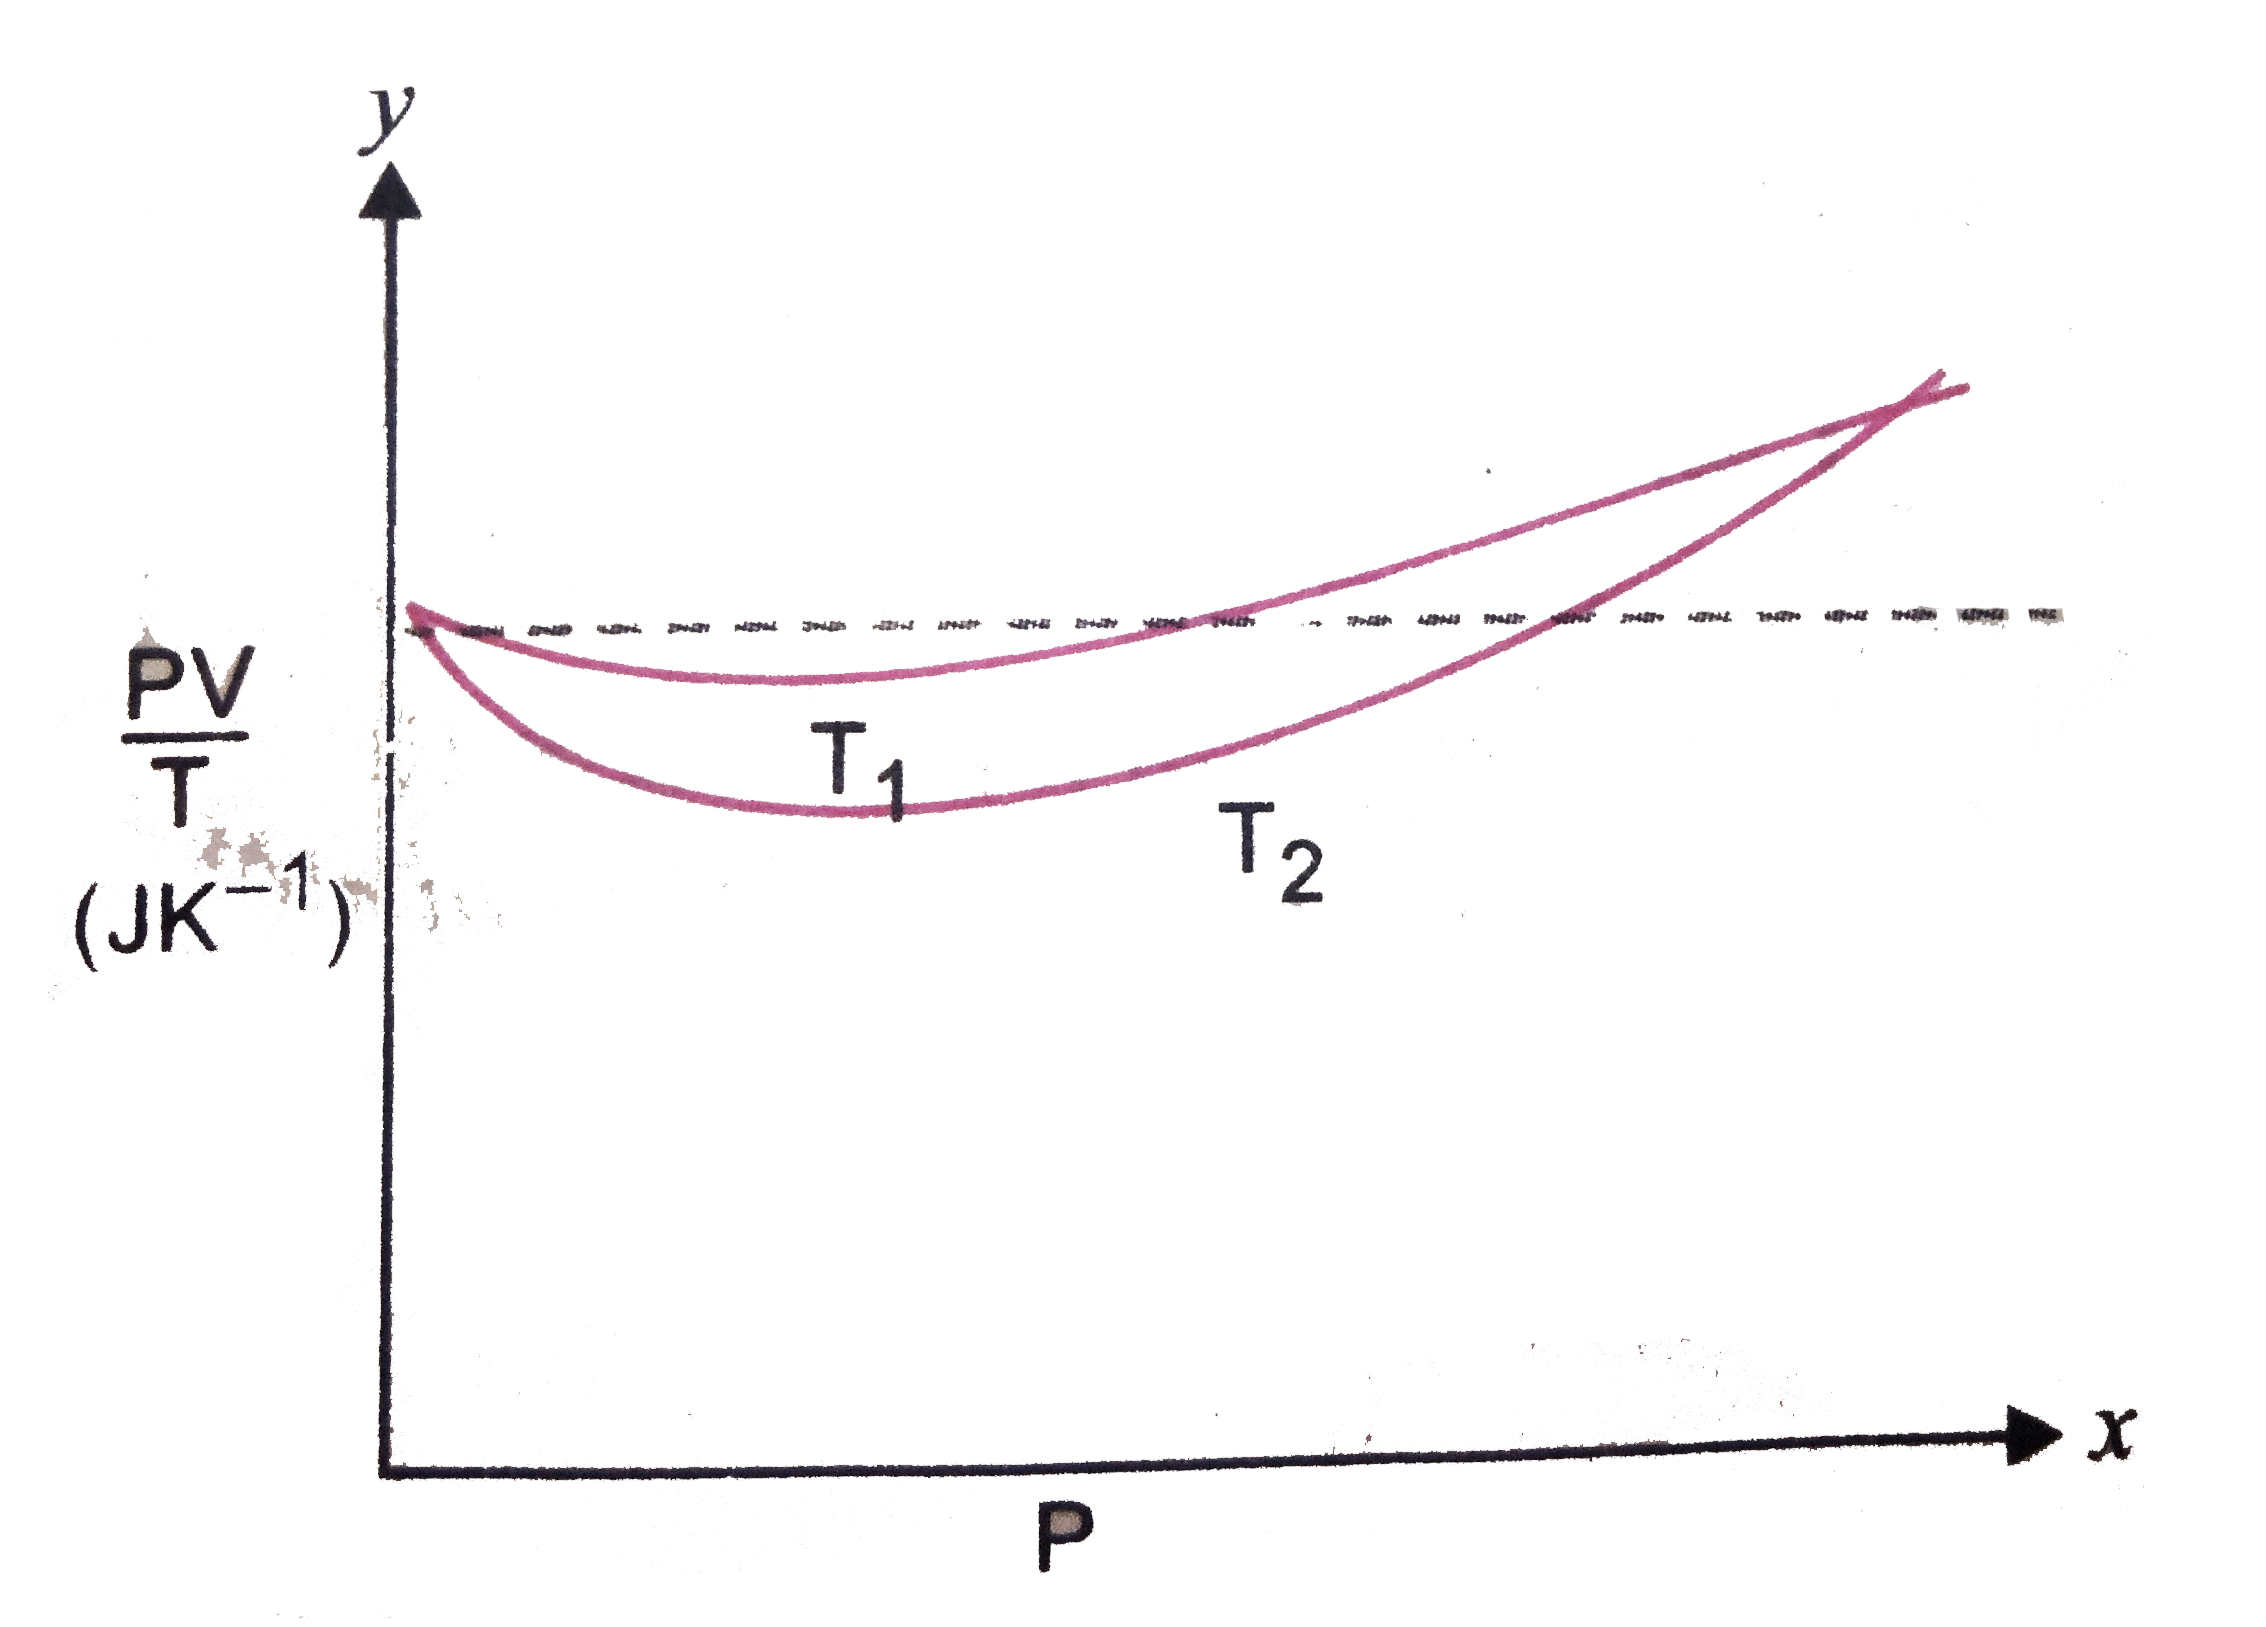
View SolutionFig shows of PV/T versus P for 1.00×10⁻³kg of oxygen gas at two different temperatures.
(a) What does the dotted plot signify ?
(b) Which is true : T1<T2orT2<T1?
( c) What is the value of PV/T where the curves meet on the Y-axis ?
(d) If we obtained similar plot for 1.00×10⁻³kg of hydrogen, would we get the same value of PV/T at the point where the curves meet on the y-axis ? If not, what mass of hydrogen yield the same value of PV/T (for low pressure high temperature region of the plot) ? (Molecular mass of H=2.02u, of O=32.0u,R=8.31Jmol−1K−1
 View Solution
If lines T1andT2 touch the curve y=x2−3x+2 at the points where the curve meets the X- axis, then
View SolutionThe voltage V and current I v graphs for a conductor at two different temperatures T1andT2 are shown in the figure. The relation between T1andT2 is
 View Solution
The figure shows the graph of pVT versus p for 2×10⁻⁴ kg of hydrogen gas at two different temperatures, where p,V andT represents pressure, volume and temperature respectively. Then, the value of pVT where the curve meet on the vertical axis, is
 View Solution
