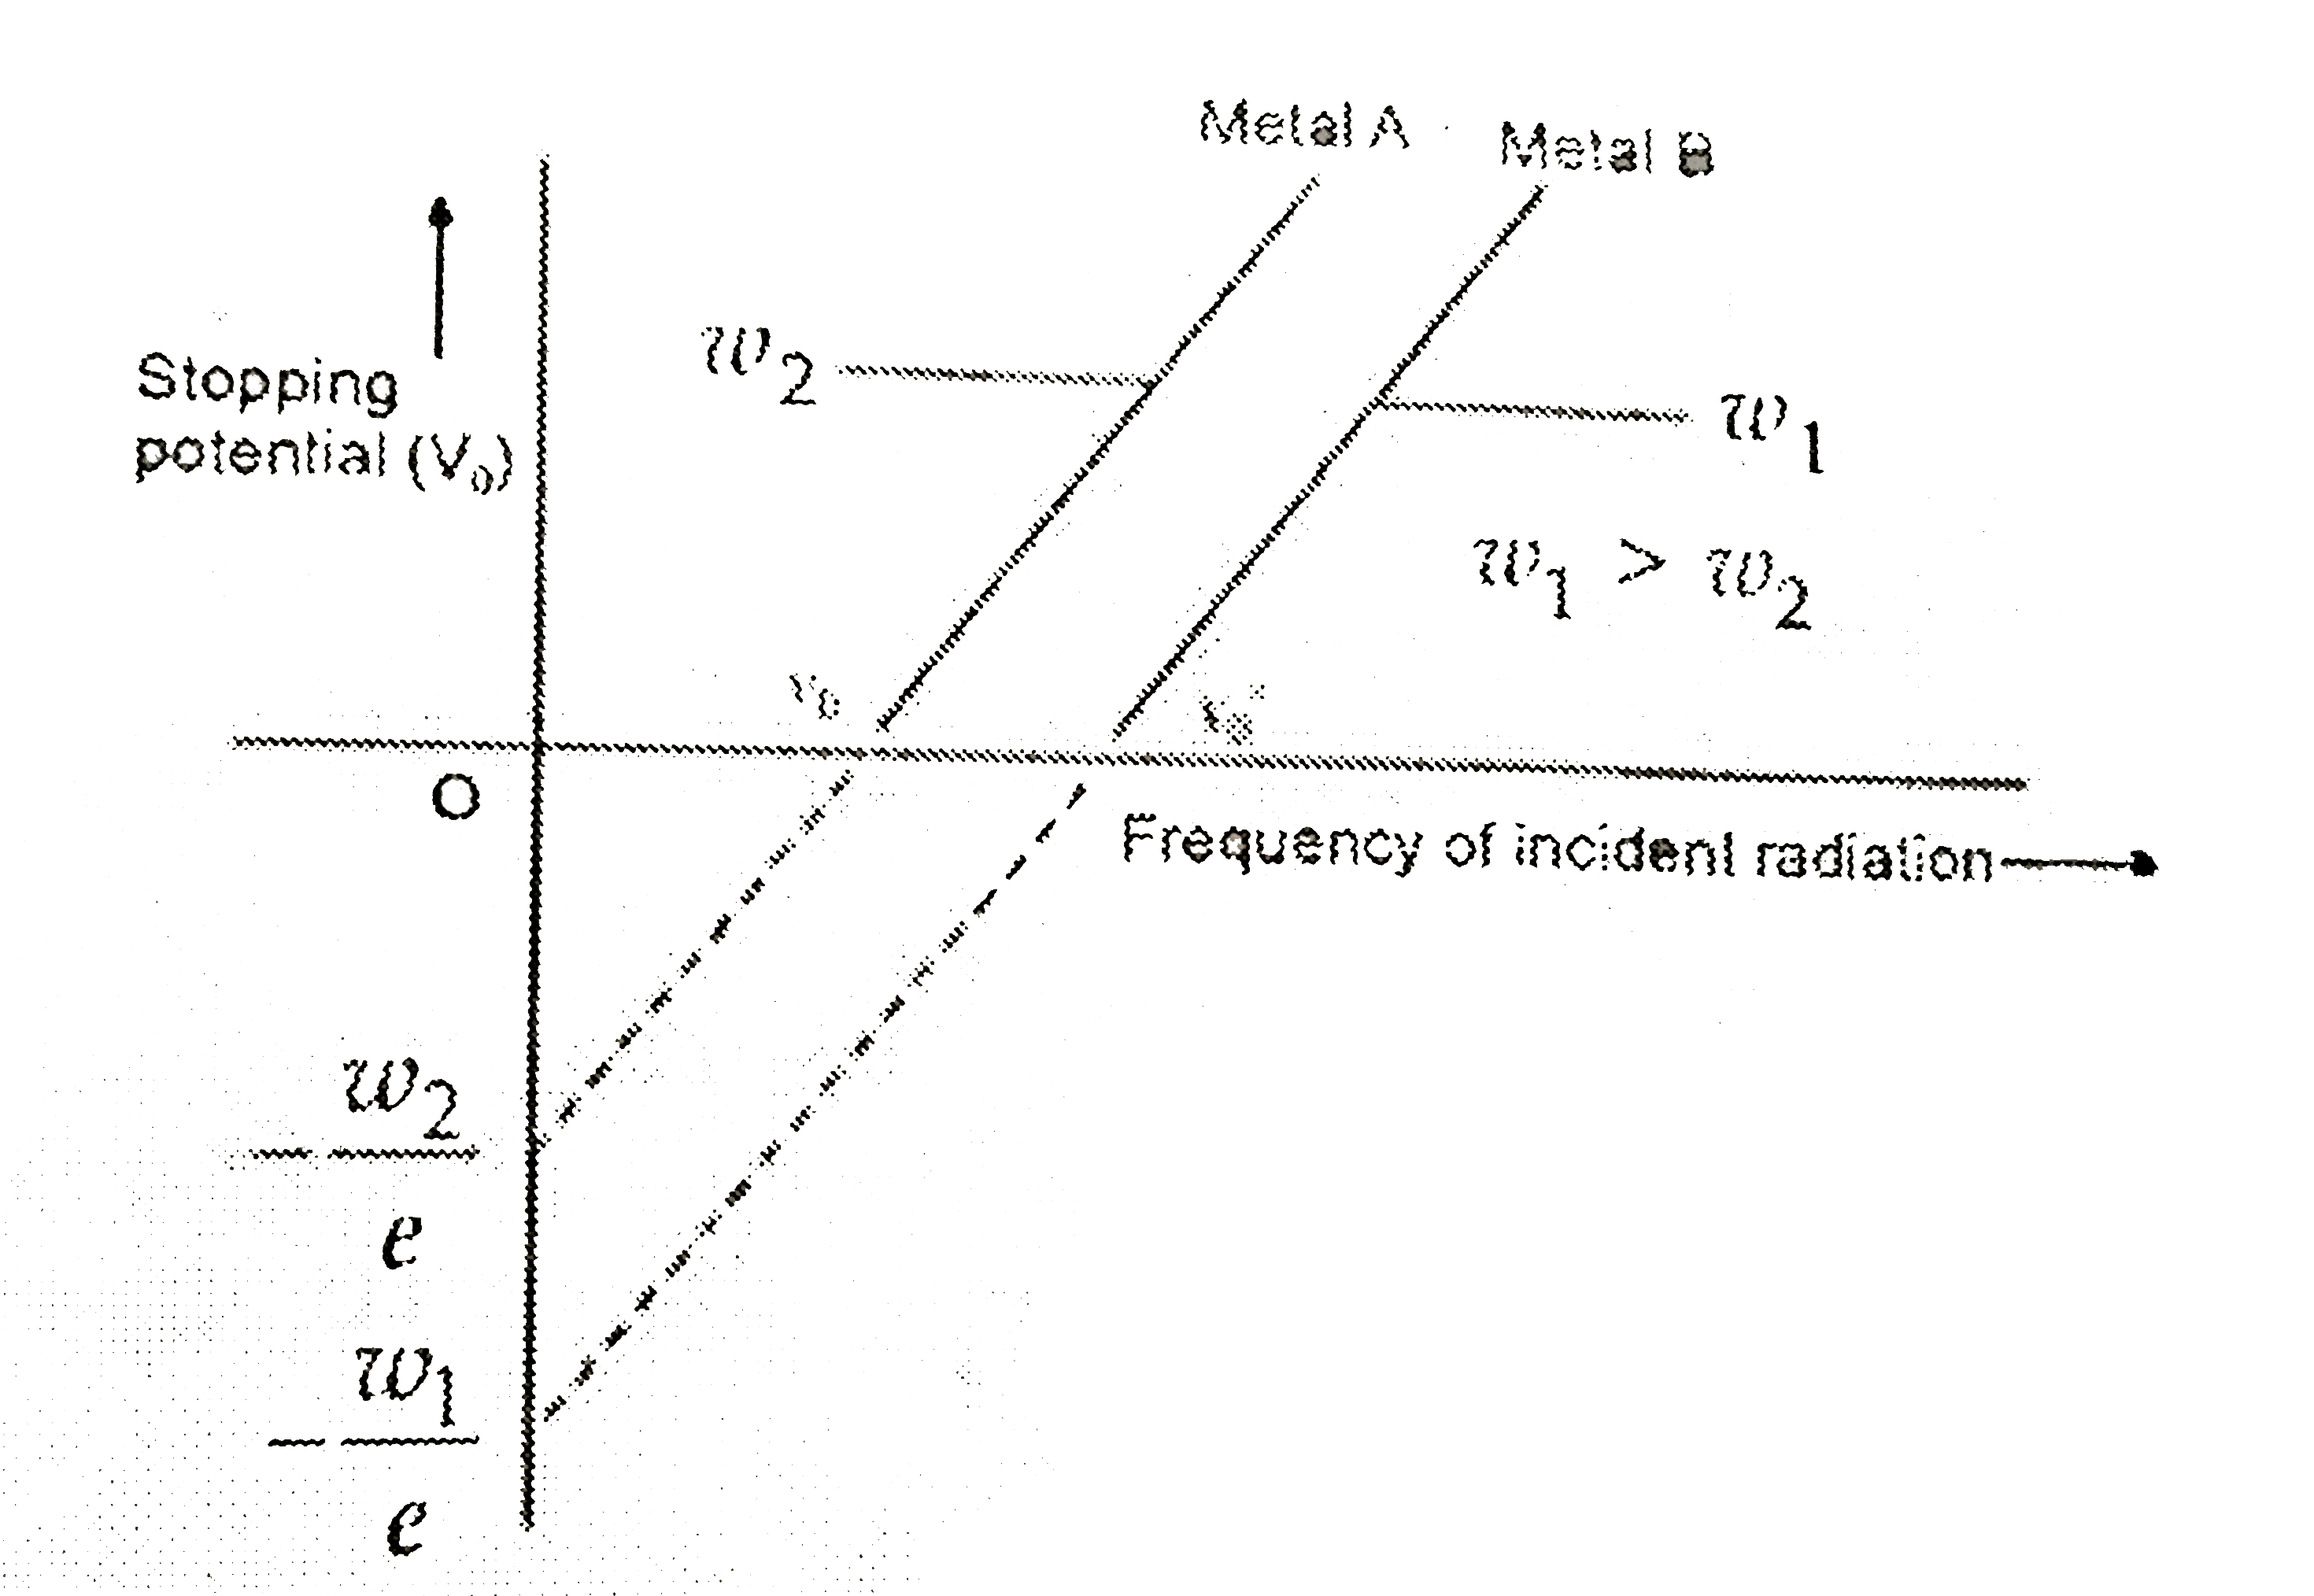
Plot a graph showing the variation of stopping potential with the frequency of incident radiation for two different photosensitive having work functions . On what factors does the (i) slope and (ii) intercept of the lines depend ?
The graph showing the variation of stopping potential with the frequency of incident radiation for two different photosensitive materials having work functions and is shown in fig.
(i) Slope of the line .
Slope of the line depends on the Plank's constant h and the electronic charge e.
(ii) Intercept of graph A on the potential axis
.
Intercept of the line depends upon Planck's constant h, threshold frequency and the electronic charge (e).

Topper's Solved these Questions
- XII BOARDSBOOK - XII BOARDS PREVIOUS YEARCHAPTER - XII BOARDSEXERCISE - SET-II
35 Videos
- XII BOARDSBOOK - XII BOARDS PREVIOUS YEARCHAPTER - XII BOARDSEXERCISE - SET-III
25 Videos
- XII BOARDSBOOK - XII BOARDS PREVIOUS YEARCHAPTER - XII BOARDSEXERCISE - SET III
9 Videos
- SAMPLE PAPER 2019BOOK - XII BOARDS PREVIOUS YEARCHAPTER - SAMPLE PAPER 2019EXERCISE - SECTION D
6 Videos
Similar Questions
Plot a graph showing the variation of stopping potential with the frequency of incident radiation for two different photosensitive materials having work functions W1andW2(W1>W2). On what factors does the (i) slope and (ii) intercept of the lines depend ?
View SolutionSketch the graphs showing variation of stopping potential with frequency of incident radiations for two photosensitive materials A and B having threshold frequencies vA>vB.
(i) In which case is the stopping materials A and B having threshold frequencies vA>VB.
(i) In which case is the stopping potential more and why?
(ii) Does the slope of the graph depend on the nature of the materials used ? Explain.
View Solution
Knowledge Check
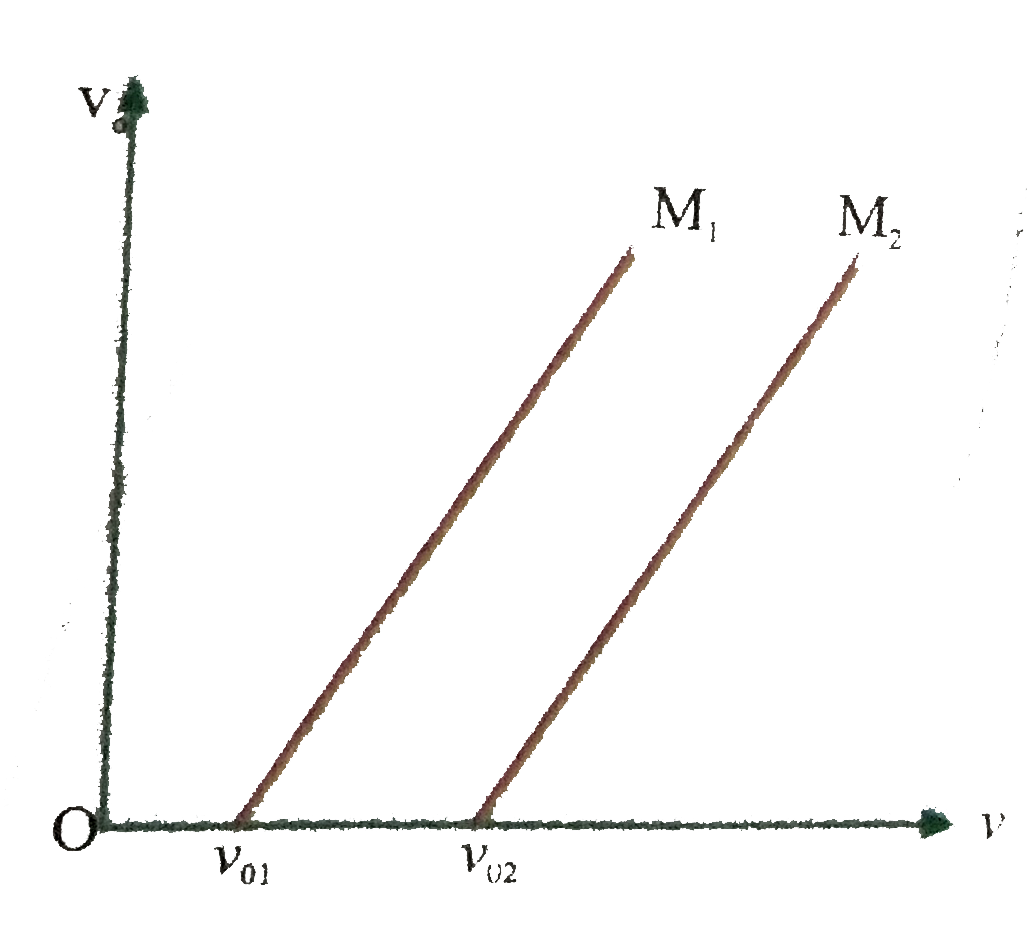
Figure show the variation of the stopping potential (V0) with the frequency (v) of the incident radiations for two different photosensitive matererial M1 and M2 What are the values of work functions for M1 and M2 respectively
 Ahv01,hv02Bhv02,hv01Chv01,hv01Dhv02,hv02
Draw a graph showing the variation of stopping potential with frequency of the incident radiation. What does the slope of the line with frequency axis indicate? What information can be obtained from the values of intercept on the potential axis?
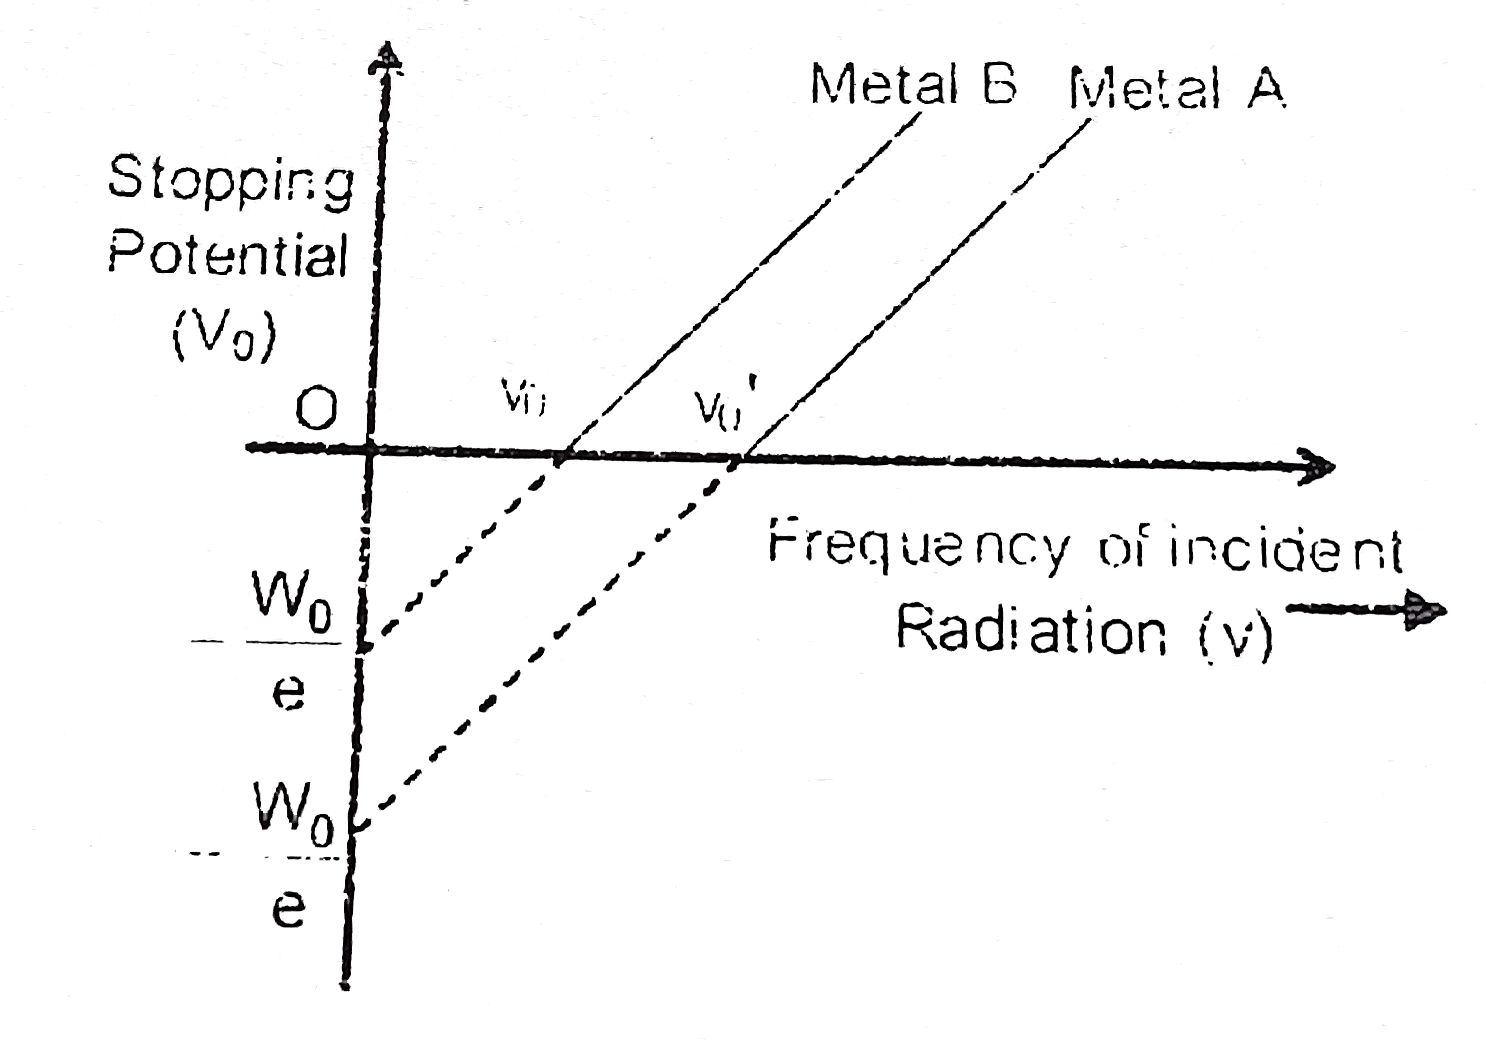
View SolutionThe graph shows variation of stopping potential V0 versus frequency of incident radiation v for two photosensitive metals A and B. Which of two metals has higher threshold frequency and why?

View SolutionThe graph shows variation of stopping potential V0 versus frequency of incident radiation v for two photosensitive metals A and B. Which of two metals has higher threshold frequency and why?

View SolutionSketch the graphs, showing the variation of stopping potential Vs with frequency v of the incident radiations for two photosensitive materials A and B having threshold frequencies v0>v'0 respectively.
(i) which of the two metals A or B has higher work function?
(ii) What information do you get from the slope of the graphs?
(iii) What does the value of the intercept of graph A on the potential axis represent?
View SolutionThe variation of the stopping potential (V0) with the frequency (v) of the light incident on two different photosensitive surfaces M1andM2 is shown in the figure. Identify the surfaces which has greater value of the work function.

View SolutionPlot a graph showing variation of stopping potential (V0) with the frequency (v) of the incident radiation for a given photosensitive material. Hence, state the significance of the threshold frequency in photoelectric emission.
Using the principle of energy conservation, write the equation relating the energy of incident photon, threshold frequency and the maximum kinetic energy of the emitted photoelectrons.
View Solution
