Consider the frequency distribution table (Table 14.3, Example 4, Chapter 14), which gives the weights of 38 students of a class. (i) Find the probability that the weight of a student in the class lies in the interval 46-50 kg. (ii) Give two eve
we can add only in 35.5 to 40.5 class.
Topper's Solved these Questions
- STATISTICSBOOK - NCERT ENGLISHCHAPTER - STATISTICSEXERCISE - EXERCISE 14.3
9 Videos
- STATISTICSBOOK - NCERT ENGLISHCHAPTER - STATISTICSEXERCISE - EXERCISE 14.1
2 Videos
- STATISTICSBOOK - NCERT ENGLISHCHAPTER - STATISTICSEXERCISE - Exercise 14.2
9 Videos
- QUADRILATERALSBOOK - NCERT ENGLISHCHAPTER - QUADRILATERALSEXERCISE - Exercise 8.2
7 Videos
- SURFACE AREAS AND VOLUMESBOOK - NCERT ENGLISHCHAPTER - SURFACE AREAS AND VOLUMESEXERCISE - Exercise 13.9
3 Videos
Similar Questions
The following table gives the ages of 50 students of a class. Find the arithmetic mean of their ages.
View SolutionThe weights of 25 students of a class are given in the following table:

Using short-cut method, find the mean weight.
View SolutionRefer to Example 5, Section 14.4, Chapter 14. Find the probability that a student of the class was born in August.
View SolutionThe mean weigth of 30 students of a class is 60.2kg . Two students of weights of 50 kg and 67 kg left the class . Find the mean weight of the remaining students
View SolutionRefer to Table 14.7, Chapter 14.(i) Find the probability that a student obtained less than 20% in the mathematics test.(ii) Find the probability that a student obtained marks 60 or above.
View SolutionFollowing frequency distribution given the weights of 38 students of a class: Weight in Kg: 31-35 36-40, 41-45, 46-50, 51-55, 56-60 61-65, 66-70 71-75 No. of students 9 5 14 3 1 2 2 1 1 Find the probability that weight of a student in the class is: (i)at most 60 kg (ii)at least 36 kg (iii)not more than 50kg. Also define two events in this context, one having probability 0 and the other having probability 1.
View SolutionIn Q.1, Exercise 14.2, you were asked to prepare a frequency distribution table regarding the blood groups of 30 students of a class. Use this table to determine the probability that a student of this class, selected at random, has blood group AB.
View SolutionThe mean weight of 60 students in a class is 40 kg. The mean weight of boys is 50 kg while that of girls is 30 kg. Find the number of boys and girls in the class.
View SolutionThe following data gives the weights of 30 persons (in kg)
70.0,69.4,49.4,64.5,59.4,72.4,47.5,48.8,62.3,64.2,66.8,70.3,71.3,56.3,52.7,66.6,59.9,64.7,44.6,60.3,50.3,54.3,62.3,56.3,45.0,45.7,49.8,60.5,67.8,50.1,
(i) Construct a frequency distribution such that the last class is 72-76.
(ii) State the upper class limits of last three class intervals.
(iii) State the maximum weight that can be included in the fourth class interval.
(iv) State the class mark of each of the classes.
(v) Find the range of the given weights.
(vi) If 60kg is the weight of a person then in which class interval, it will be taken.
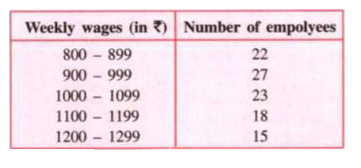
View SolutionThe table , given below , shows the frequency distributions of the weekly wages of the employee of a company:

Find :
(i) the lower limit of the fourth class.
(ii) the upper limit of the fifth class.
(iii) the class boundaries of the second class.
(iv) the class mark of the first class.
(v) the class size of the third class.
(vi) cumulative frequency of the fourth class.
View Solution

