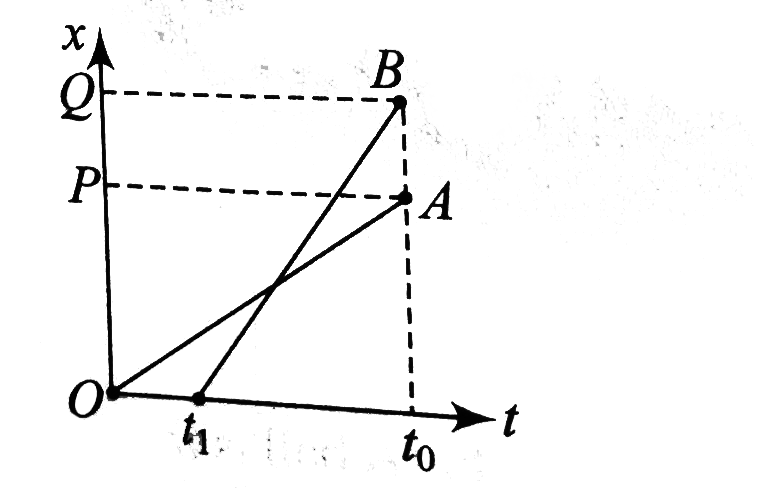
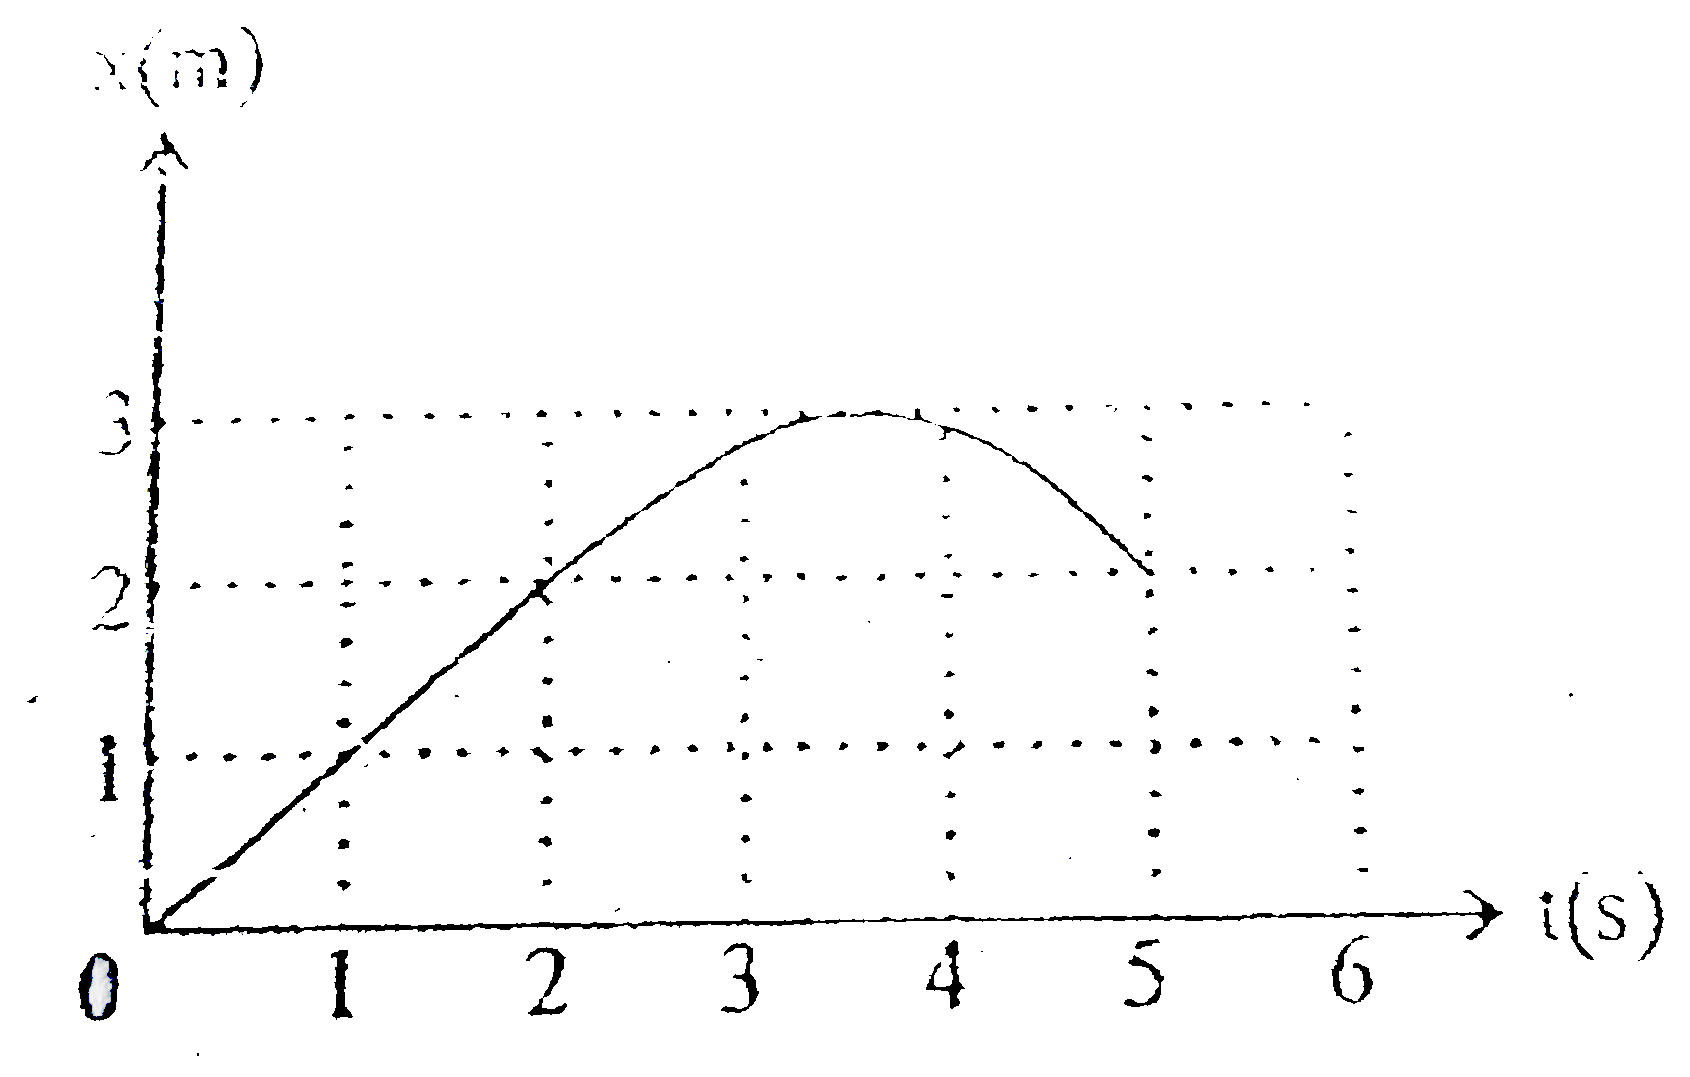
The position-time (x-t) graphs for two children A and B returning from their school O to their homes P and Q respectively along straight line path (taken as x-axis) are shown in figure. Choose the correct statement (s):
(a) A lives closer to school than B.
(b) A starts from school earlier than B.
(c) B walks faster than A.
(d) A and B reach home at the same time.
(e) B overtakes A once on the road.
Explanation:(a) In the given x–t graph, it can be observed that distance OP lt OQ. Hence, the distance of school from the A’s home is less than that from B’s home.
(b) In the given graph, it can be observed that for x = 0, t = 0 for A, whereas for x = 0, t has some finite value for B. Thus, A starts his journey from school earlier than B.
(c) In the given x–t graph, it can be observed that the slope of B is greater than that of A. Since the slope of the x–t graph gives the speed, a greater slope means that the speed of B is greater than the speed A.
(d) It is clear from the given graph that both A and B reach their respective homes at the same time.
(e) B moves later than A and his/her speed is greater than that of A. From the graph, it is clear that B overtakes A only once on the road.
Topper's Solved these Questions
Similar Questions
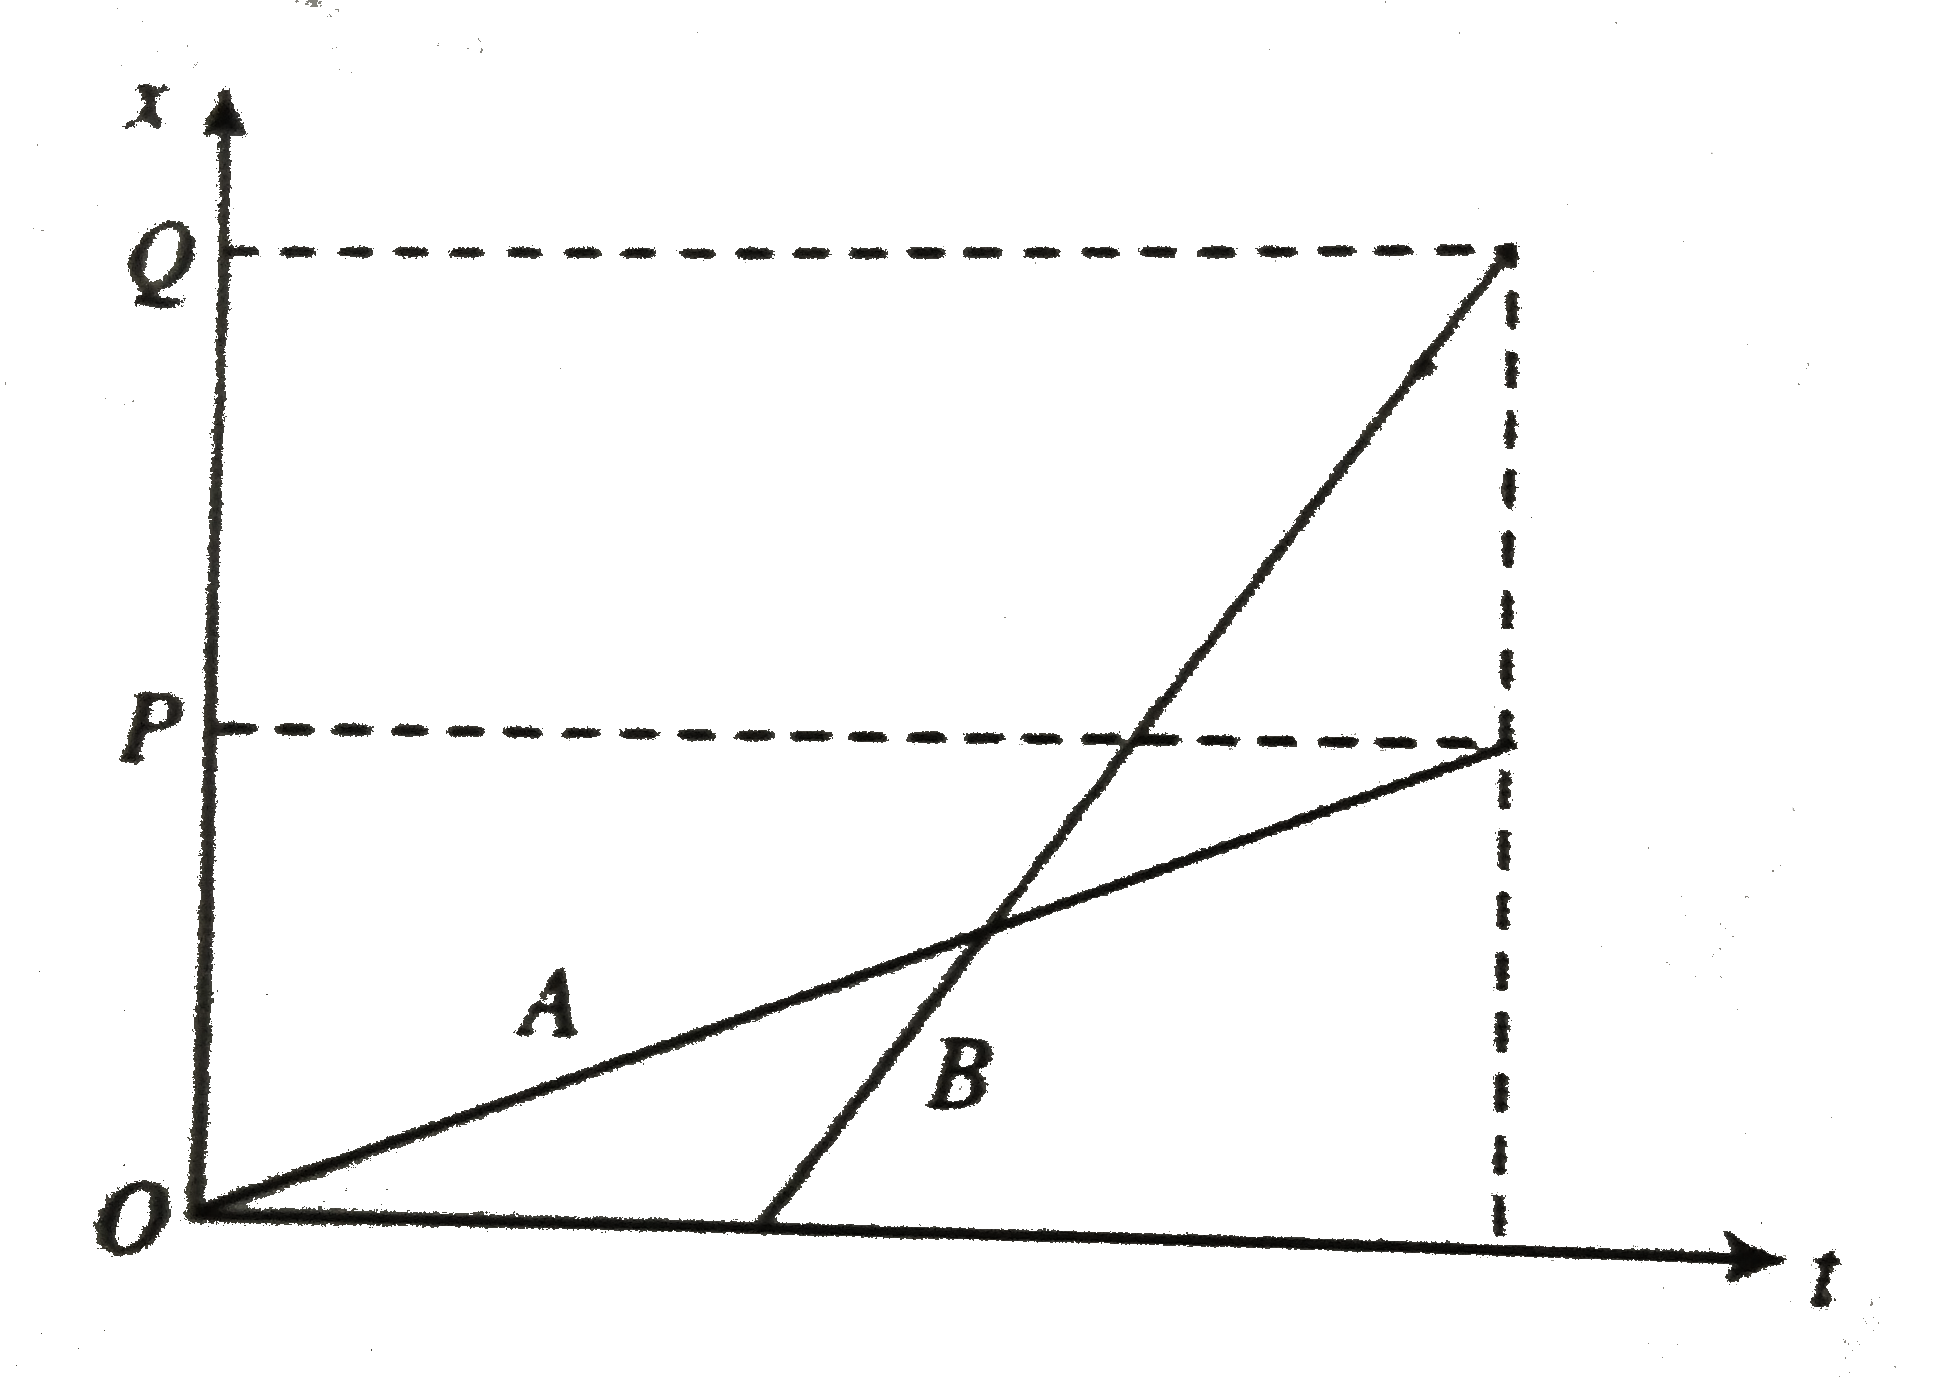
The position-time (x-t) graphs for two children A and B returning from their school O to their homes P and Q, respectively, are shown in . Choose the correct entries in the brackets
 .
.
a.(A/B) Iives closer to school than (B/A).
b. (A/B) starts from the school earlier than (B/A).
c. (A/B) walks faster than (B/A).
d. A and B reach home at the (same//differnt) time.
e. (A//B) overtakes on the road (once//twice).
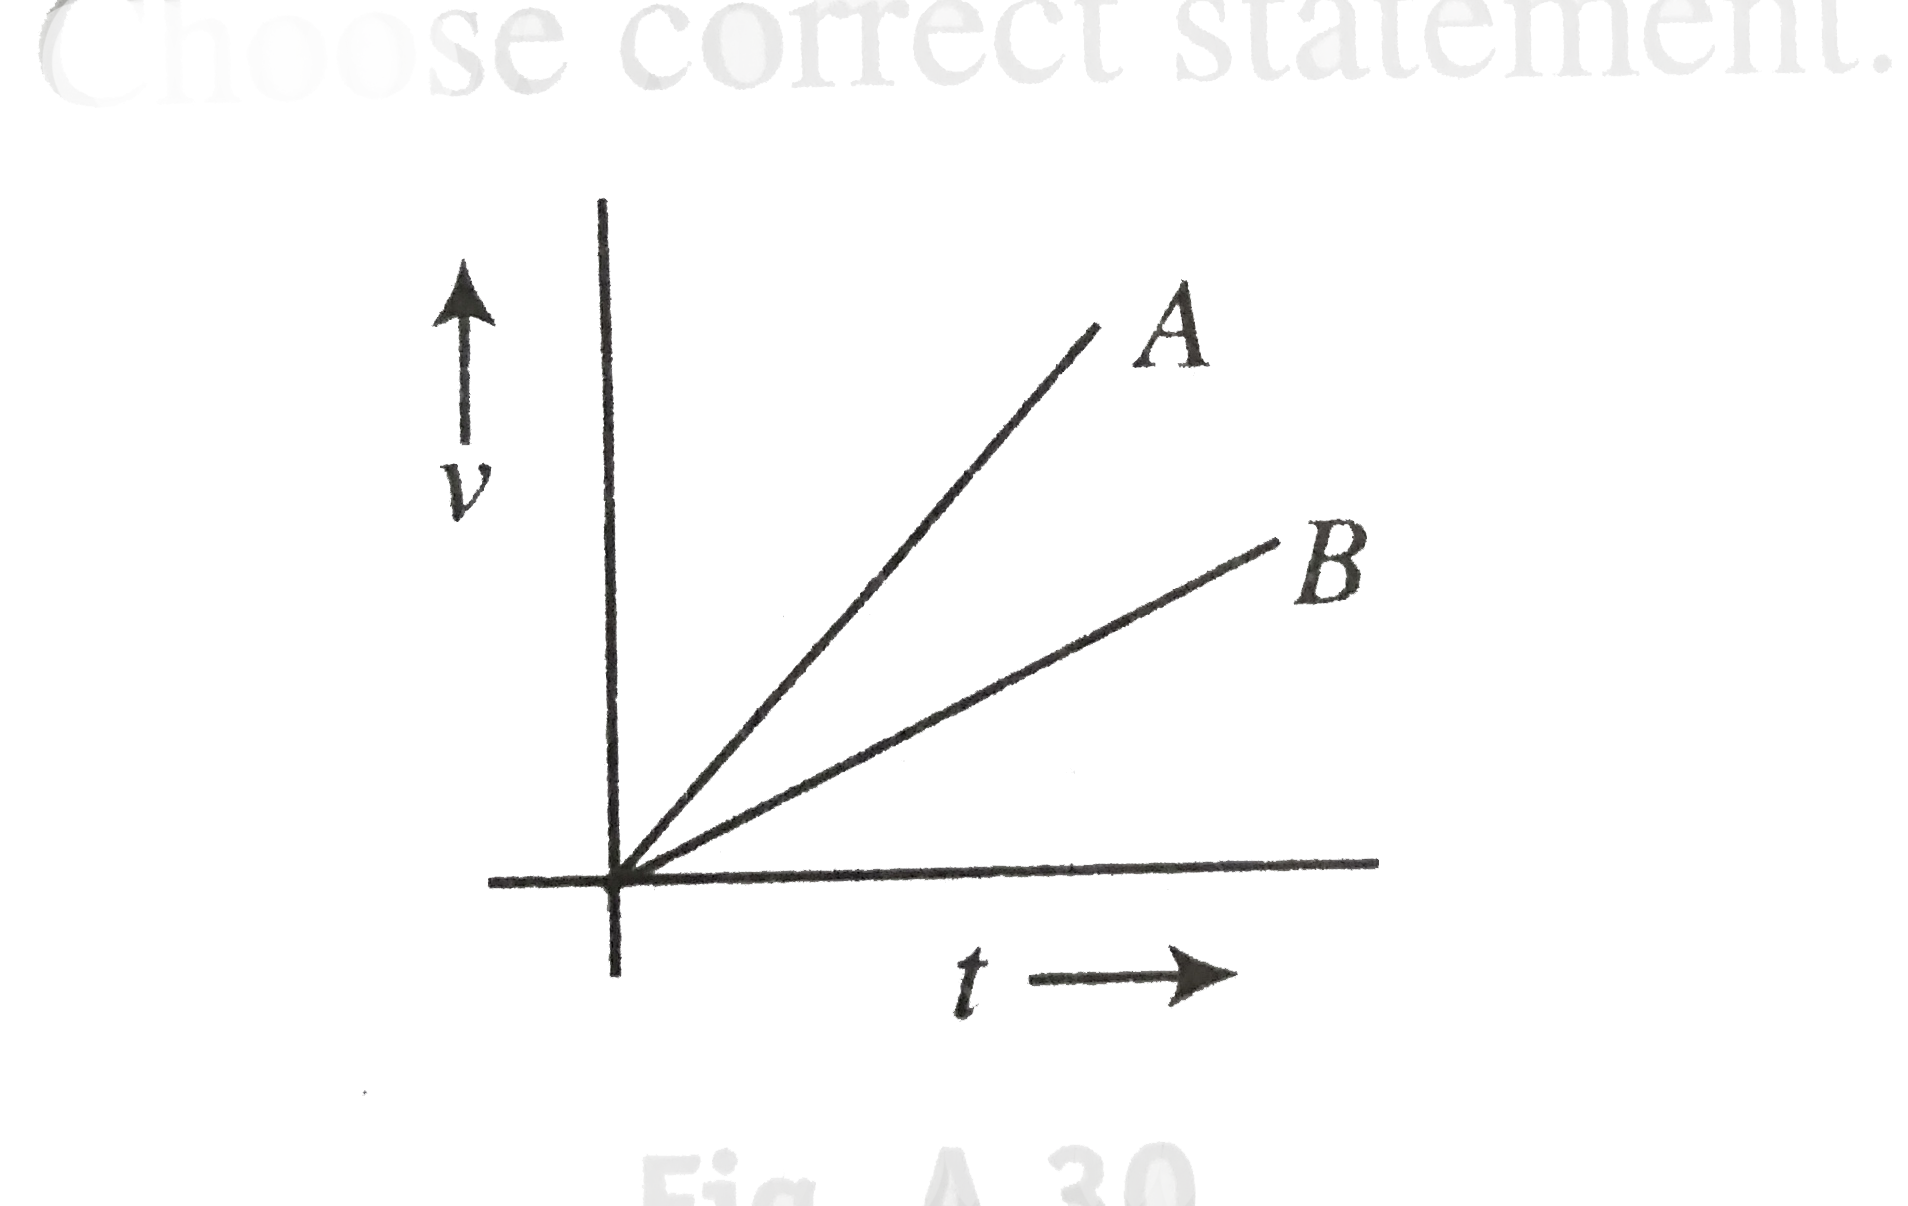
View SolutionThe velocity - time graph of two bodies A and B is shown in figure. Choose correct statement.
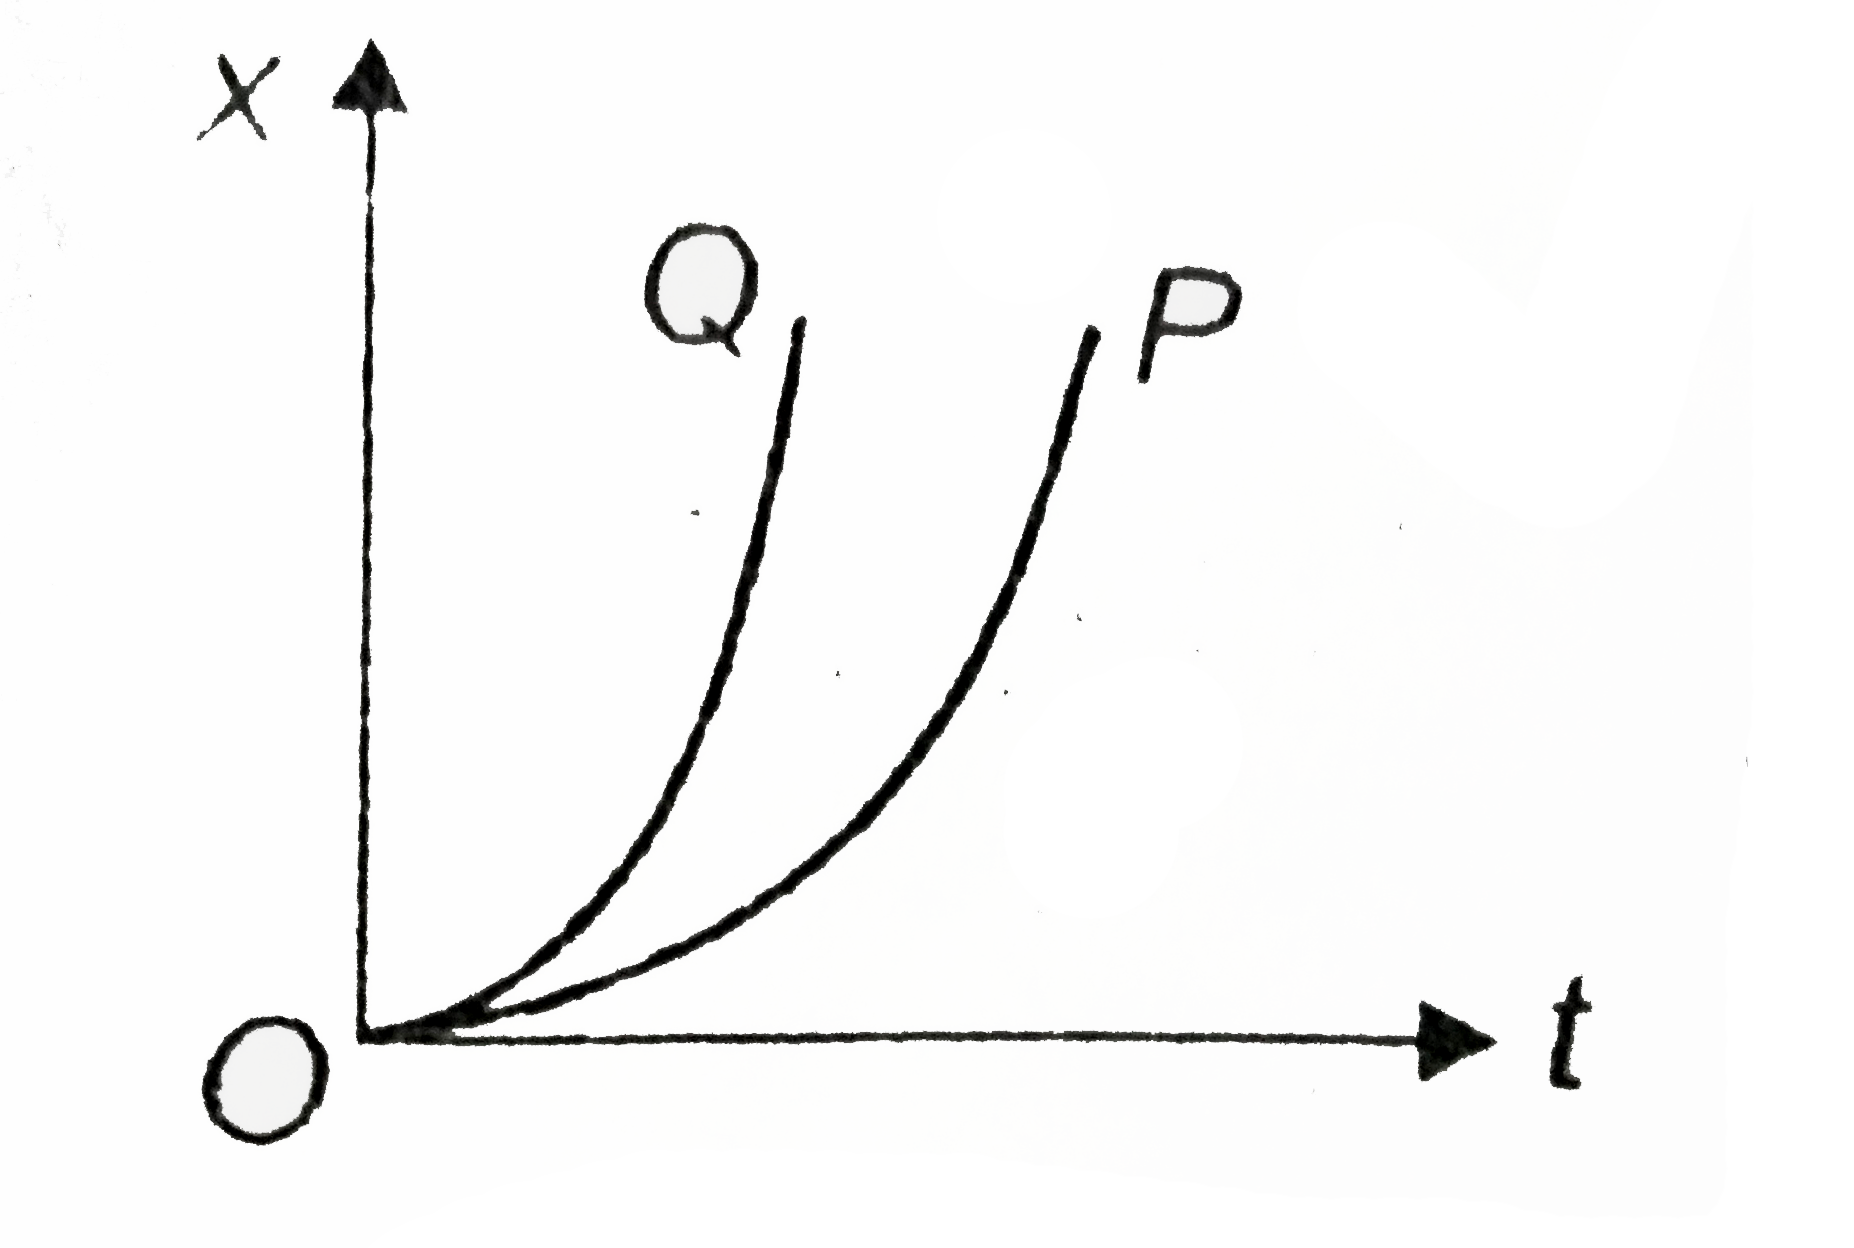
View SolutionThe position-time graph for two particles P and Q moving on x-axis is shown in the figure. Then
View SolutionFor a particle moving along x-axis, a scaled x-6 graph is shown in figure. Mark the correct statement (s).
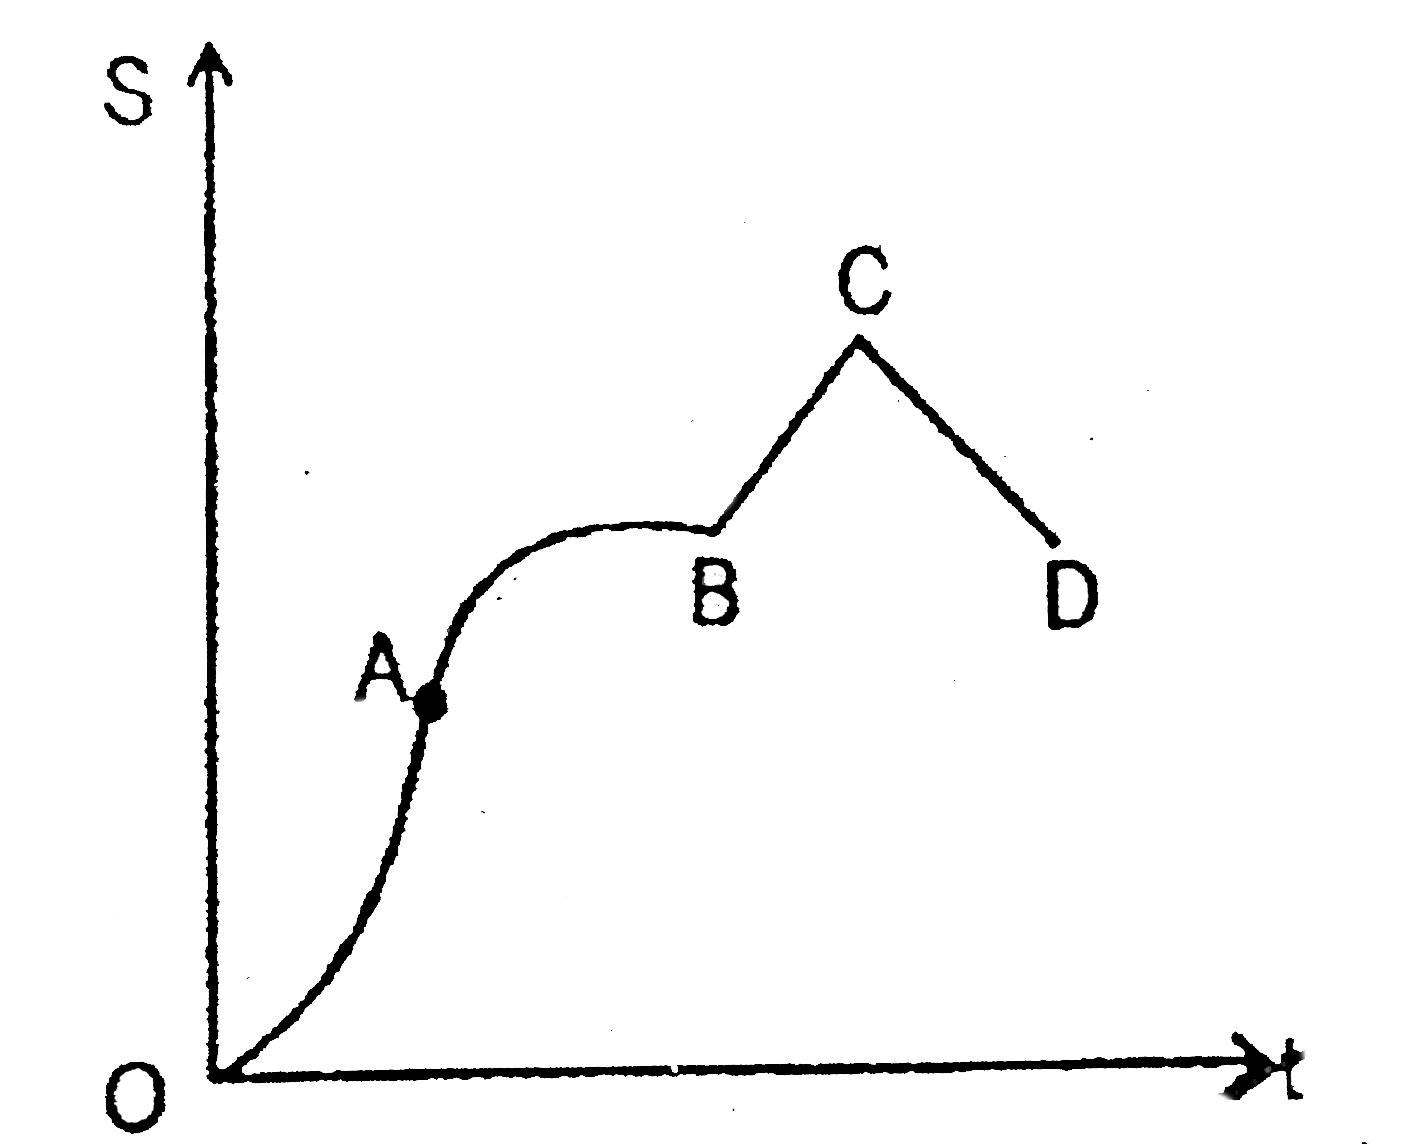
View SolutionDisplacment-time graph of a particle moving in a straight line is as shown in figure. Choose the INCORRECT statement(s)
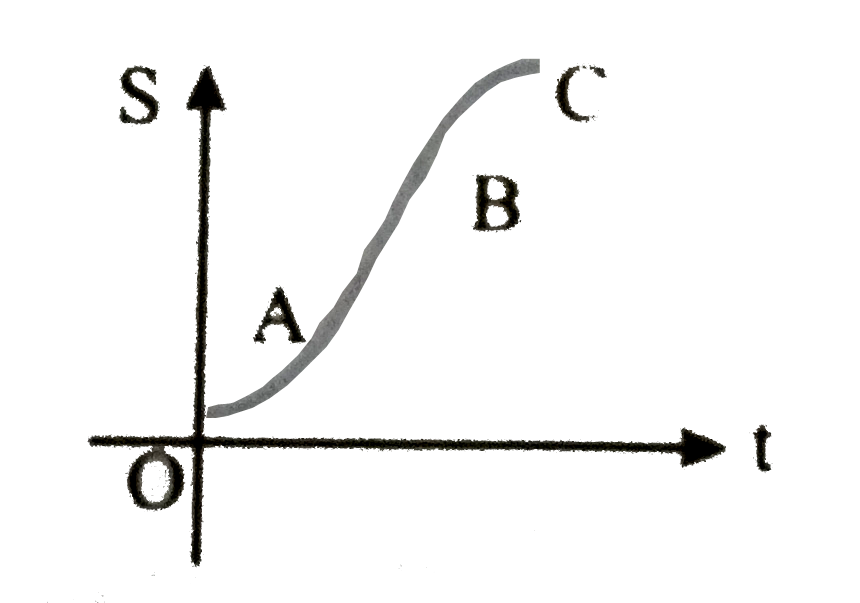
View SolutionDisplacement time graph of a particle moving in a straight line is as shown in figure. Select the correct alternative (s) :
 .
.
View Solution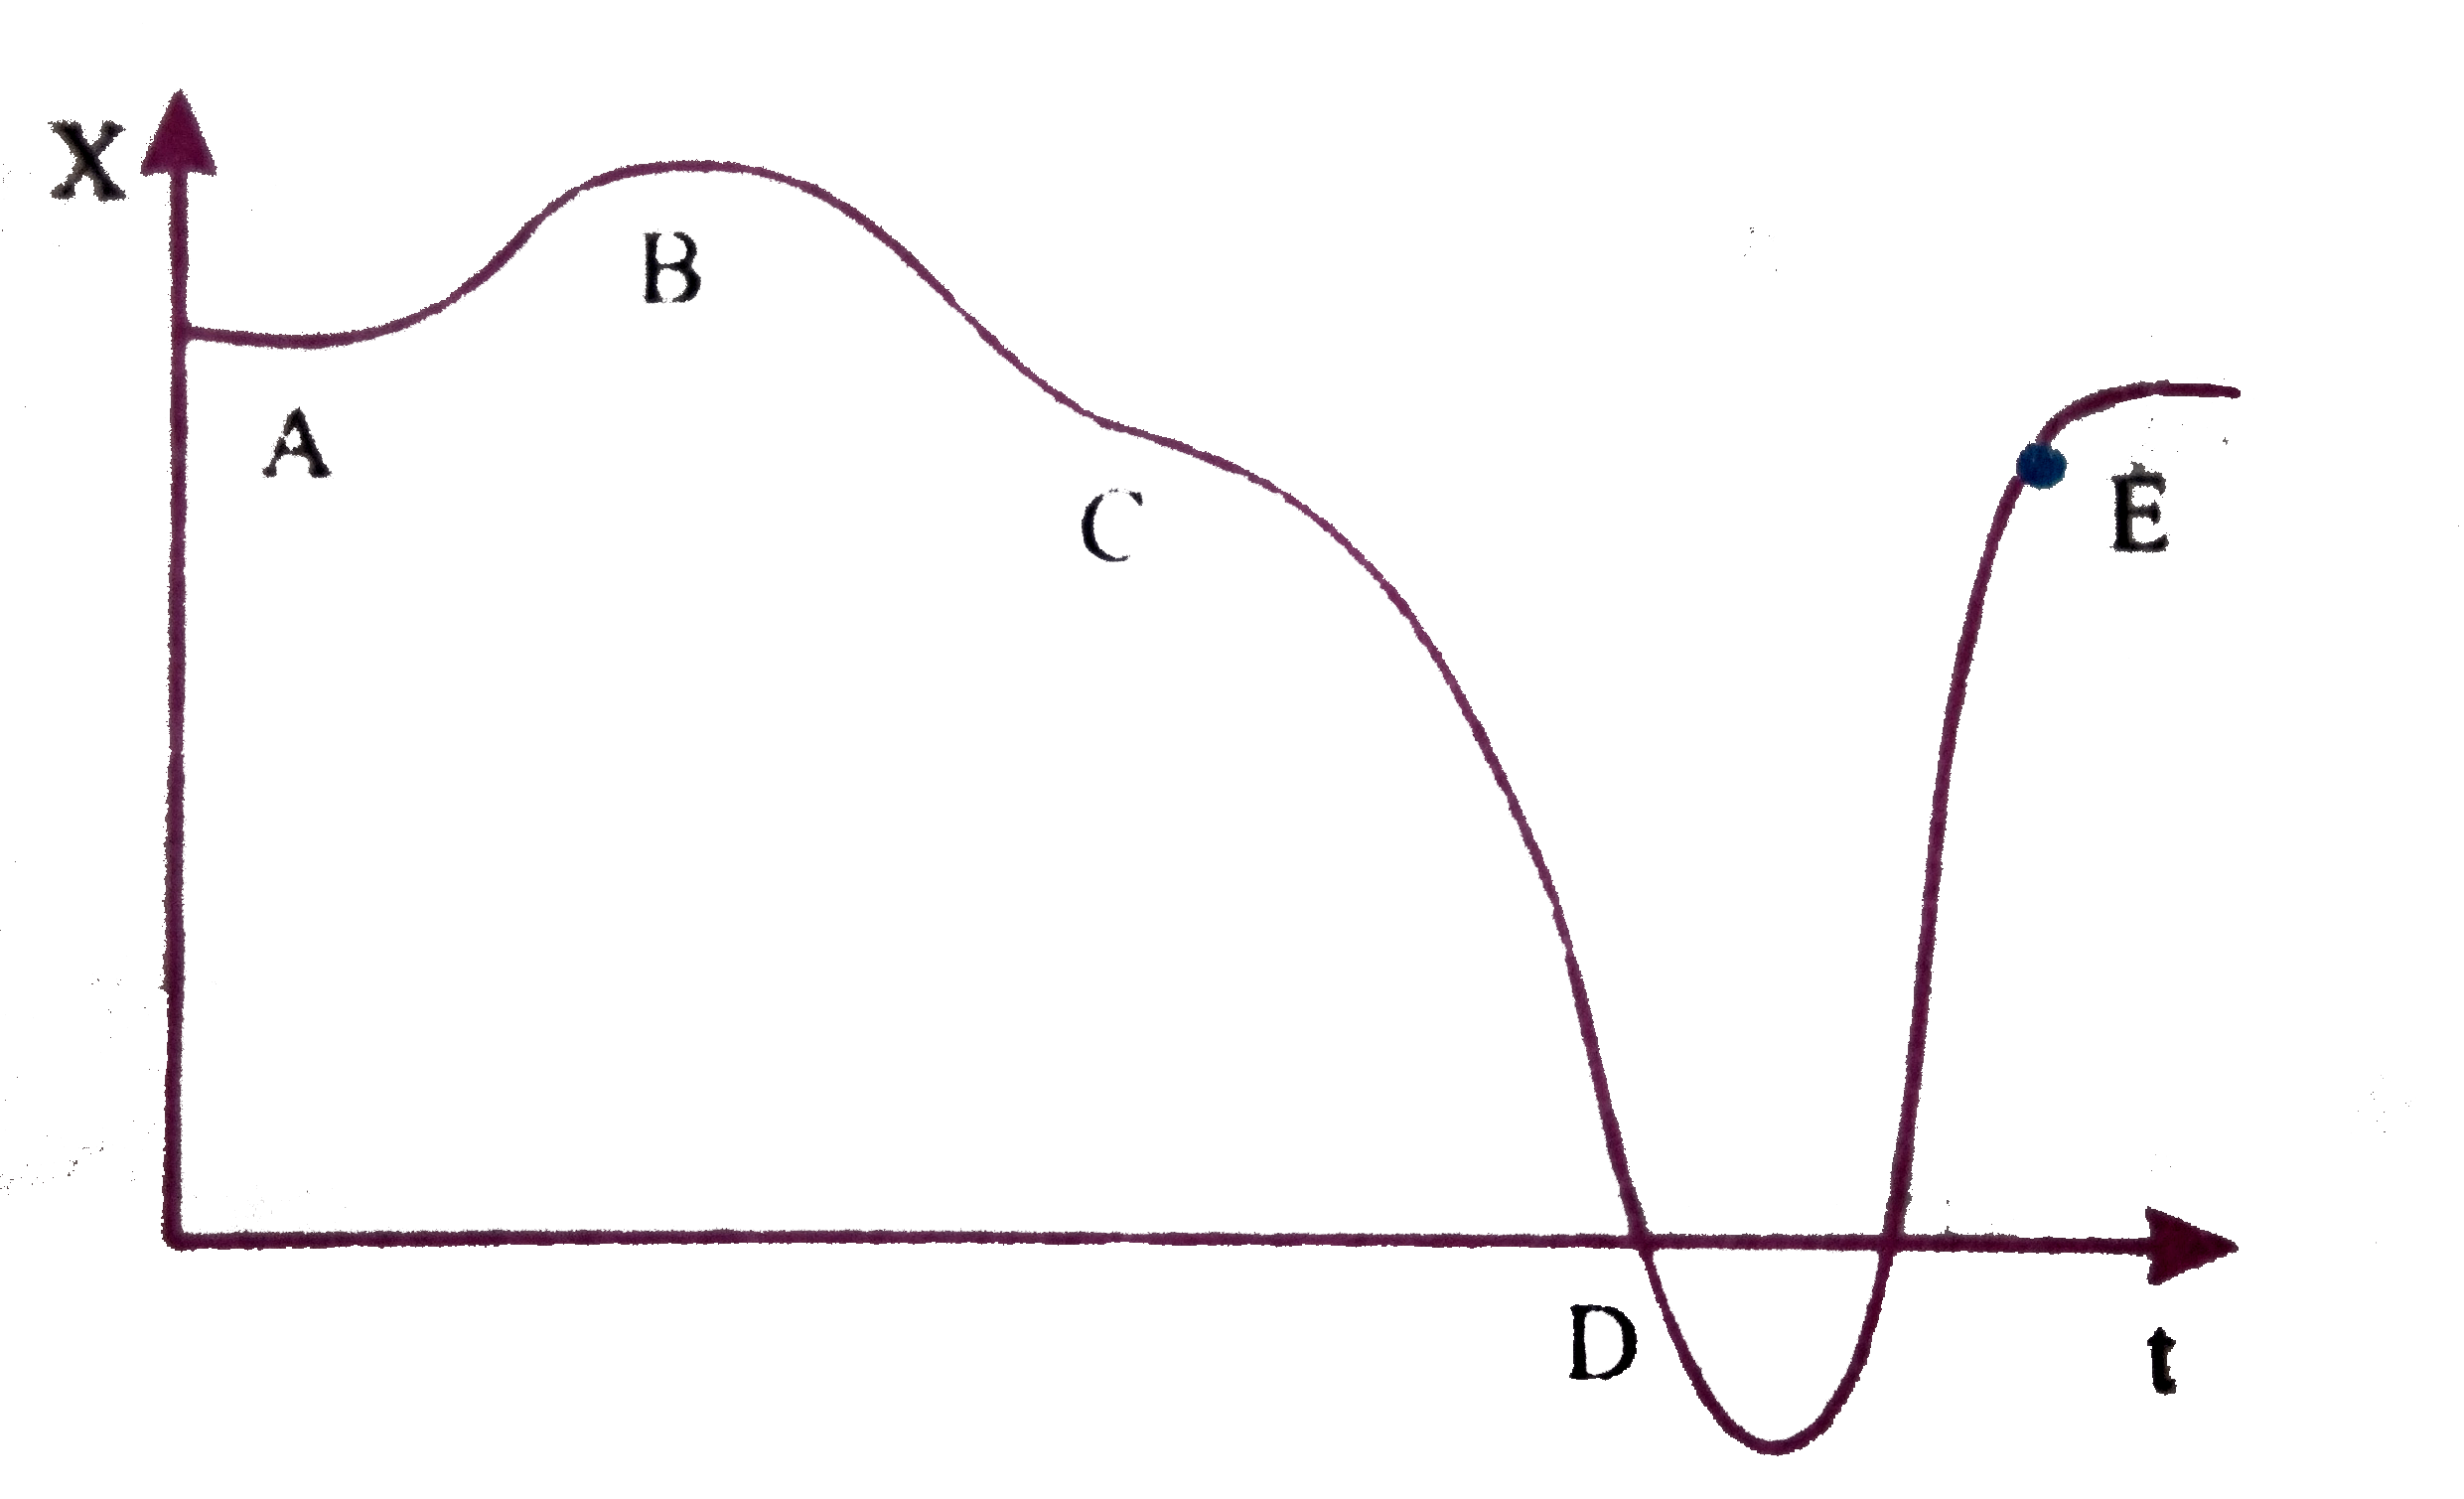
A graph of x versus t is shown in figure. Choose correct alternative from below.
View SolutionA particle moved along the X−axis according to the graph shown in Figure. Choose the incorrct options.
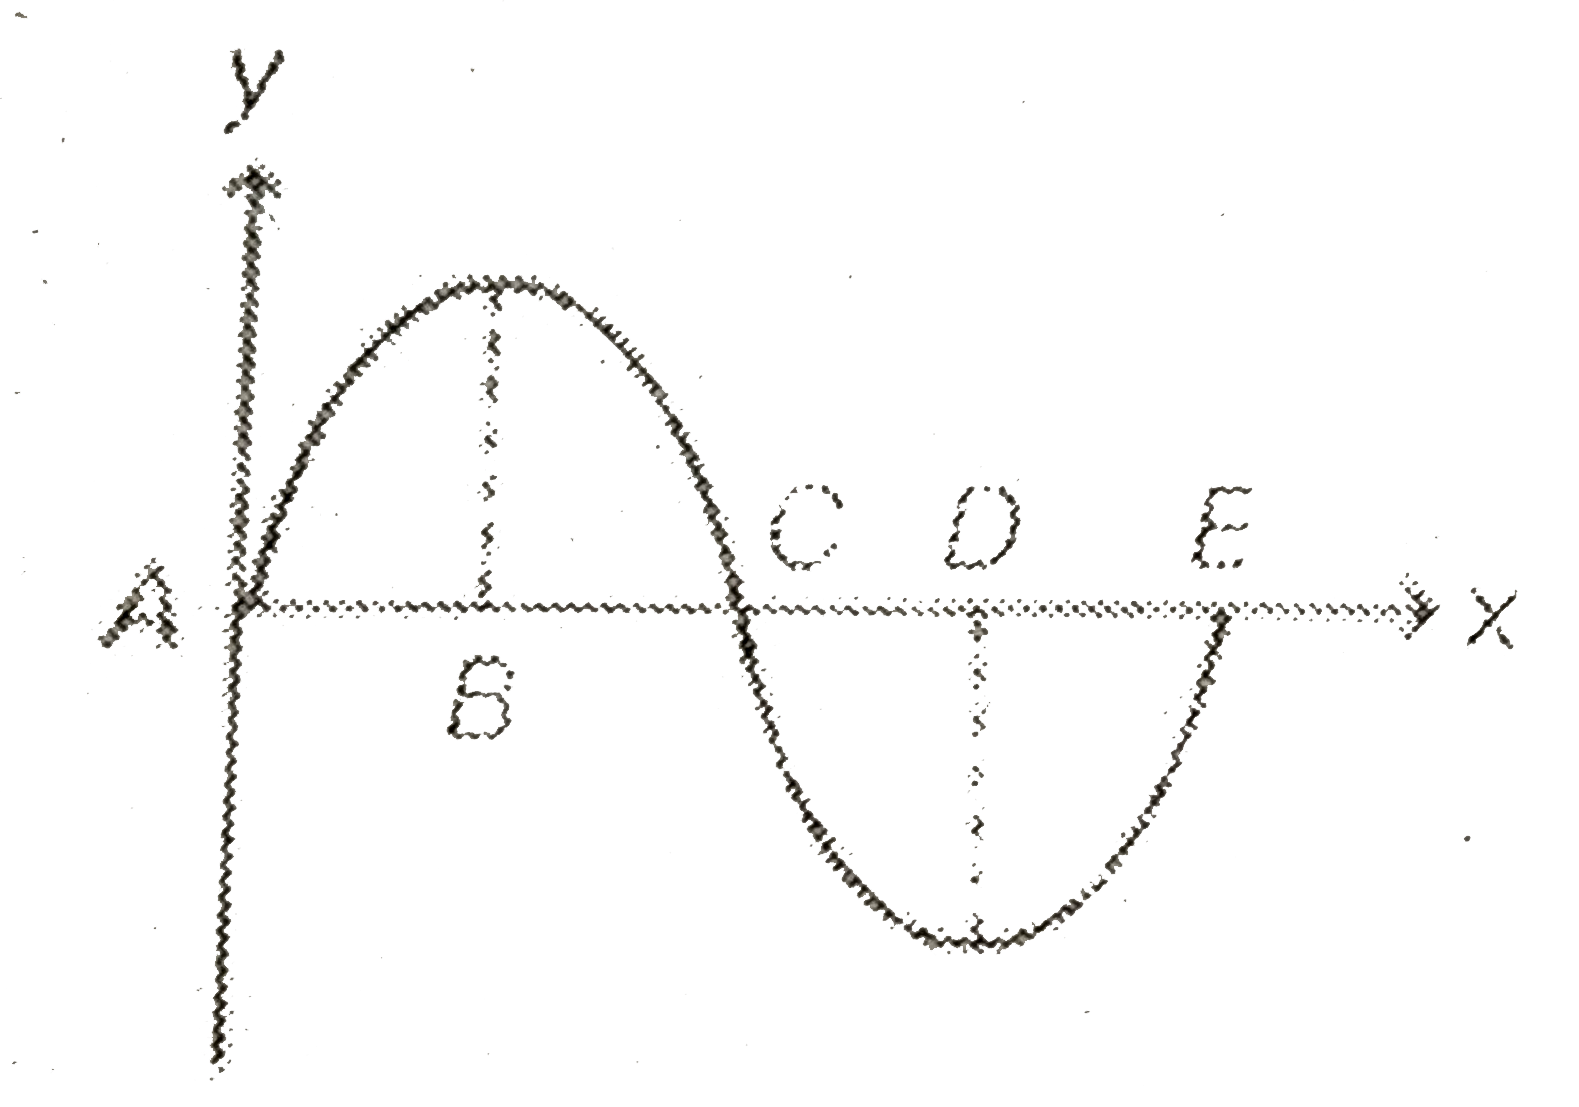
View SolutionSound wave is travellimg along positive x -direction . Displacement (y) of particles from their mean position at position x is a shown in figure . Choose the correct alternative(s).
View SolutionHeat energy at constant rate is given to two substances P and Q. If variation of temperature (T) of substances with time (t) is as shown in figure, then select the correct statement
View Solution