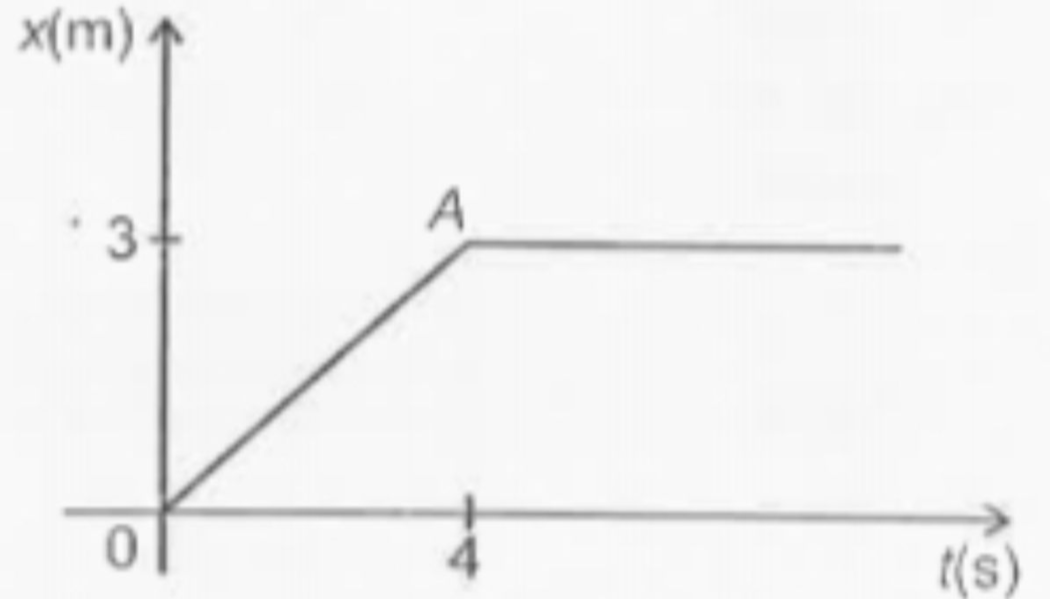
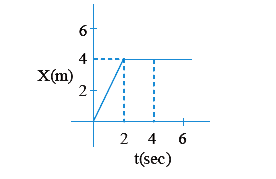
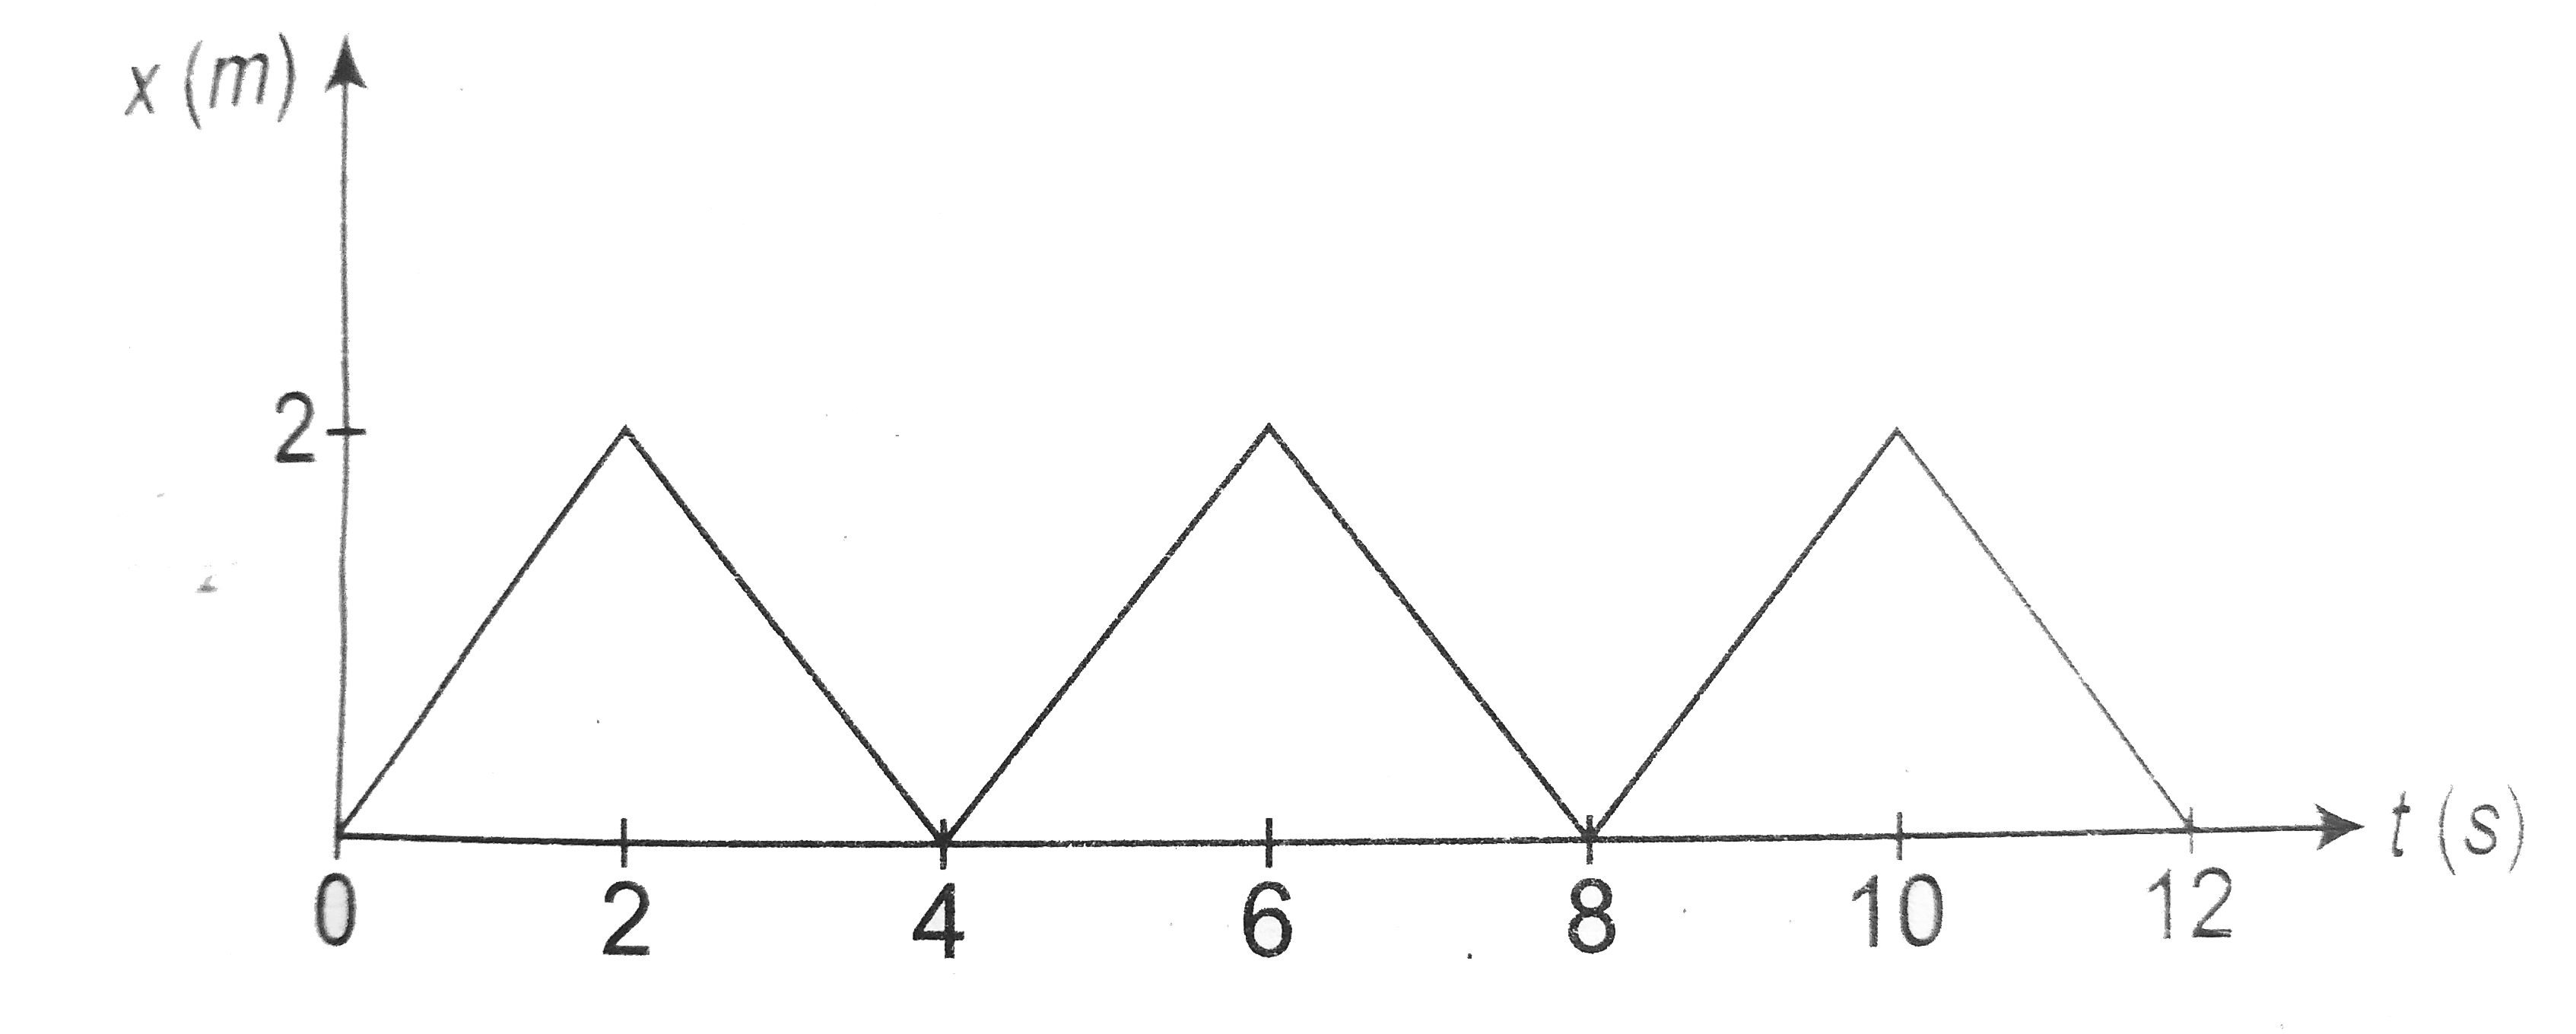
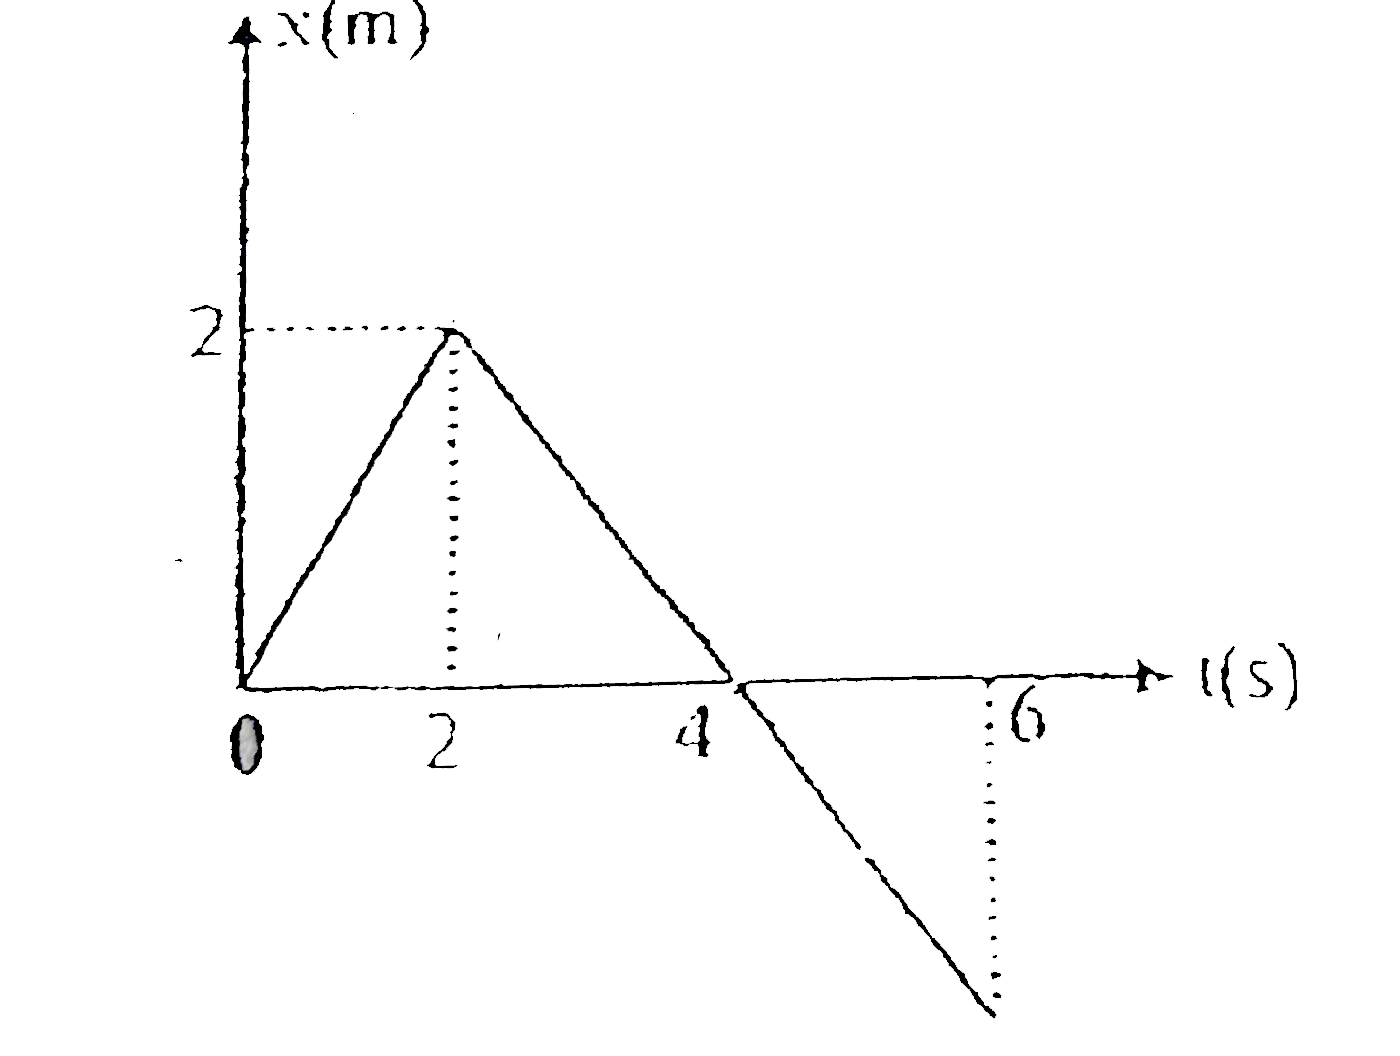
Figure shows the position-time graph of a particle of mass 0.04kg. Suggest a suitable physical context for this motion. What is the time between two consecutive impulses received by the particle? What is the magnitude of each impulse?
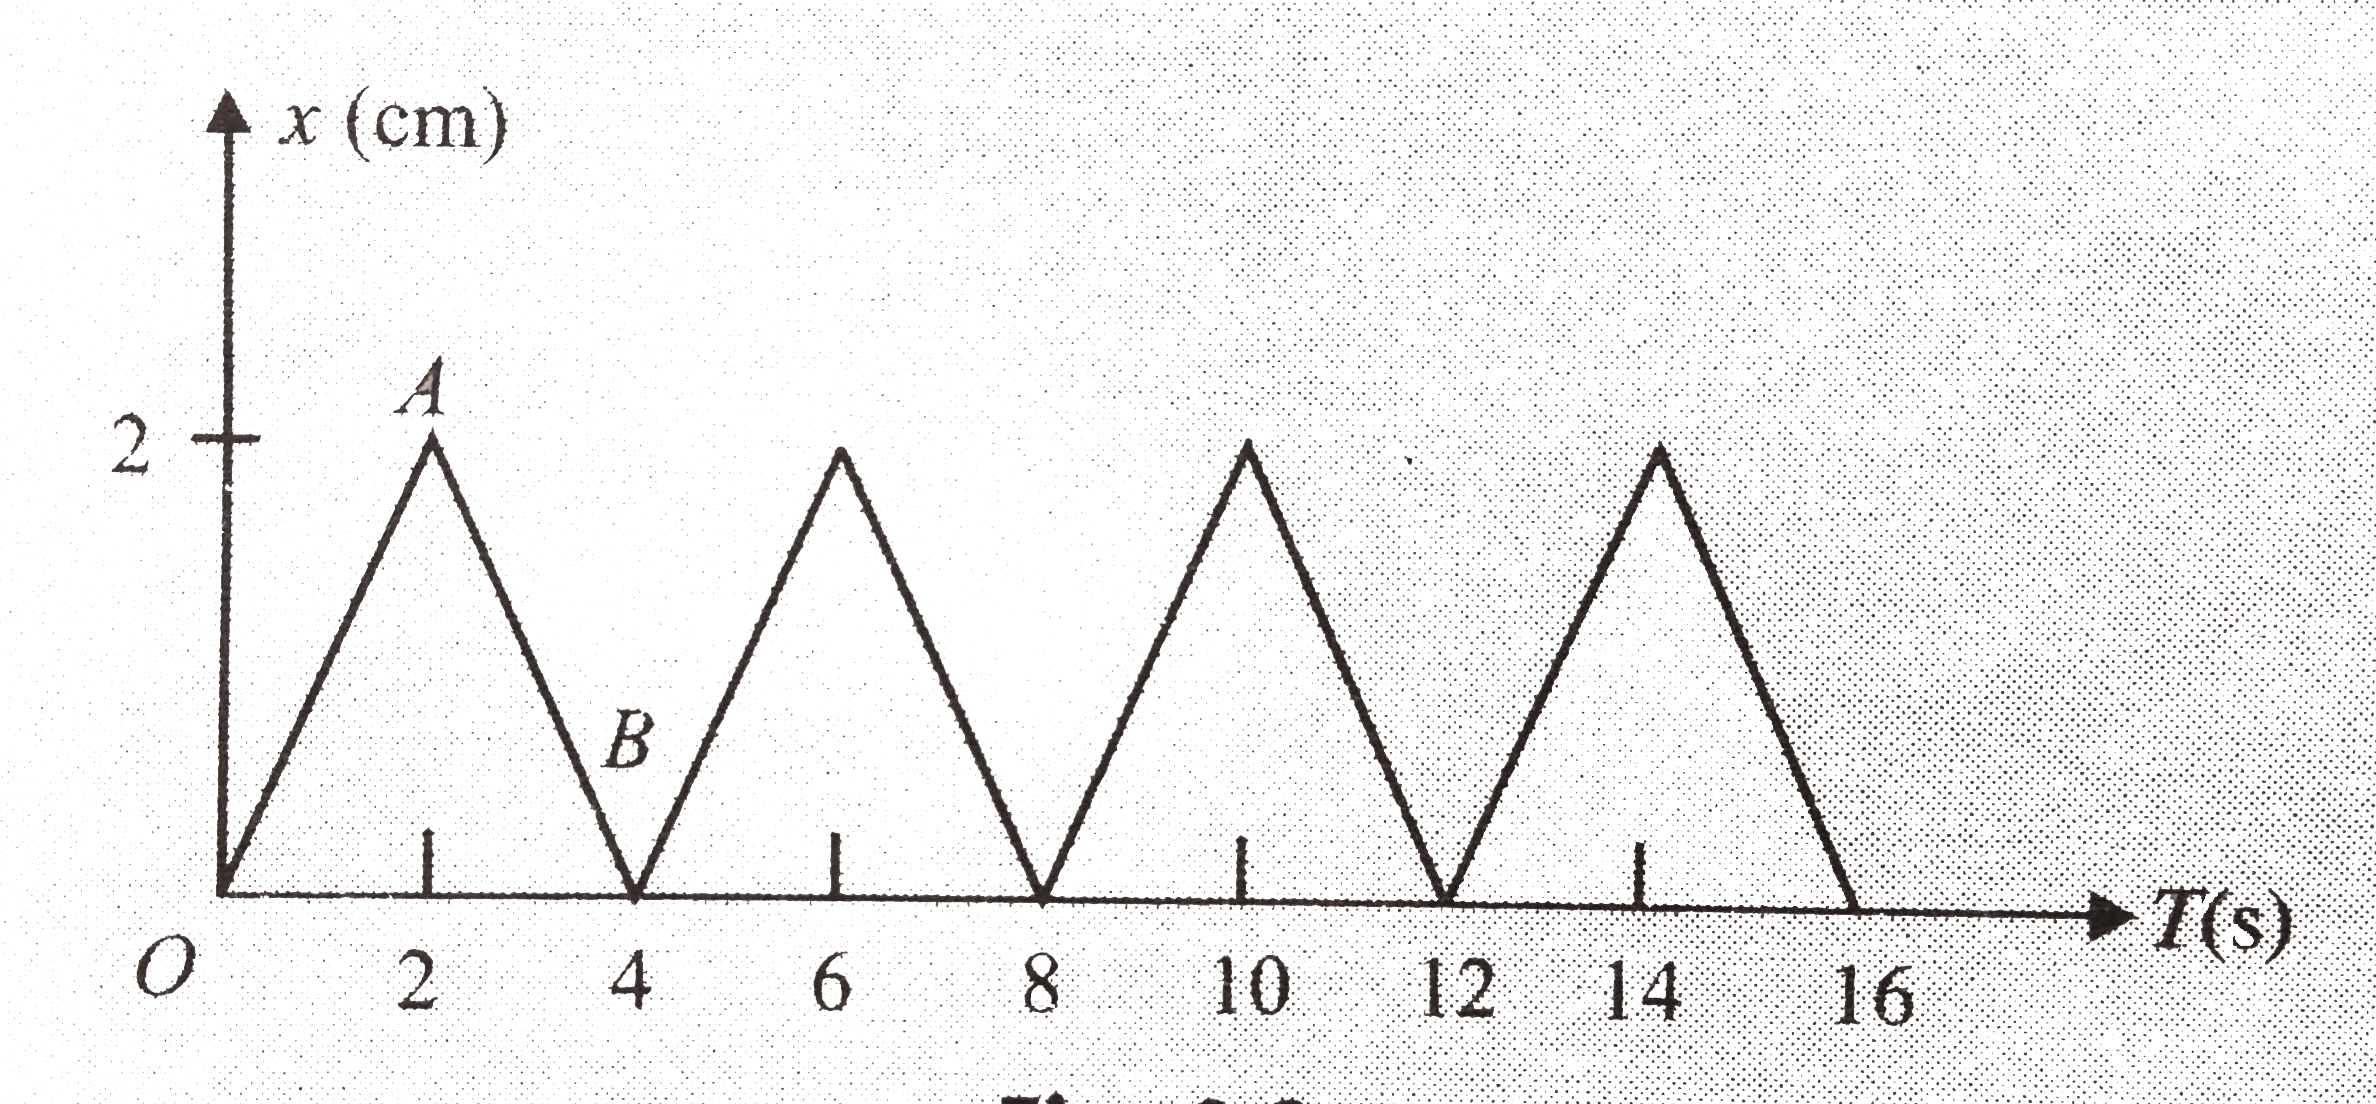
This graph can be of a ball rebounding between two walls situated at position 0 cm and 2 cm . The ball is rebounding from one wall to another, time and again every 2 s with uniform velcoity .
Impulse . Here, velocity = displacement / time = 2 / 100×2 = 0.01ms−1
Initial momentum = mu = 0.04×0.01 = 4×10⁻⁴ kg ms−1
Final momentum = mv = 0.04×(−0.01) = −4×10⁻⁴ kg ms−1
Magnitude of Impulse = Change in momentum
(4×10⁻⁴) - ( −4×10⁻⁴) = 8×10⁻⁴ kg ms−1
Time between two consecutive impulses is 2 s i.e the ball receives an impulse every 2 s.
Topper's Solved these Questions
Similar Questions
Knowledge Check
Figure shows the position-time graph of a particle of mass 4kg. Let the force on the particle for t<0 , 0<tlt,4s , t>4s be F1,F2 and F3 respectively. Then
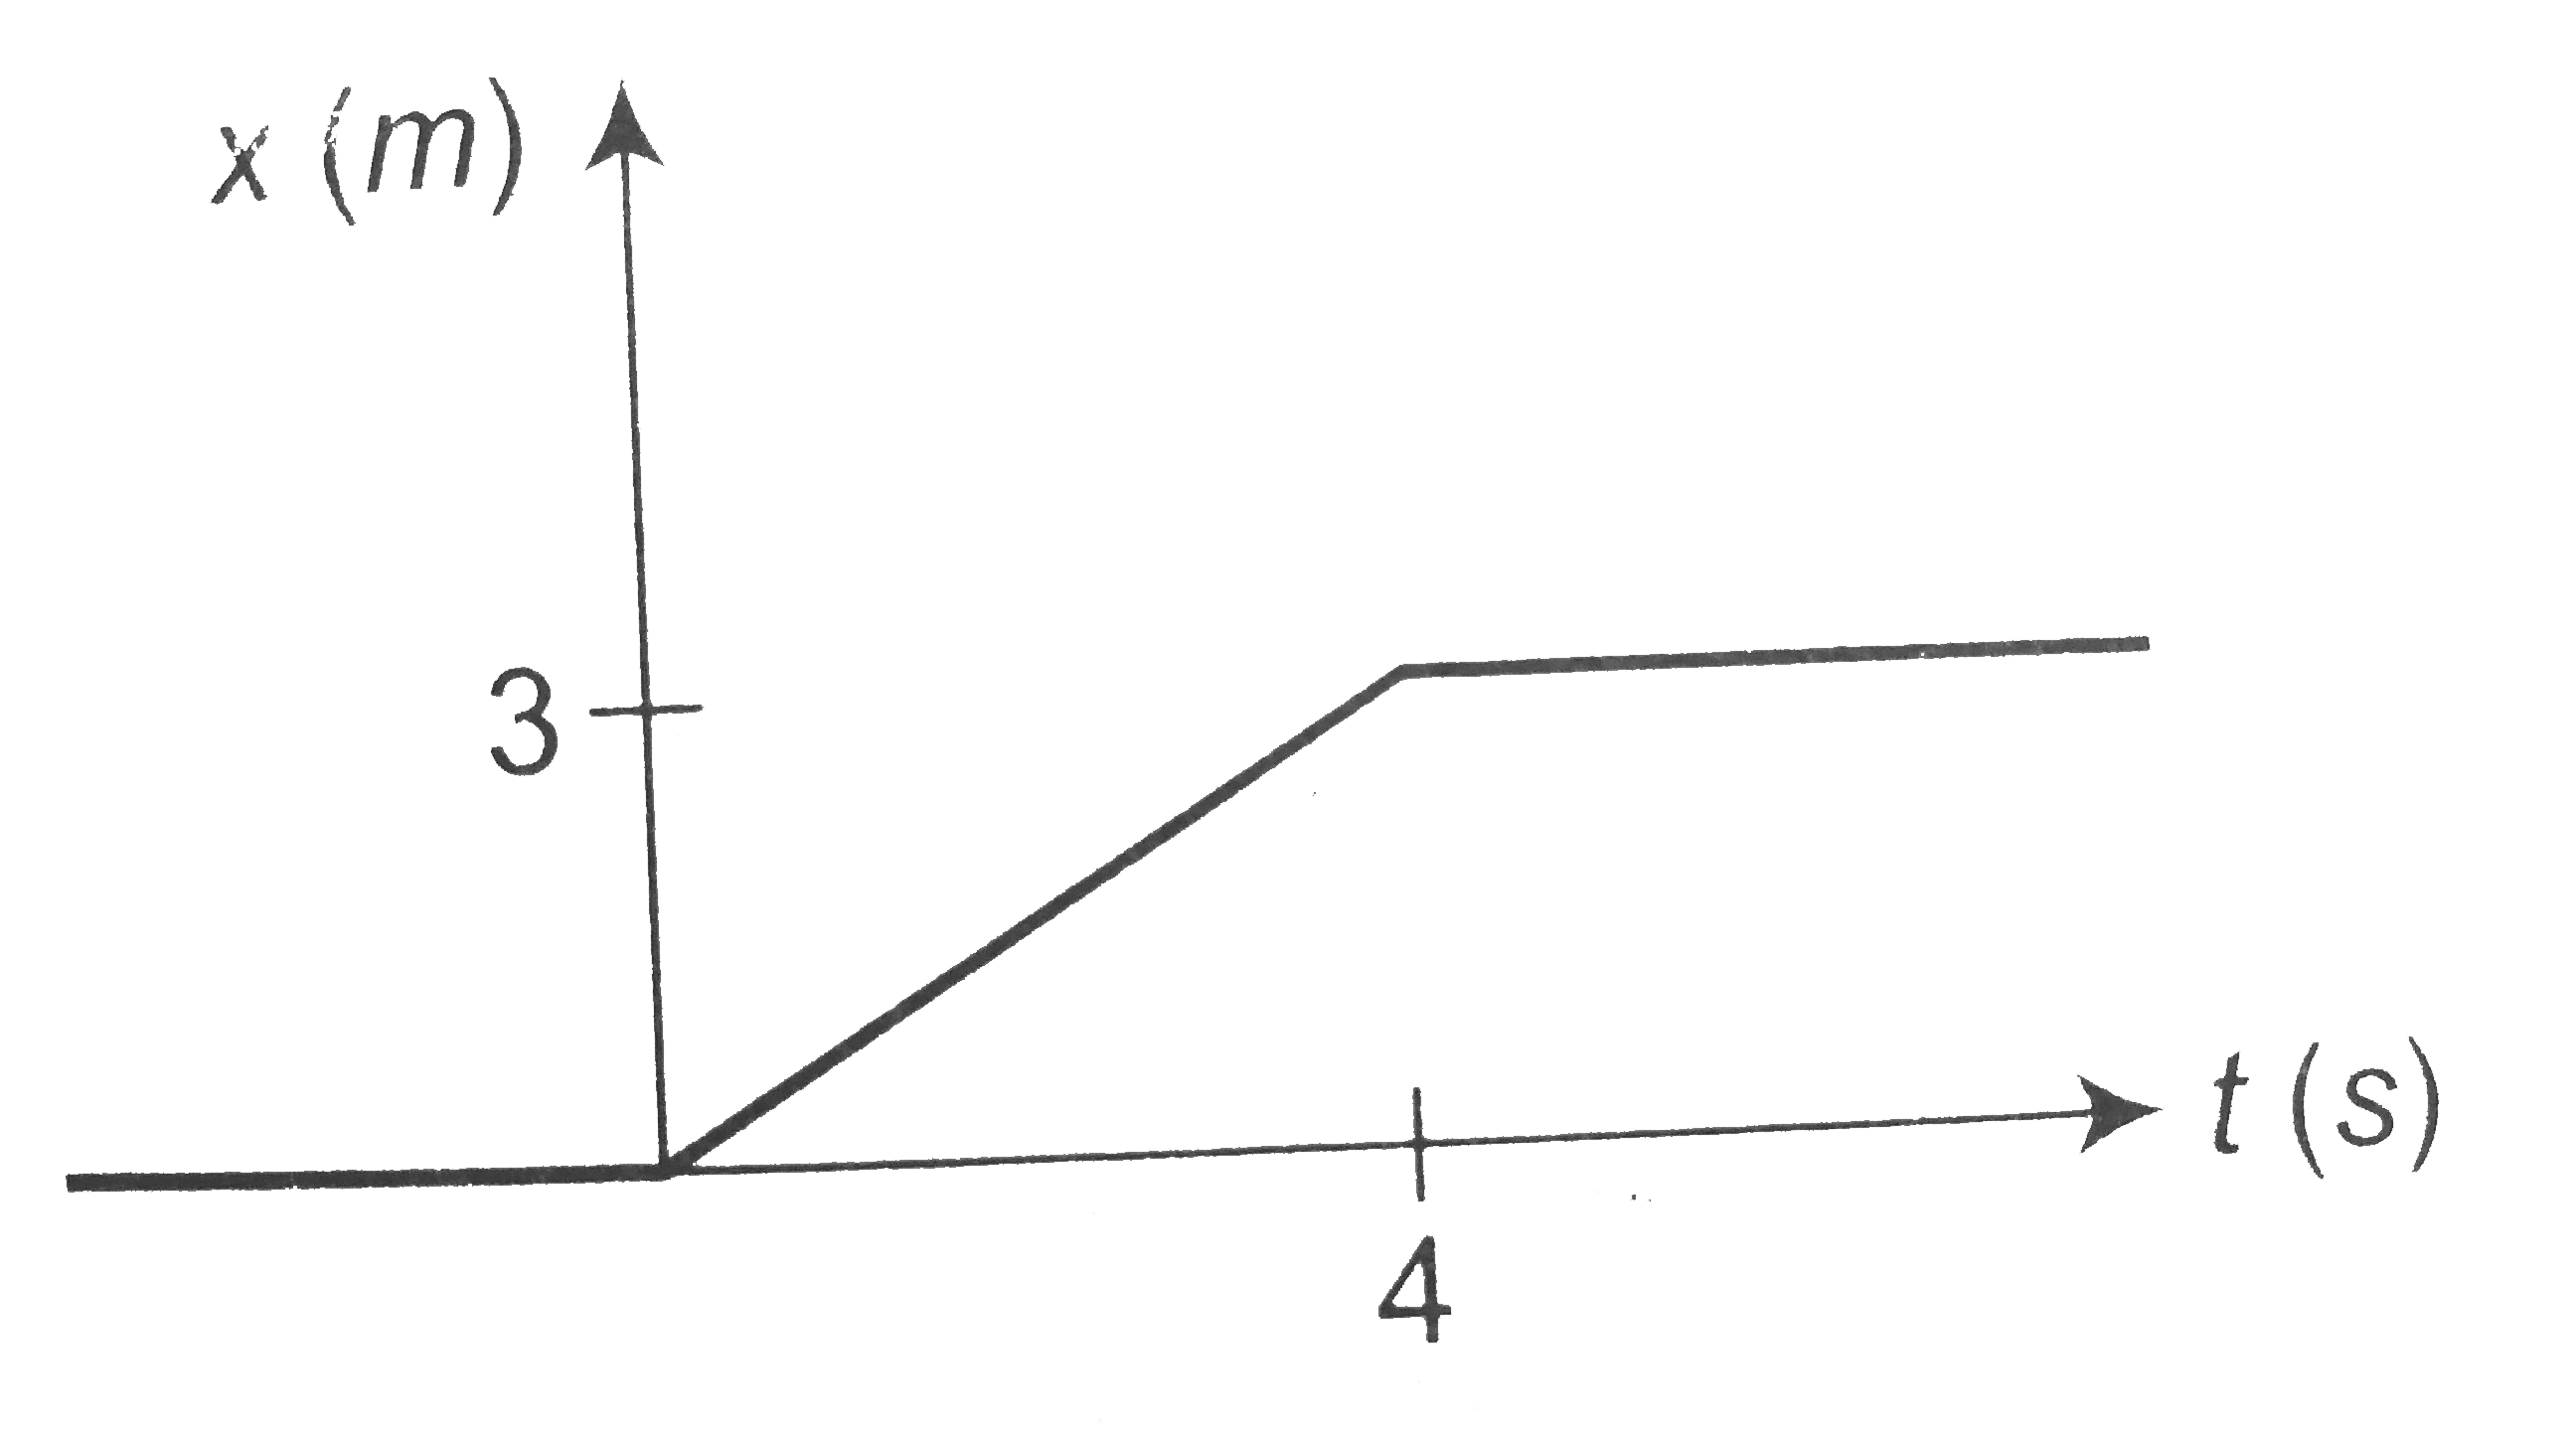 AF1=F2=F3=0BF1>F2=F3CF1>F2>F3DF1<F2<F3
Figure shows the position-time (x-t) graph of one dimensional motion of a mass 500g. What is the time interval between two consecutive impulses received by the body?
 A2sB4sC6sD8s
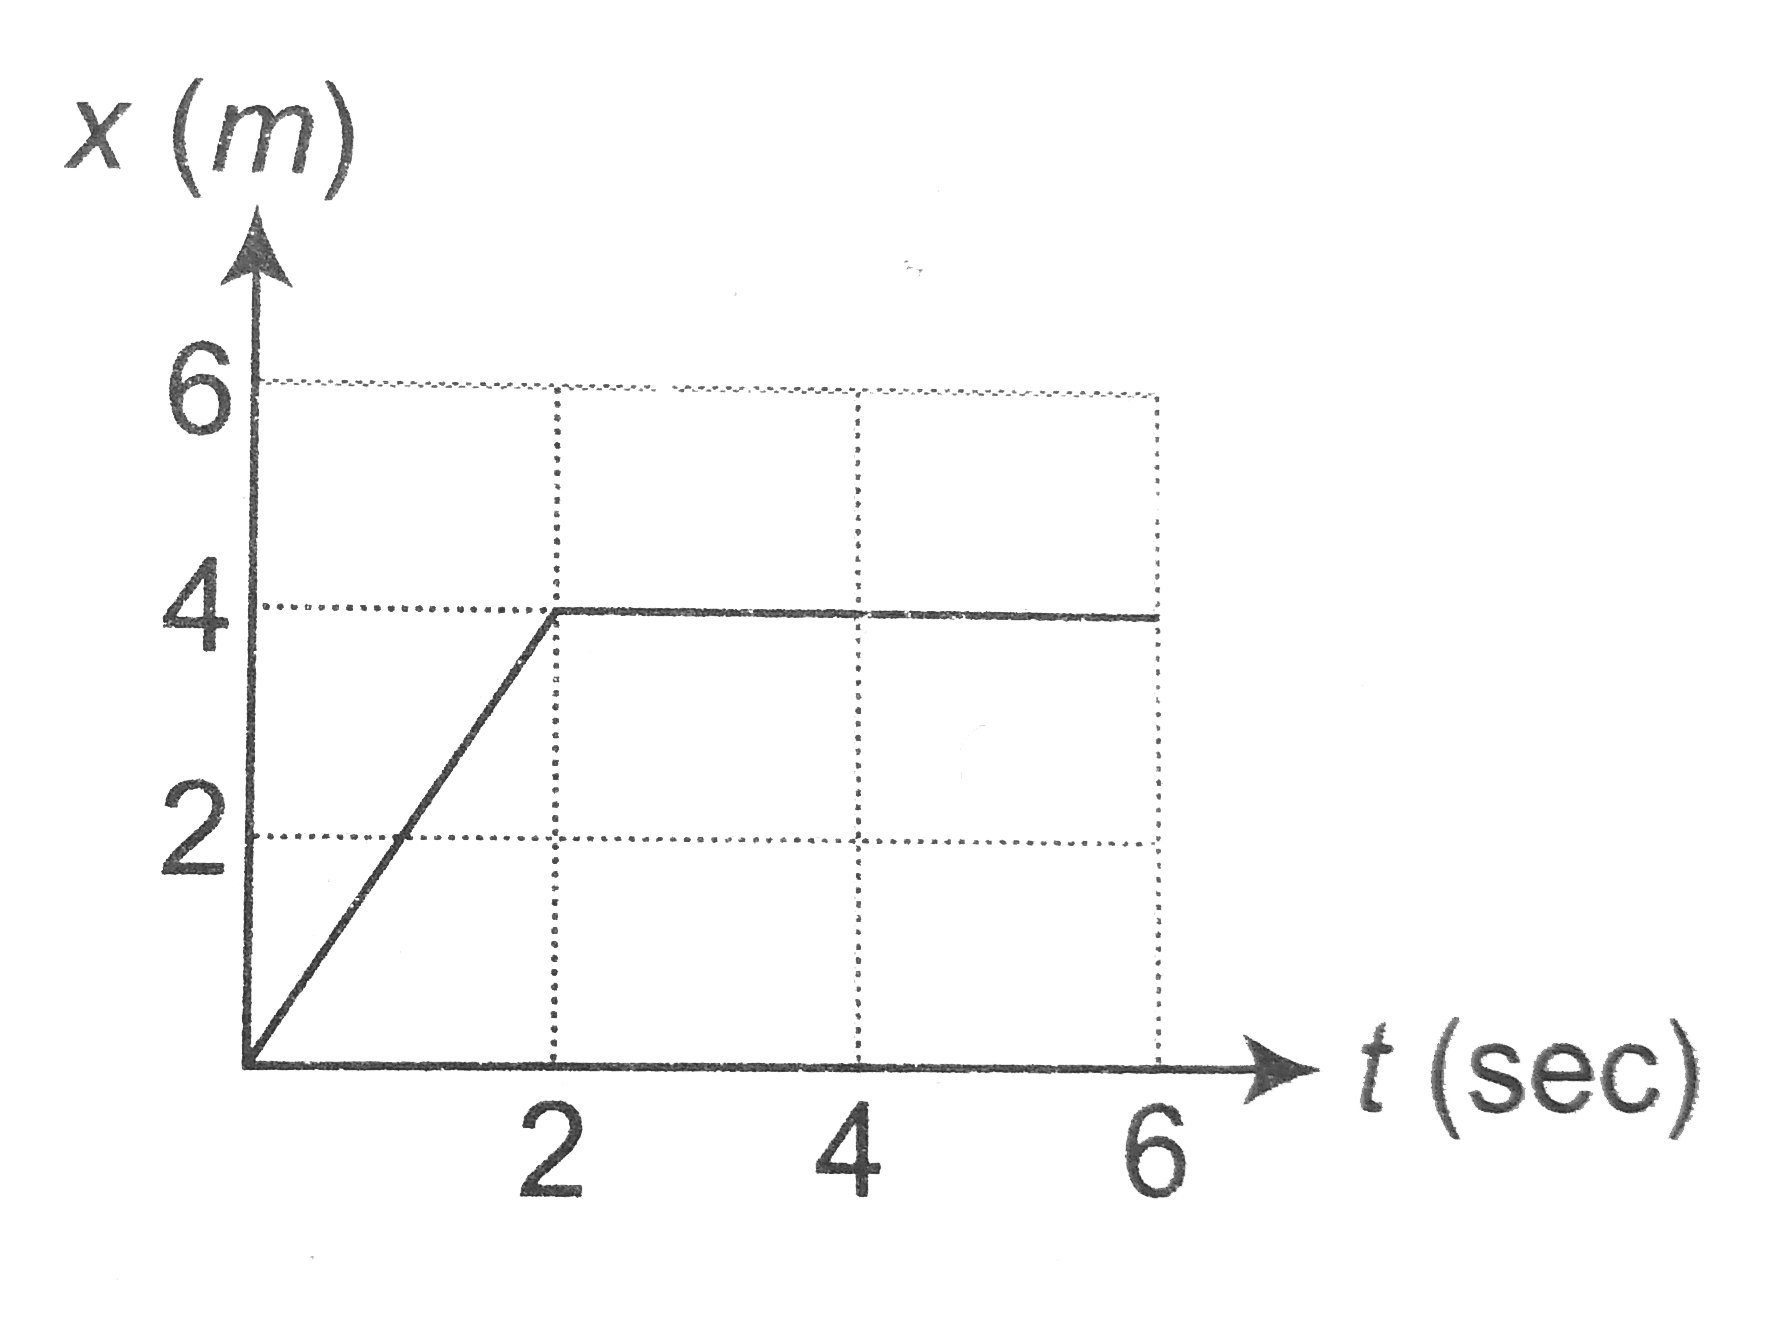
In the figure given below, the position-time graph of a particle of mass 0.1kg is shown. The impuslse at t=2 sec is
View SolutionIn the figure given below, the position time graph of a particle of mass 0.1kg is shown. The impulse at t=2 sec is
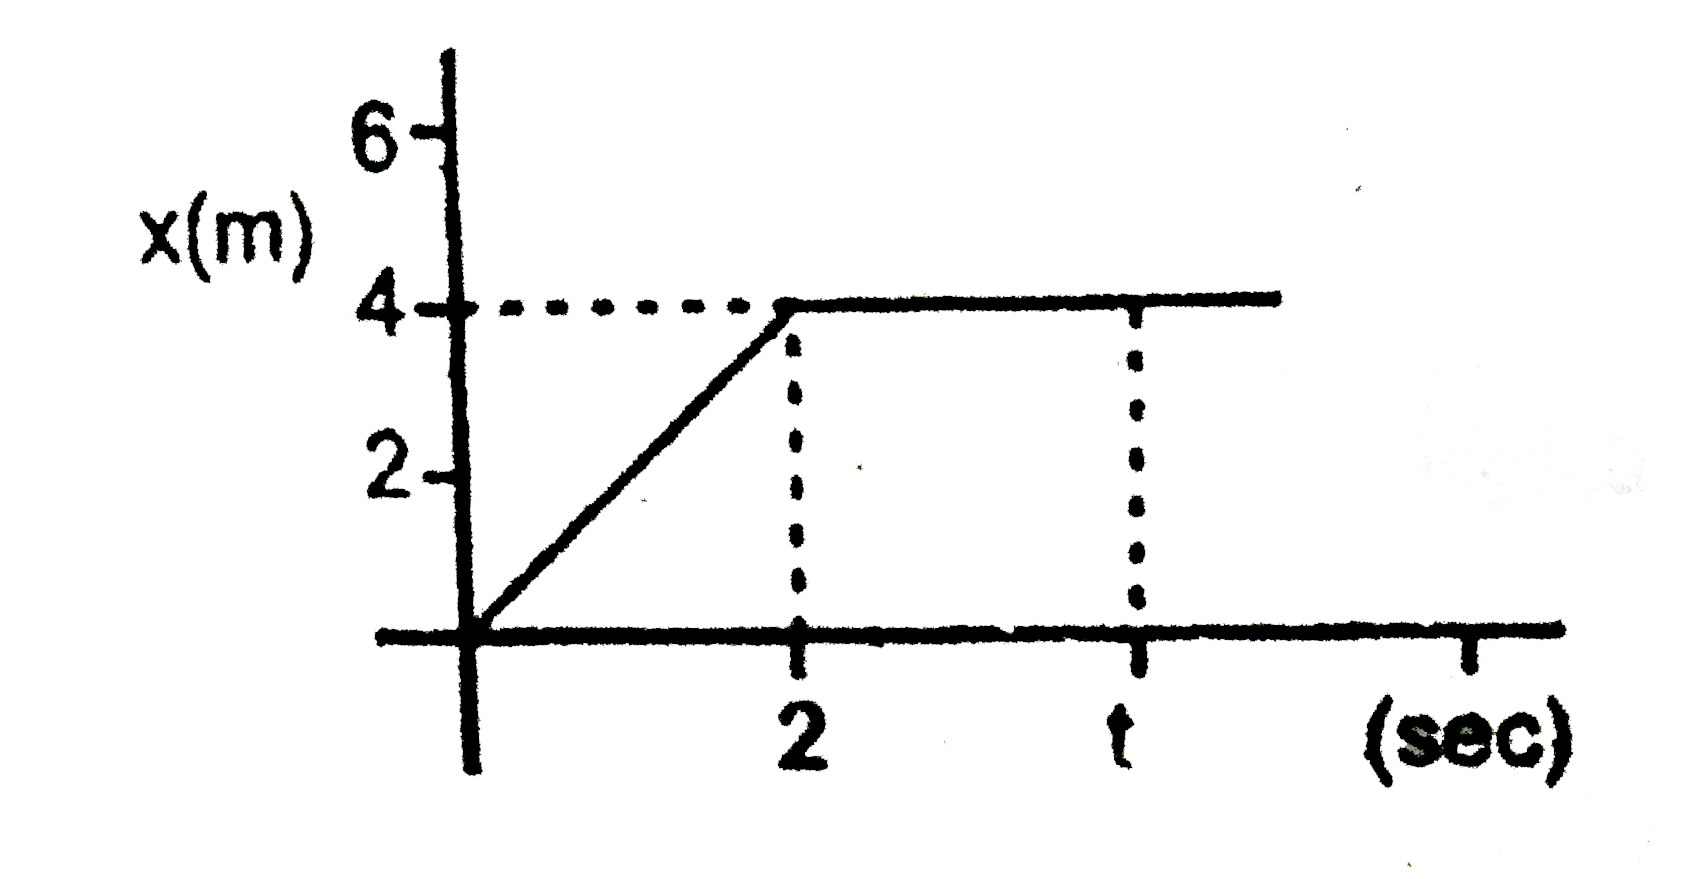
View SolutionFigure shows the position-time graph of a particle moving on the X--axis. Which of these option correctly describes the particle 's motion?
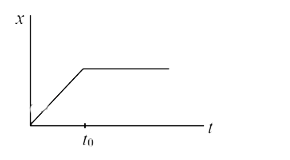
View SolutionPosition time graph of a particle of mass 2 kg is shown in figrure. Total work done on the particle from t=0 to t=4s is
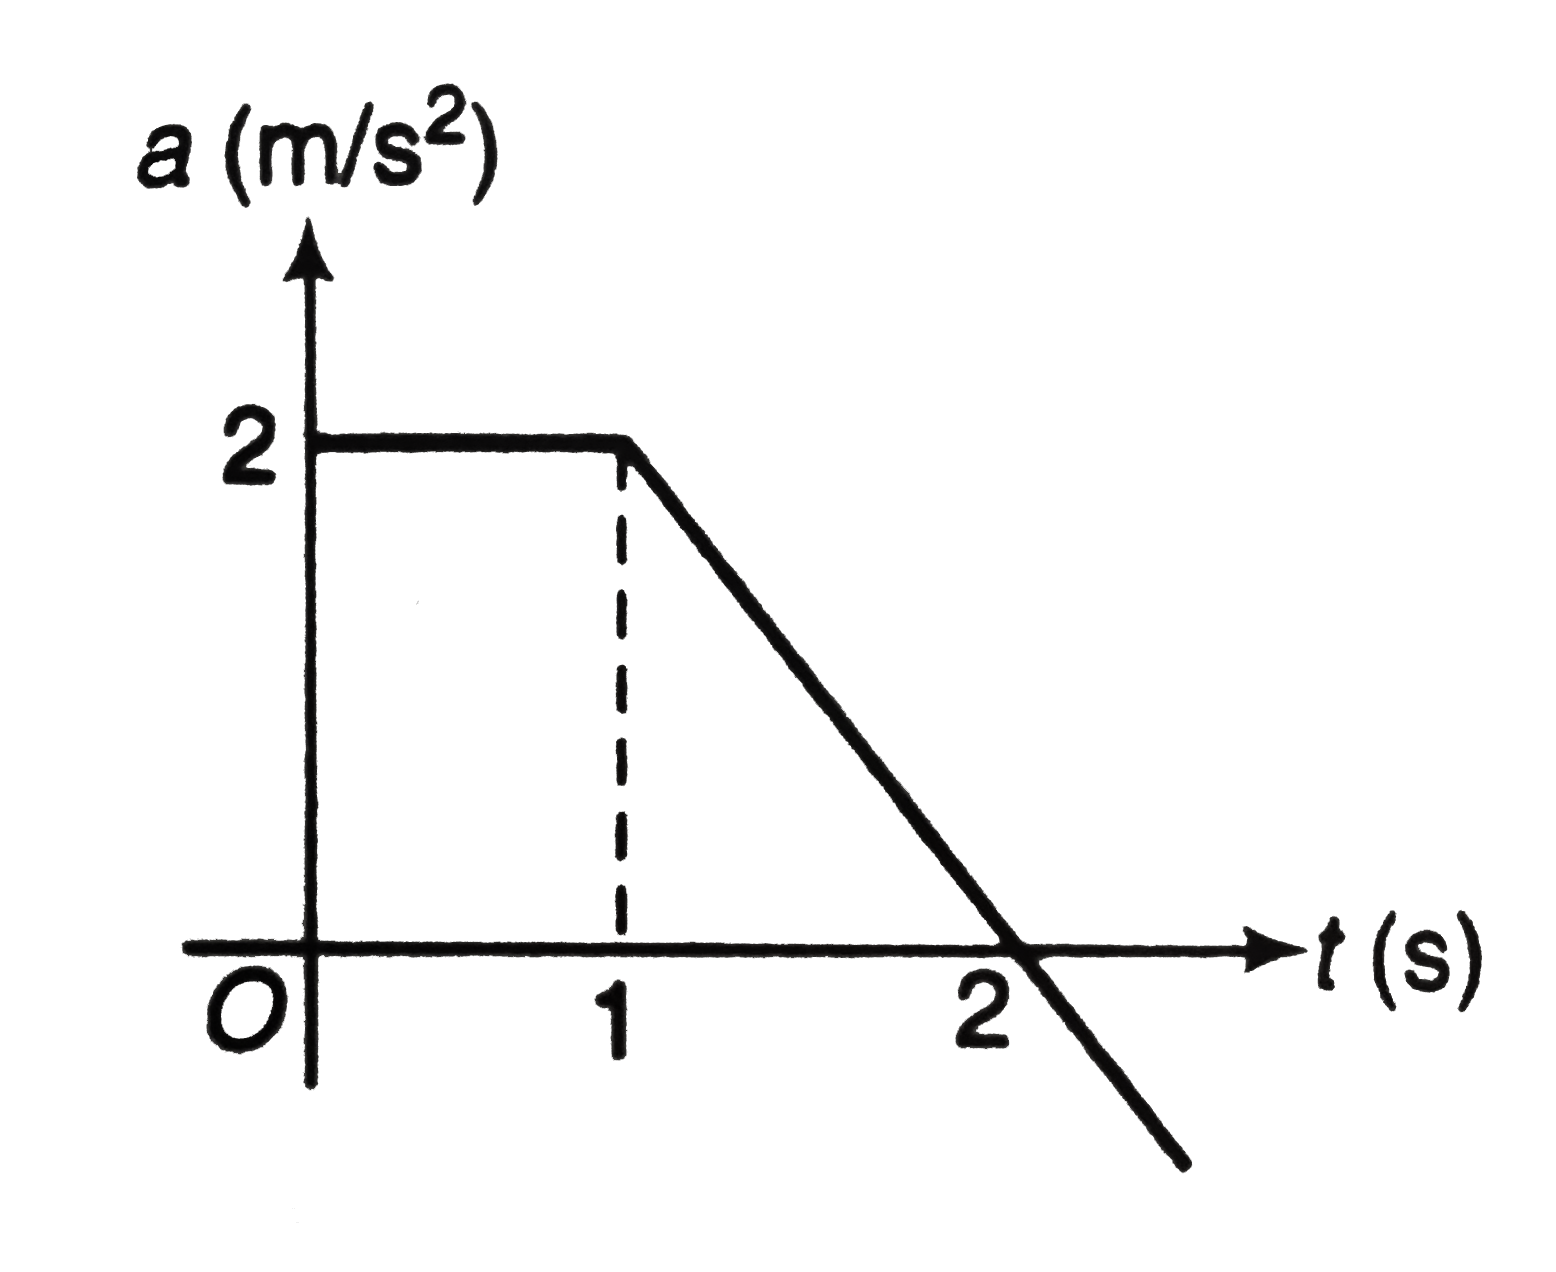
View SolutionFigure shows the acceleration-time graph of a particle moving along a straight line. After what time the particle acquires its initial velocity?
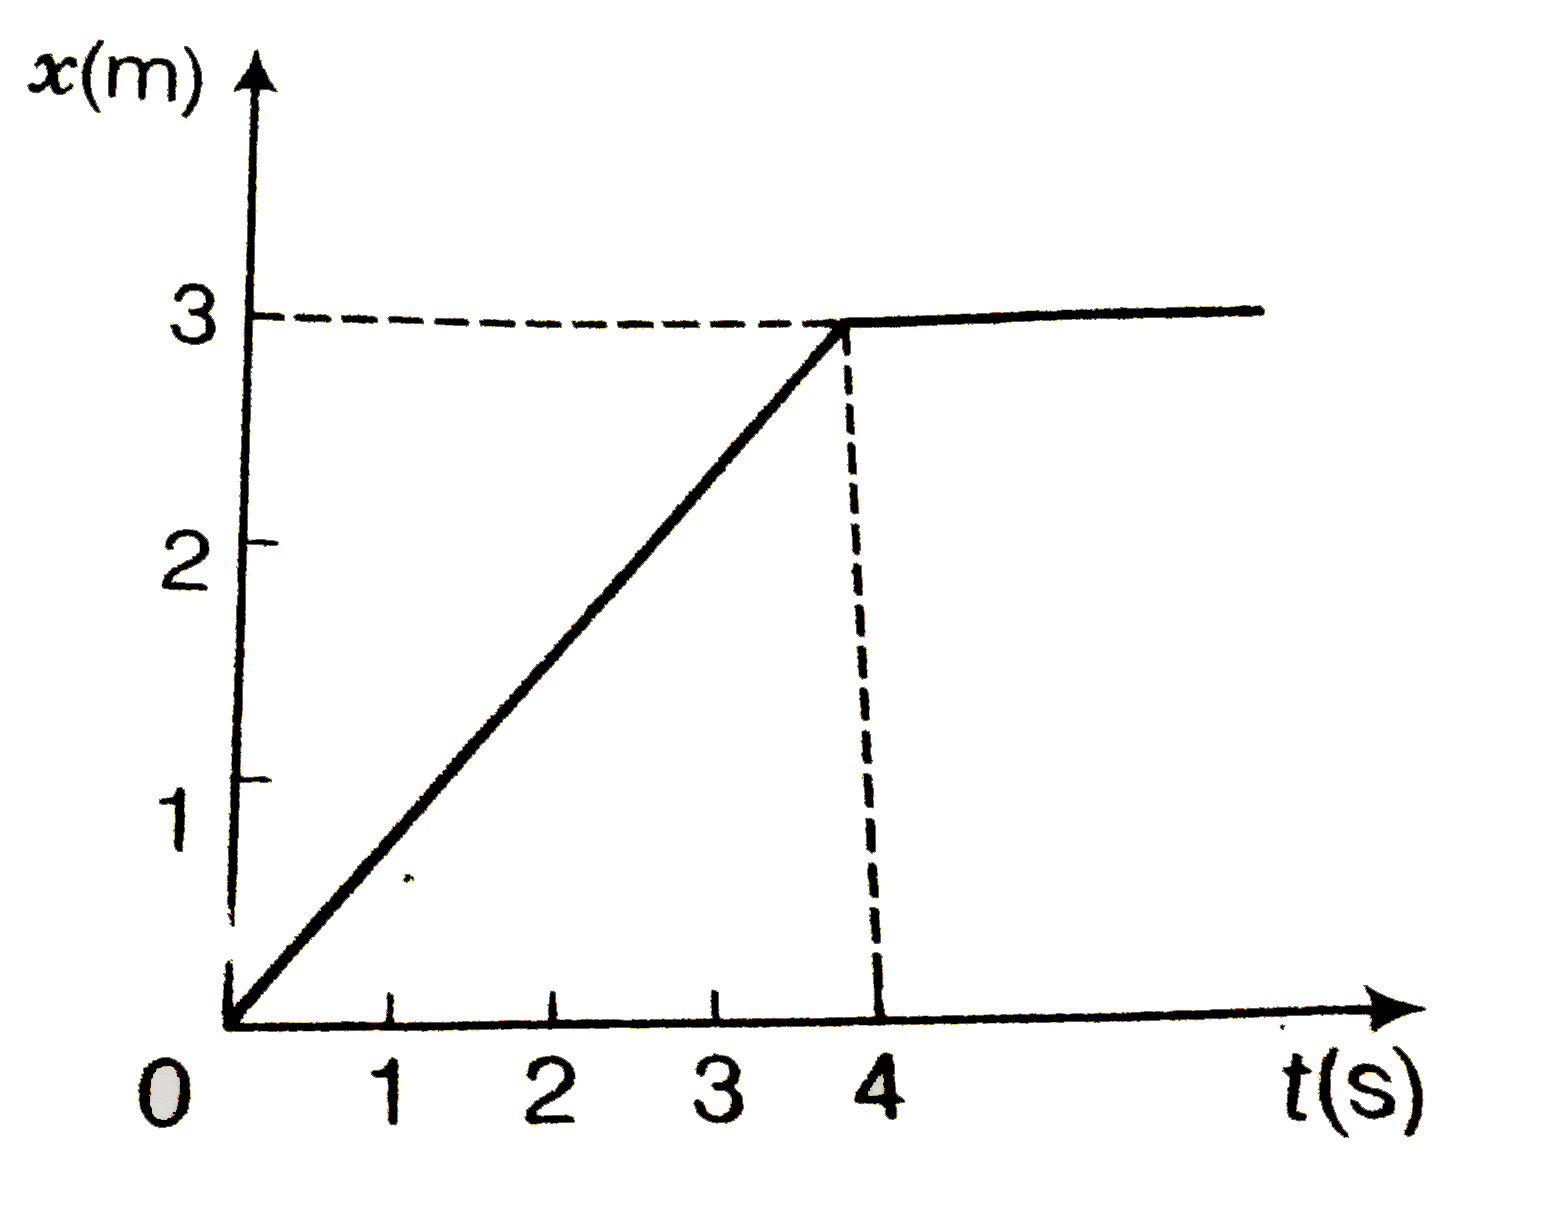
View SolutionThe position-time graph of a body of mass 2 kg is as given in figure . What is the impulse on the body at t = 0 s and t = 4 s .
View Solution
