In the graph given below we get a shocking picture of deaths in the USA due to Corona Virus that showed a constant upward trend in the month of April 2020. Write an analytic paragraph describing the general trend and other details after analysing the graph.
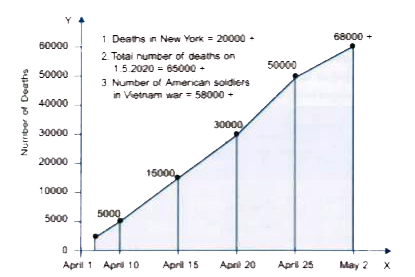
The graph given above illustrates the threatening number of Corona Virus related death cases in the United States of America from April 1 to May 1, 2020. The number of deaths even surpassed the shocking numbers of deaths that American soldiers lost in the Vietnam War. The overall trend shows a constant upward trend. Within a short span of 30 days, more than 65,000 precious lives were lost being smitten by COVID-19. The staggering numbers appear more terrible when contrasted with the deaths of American soldiers in the Vietnam War. More American lives have already been lost than the number of soldiers killed (58000+) in Vietnam. And there is no respite as yet. On April 1, there were just 800 deaths. The figures showed a steady climb during the first ten days. On April 10, there were 5000 COVID-19 related deaths in the USA. The number of deaths shot up to 30000 within the next five days, from April 15 to April 20. The numbers doubled up from what they were on April 15. From April 20 to April 25, the time-period showed the maximum increase in the number of deaths, 20000. They rocketed to 50000 on April 25. The same story continued till May 2, when the recorded number of COVID-19 related deaths rose to more than 68000.
Overall, the number of deaths caused by COVID-19 demonstrated a geometric progression. Due to unseen reasons the spread couldn.t be controlled in the initial stages. On April 1, the number was just 800! With the passage of time COVID-19 became more uncontrollable and fatal.
Topper's Solved these Questions
- COMPOSITION - II (WRITING ANALYTICAL PARAGRAPH ON MAP/CHART/REPORT/ LINE GRAPH)BOOK - FULL MARKSCHAPTER - COMPOSITION - II (WRITING ANALYTICAL PARAGRAPH ON MAP/CHART/REPORT/ LINE GRAPH)EXERCISE - ANALYTIC STUDY OF REPORTS
3 Videos
- COMPOSITION - II (WRITING ANALYTICAL PARAGRAPH ON MAP/CHART/REPORT/ LINE GRAPH)BOOK - FULL MARKSCHAPTER - COMPOSITION - II (WRITING ANALYTICAL PARAGRAPH ON MAP/CHART/REPORT/ LINE GRAPH)EXERCISE - ANALYTIC STUDY OF MAPS
3 Videos
- COMPOSITION - II (WRITING ANALYTICAL PARAGRAPH ON MAP/CHART/REPORT/ LINE GRAPH)BOOK - FULL MARKSCHAPTER - COMPOSITION - II (WRITING ANALYTICAL PARAGRAPH ON MAP/CHART/REPORT/ LINE GRAPH)EXERCISE - PIE CHARTS
4 Videos
- CLOZE PASSAGEBOOK - FULL MARKSCHAPTER - CLOZE PASSAGEEXERCISE - Fill in the most appropriate option in each blank from those given below to complete the following passage.
112 Videos
- COMPOSITION-IBOOK - FULL MARKSCHAPTER - COMPOSITION-IEXERCISE - IV. OFFICIAL LETTERS ON ALL SITUATIONS (SOLVED EXAMPLES)
29 Videos
Similar Questions
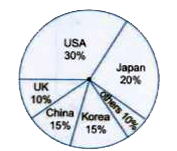
The following pie chart shows the foreign Direct Investment in India during 2019-2020. Write an analytic paragraph showing the general trends and the necessary details. Compare the segments where relevant.
View SolutionThe line graph given below shows the number of Fans and Washing Machines produced by Ruby Electricals between 2015 and 2020. Summarise and write an analytic paragraph highlighting the main trends and the necessary details. Compare wherever relevant.

View Solution
Knowledge Check
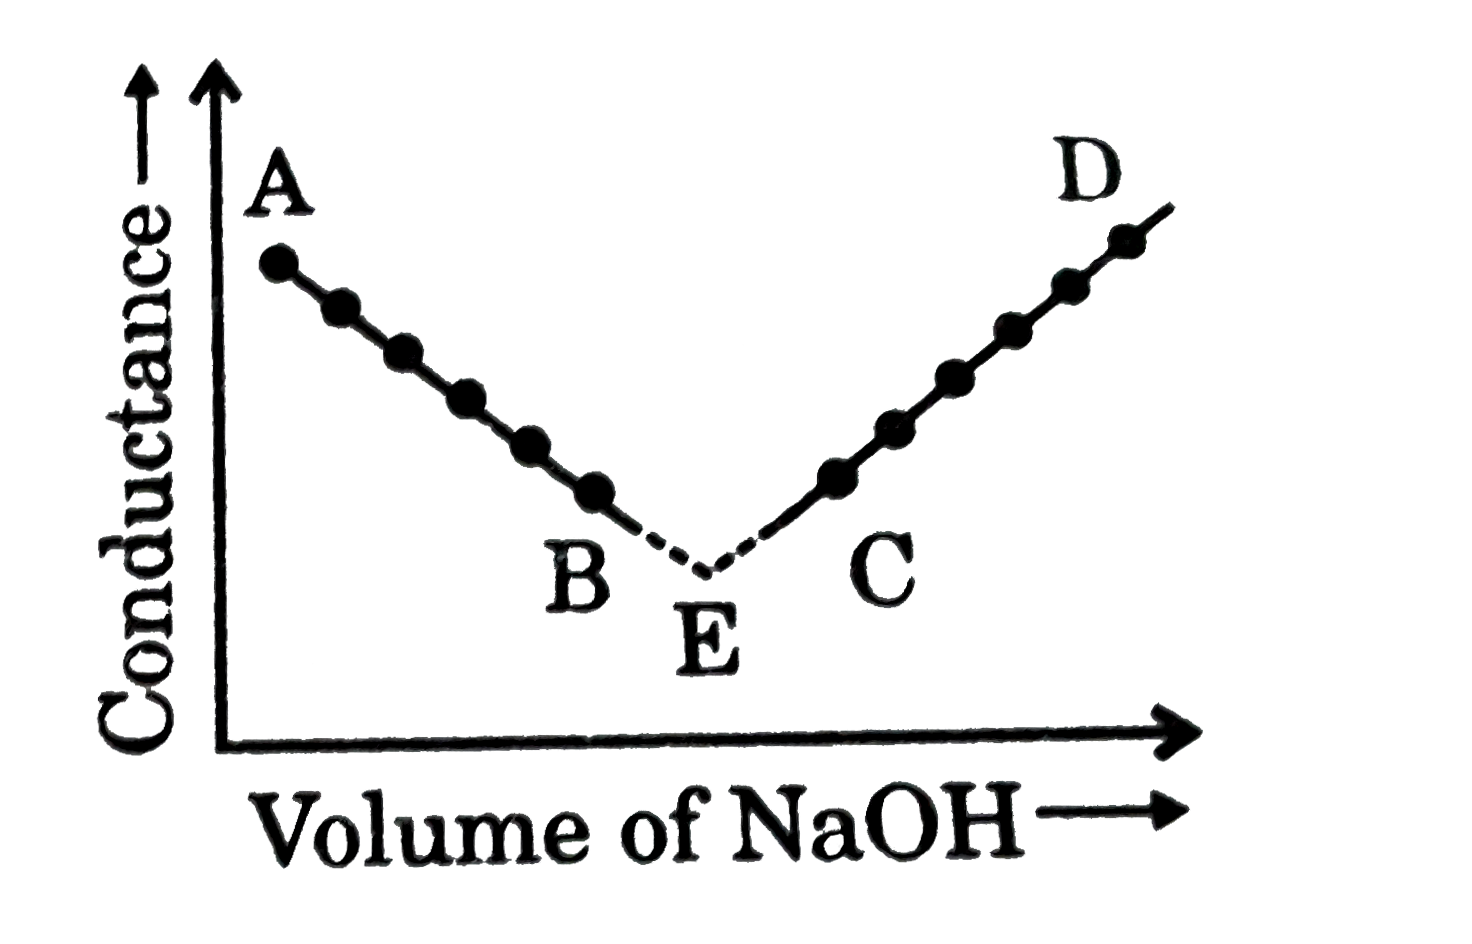
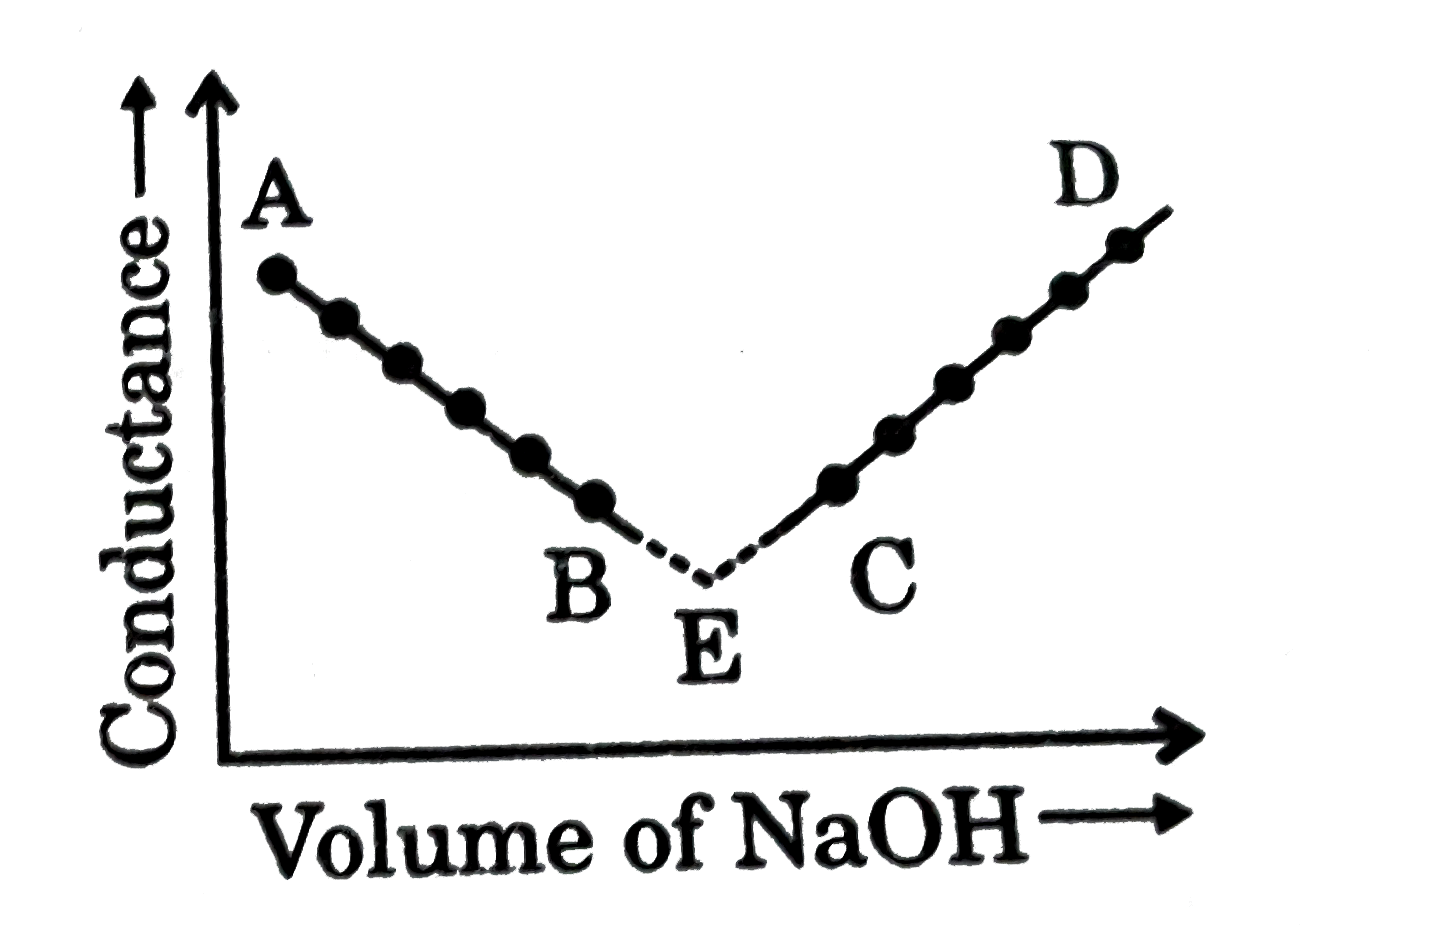
The principle on conductometric titration is based in the fact that during the titration, one of the ions is replaced by the other and invariably thses two ions differ in the ionic conductivity with the result that the conductivity of the solution varies during the course of the titration.Take,for example,the titration between strong acid, say HCl. and a strong base, say NaOH.Before NaOH is added the conuctance of HCl solution has a high value due ti the persence if highly hydrogen ions.As NaOH is added,H+ ions are the replaced by relatively slower moving Na+ ions.Consequently, the conductance of the solution decrease and this continues right upto the enuivalence point where the solution contains only NaCL.Beyond the equivalence point if more of NaOH is added, then the solution contains an excess of the fast moving OH− with the result that its as more of NaoH added, we plot the conductance value vs the amount of NaOH added we get curve of the type shown in figure.The descending portion AB represents the conductance before the equivalence point (solution cintains a mixture if acid HCl and the salt NaCL and the ascending portion CD represents the conductances after the equivalence point (solution contains the salt NaCL and the excess of NaOH). The point E which repersents only the minimum conductance is alkali and thus repersents the equivalence point.This point can, however, be obtained by the extrapoltion of the lines AB and CD and therefore one is not very particular in location this point experimentally as it is in the case of ordinary acid -base involving the acid base indicators
LET us take the specific exaanple of acetic acid being titration against NaOH.Before the addition the of alkali, the solution shows poor conductance due to feeble inization of acetic acid.Initially the addtion of alkali causes not only the replacement of H+ by Na+ but also suppresses the thus the conductance of the solution decrease in the begnning .But very soon the conductance starts increasing as addetion NaOH thus causing neutralizes the undissociated HAc to HAc with strong condutance eletroyte Na+Ac−.The increase in conducting OH− ions gtthe graph near the highly equivalence point actual equivalence point can as usual be ontained by the extrapoiation method
In all thses graphs it been assumed that the vloume change due addition of solution from burette in negligible heane vloume change of the sloution in beaker the conuctance of which is measured is almost constant throughout the measurement
the nature of curve obtained for the titration between weak acid vs strong base as described in the above will beA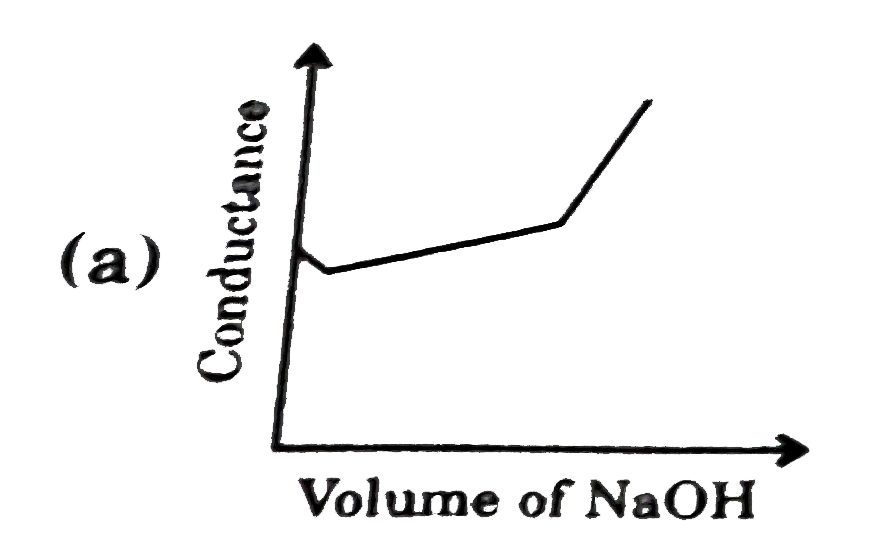 B
B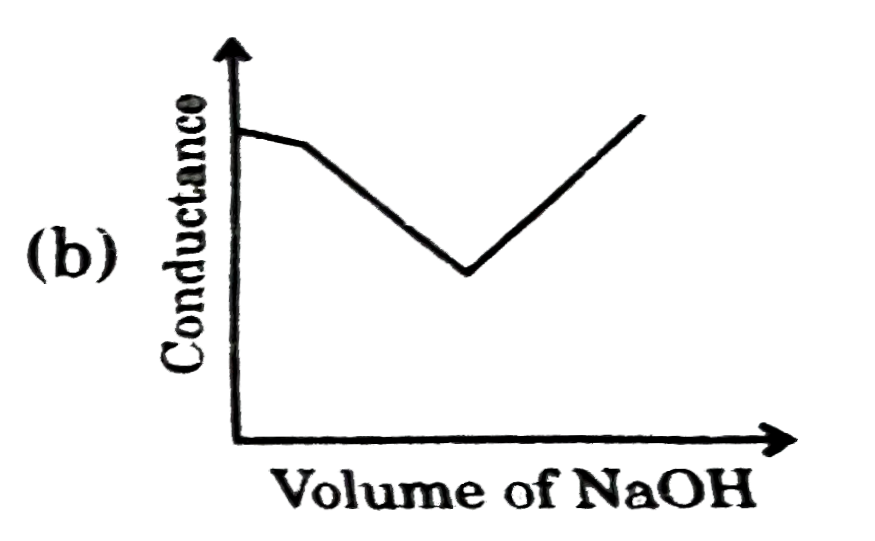 C
C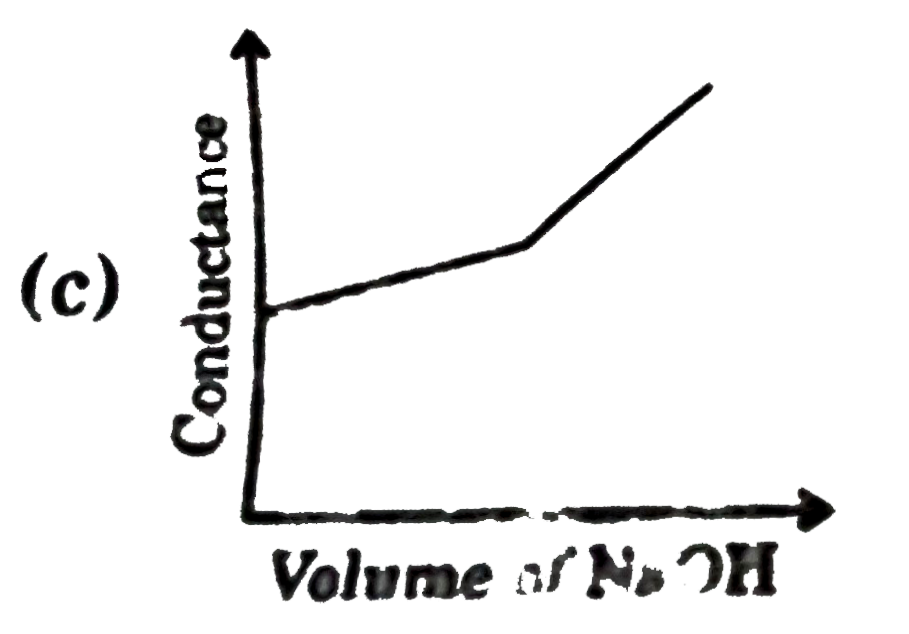 D
D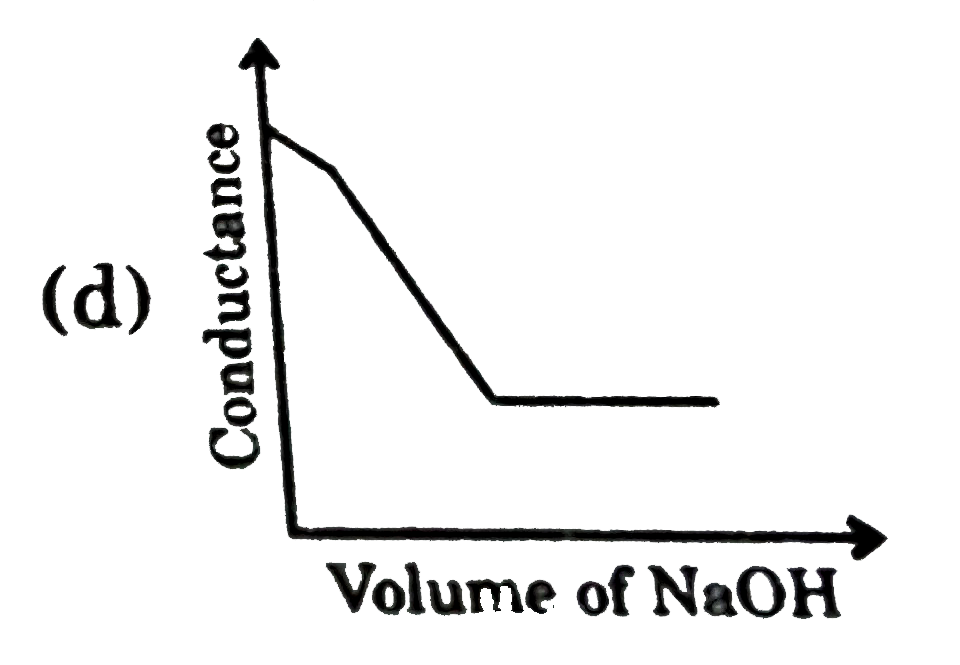
The principle on conductometric titration is based in the fact that during the titration, one of the ions is replaced by the other and invariably thses two ions differ in the ionic conductivity with the result that the conductivity of the solution varies during the course of the titration.Take,for example,the titration between strong acid, say HCl. and a strong base, say NaOH.Before NaOH is added the conuctance of HCl solution has a high value due ti the persence if highly hydrogen ions.As NaOH is added,H+ ions are the replaced by relatively slower moving Na+ ions.Consequently, the conductance of the solution decrease and this continues right upto the enuivalence point where the solution contains only NaCL.Beyond the equivalence point if more of NaOH is added, then the solution contains an excess of the fast moving OH− with the result that its as more of NaoH added, we plot the conductance value vs the amount of NaOH added we get curve of the type shown in figure.The descending portion AB represents the conductance before the equivalence point (solution cintains a mixture if acid HCl and the salt NaCL and the ascending portion CD represents the conductances after the equivalence point (solution contains the salt NaCL and the excess of NaOH). The point E which repersents only the minimum conductance is alkali and thus repersents the equivalence point.This point can, however, be obtained by the extrapoltion of the lines AB and CD and therefore one is not very particular in location this point experimentally as it is in the case of ordinary acid -base involving the acid base indicators
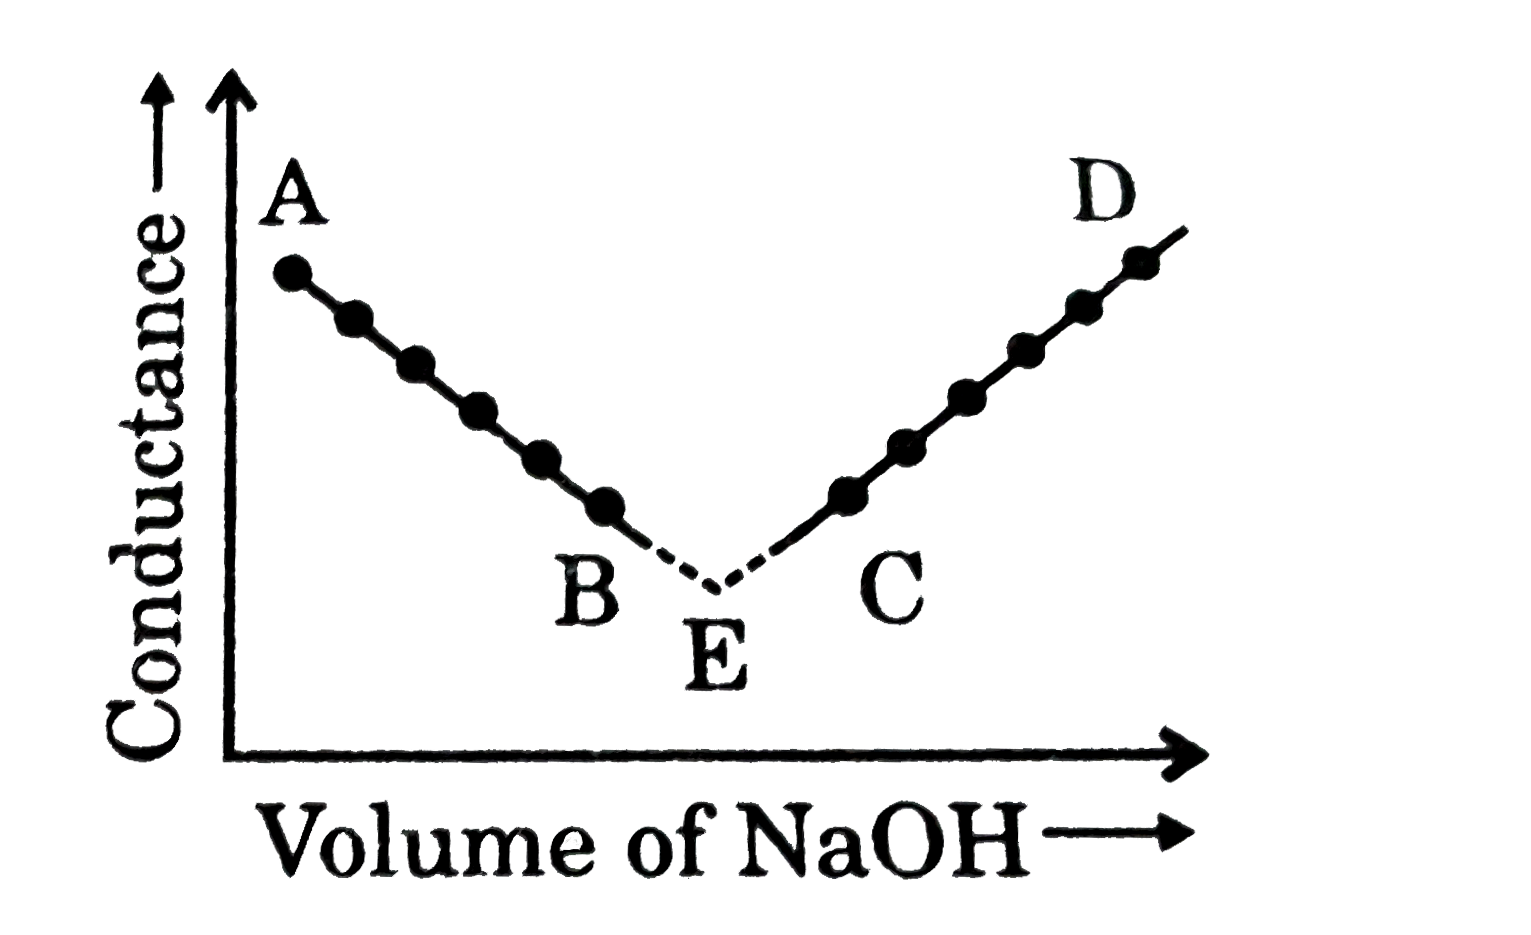
LET us take the specific exaanple of acetic acid being titration against NaOH.Before the addition the of alkali, the solution shows poor conductance due to feeble inization of acetic acid.Initially the addtion of alkali causes not only the replacement of H+ by Na+ but also suppresses the thus the conductance of the solution decrease in the begnning .But very soon the conductance starts increasing as addetion NaOH thus causing neutralizes the undissociated HAc to HAc with strong condutance eletroyte Na+Ac−.The increase in conducting OH− ions gtthe graph near the highly equivalence point actual equivalence point can as usual be ontained by the extrapoiation method
In all thses graphs it been assumed that the vloume change due addition of solution from burette in negligible heane vloume change of the sloution in beaker the conuctance of which is measured is almost constant throughout the measurement
If a 100 ml solution of 0.1 MHBr is titration using a very concentrated solution of NaOH then the conductivity (specific conductance0 of this solution at the equivalence wil be (assume volume change is negligible due addition of NaOH). Report your answer after mulitiplying it with 100 inSm−1
[Given : λ∘(Na+)=8×10⁻³Sm2mol−1,λ∘(Br−)=4×10⁻³Sm2mol−1]A6B12C15D24The principle on conductometric titration is based in the fact that during the titration, one of the ions is replaced by the other and invariably thses two ions differ in the ionic conductivity with the result that the conductivity of the solution varies during the course of the titration.Take,for example,the titration between strong acid, say HCl. and a strong base, say NaOH.Before NaOH is added the conuctance of HCl solution has a high value due ti the persence if highly hydrogen ions.As NaOH is added,H+ ions are the replaced by relatively slower moving Na+ ions.Consequently, the conductance of the solution decrease and this continues right upto the enuivalence point where the solution contains only NaCL.Beyond the equivalence point if more of NaOH is added, then the solution contains an excess of the fast moving OH− with the result that its as more of NaoH added, we plot the conductance value vs the amount of NaOH added we get curve of the type shown in figure.The descending portion AB represents the conductance before the equivalence point (solution cintains a mixture if acid HCl and the salt NaCL and the ascending portion CD represents the conductances after the equivalence point (solution contains the salt NaCL and the excess of NaOH). The point E which repersents only the minimum conductance is alkali and thus repersents the equivalence point.This point can, however, be obtained by the extrapoltion of the lines AB and CD and therefore one is not very particular in location this point experimentally as it is in the case of ordinary acid -base involving the acid base indicators
LET us take the specific exaanple of acetic acid being titration against NaOH.Before the addition the of alkali, the solution shows poor conductance due to feeble inization of acetic acid.Initially the addtion of alkali causes not only the replacement of H+ by Na+ but also suppresses the thus the conductance of the solution decrease in the begnning .But very soon the conductance starts increasing as addetion NaOH thus causing neutralizes the undissociated HAc to HAc with strong condutance eletroyte Na+Ac−.The increase in conducting OH− ions gtthe graph near the highly equivalence point actual equivalence point can as usual be ontained by the extrapoiation method
In all thses graphs it been assumed that the vloume change due addition of solution from burette in negligible heane vloume change of the sloution in beaker the conuctance of which is measured is almost constant throughout the measurement
The most appropriate titration curve ibtained when a mixture of a strong acid (say HCl) and a weak acid (sayCH3COOH0 is titration with (say NaOH) will beA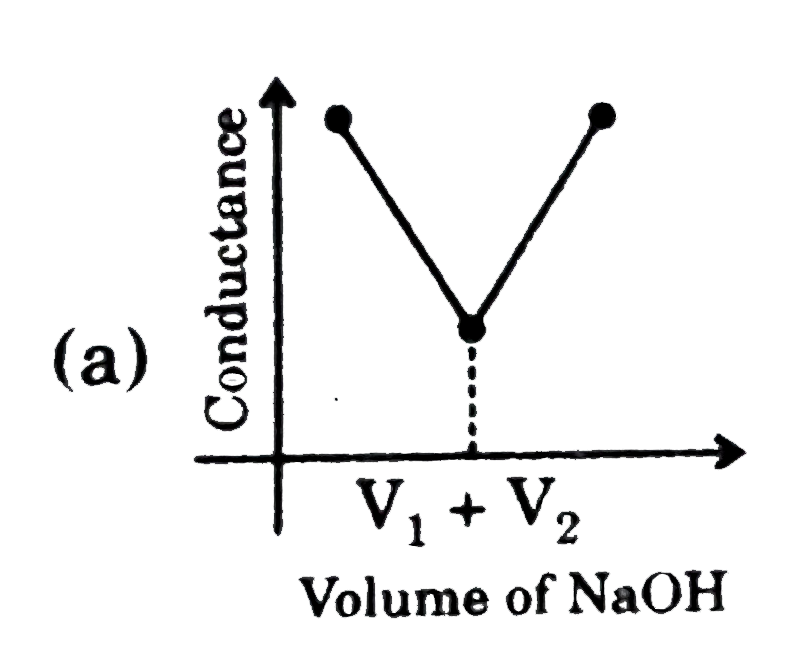 B
B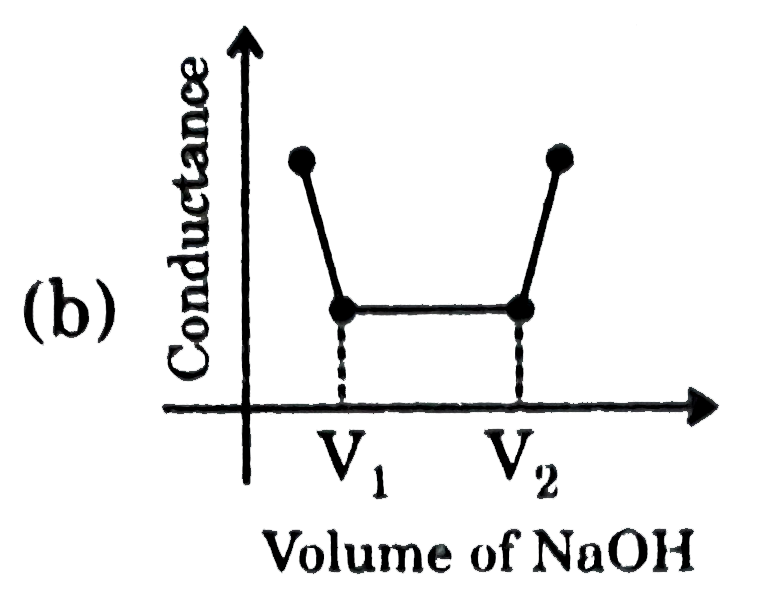 C
C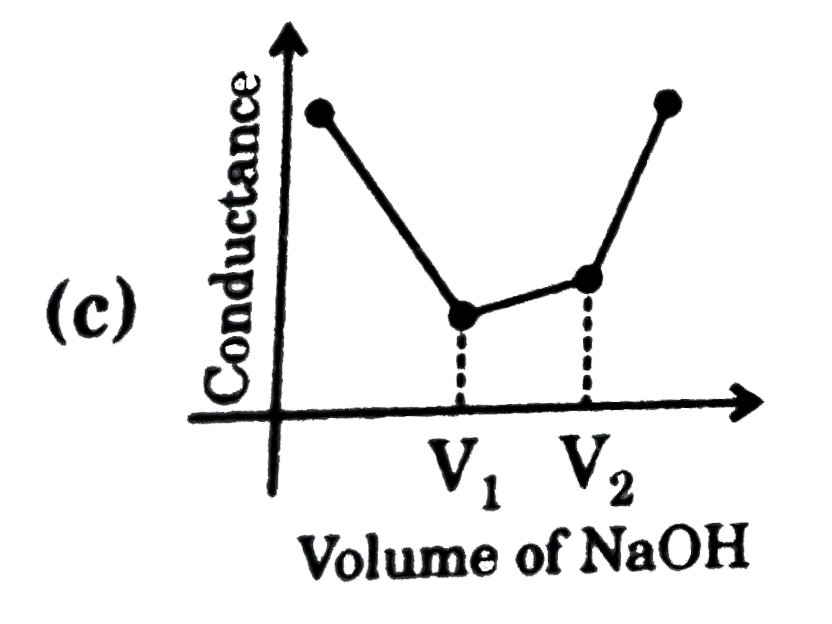 D
D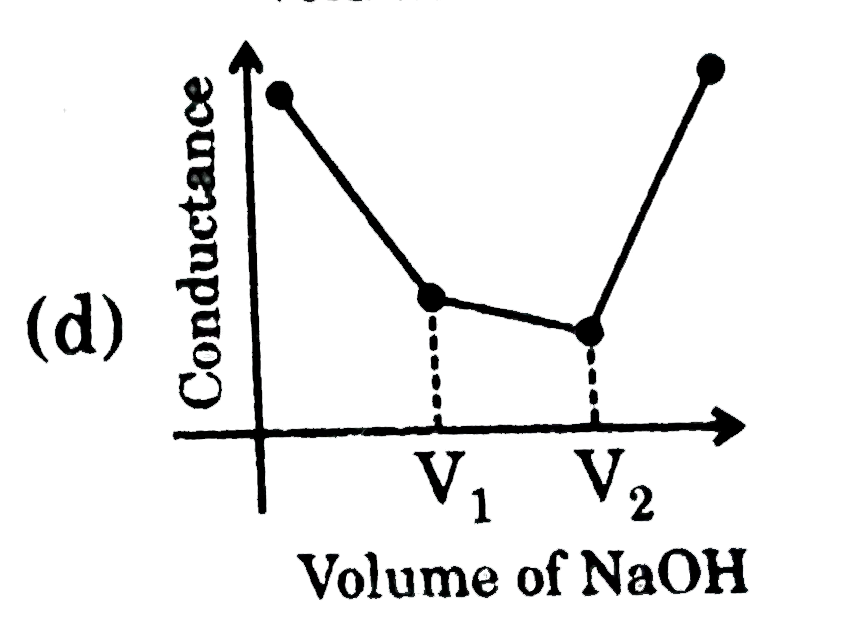
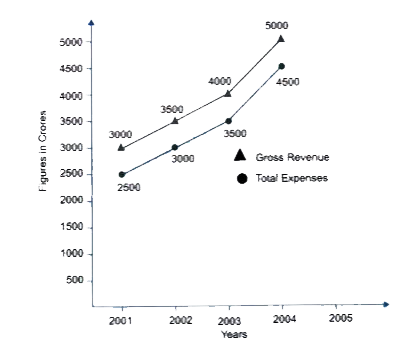
The Line graph given below represents Railway Finance from 2001-2002 to 2004-2005 (Northern Zone). It breaks down the gross revenue collected as well as the total expenses incurred during these years. Summarise and write an analytic paragraph highlighting the general trend and necessary details. Compare wherever relevant.
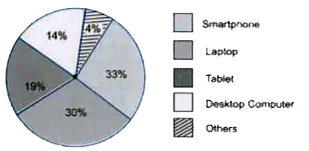
View SolutionThe pie-chart given below illustrates how internet users of aged 17+ prefer to browse the web. Summarise by writing an analytic paragraph in 150-200 words given necessary details and the general trend. Compare where relevant.
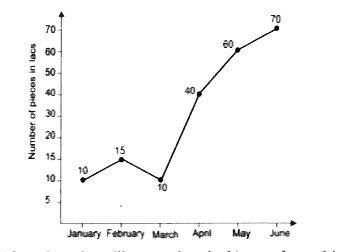
View SolutionThe line-graph chart given below breaks down the sales history of the famous Lifebuoy brand in soap in the first six months of the year, from January to June. Write an analytic paragraph in 150–200 words after selecting and reporting the main features. Make comparions where necessary.
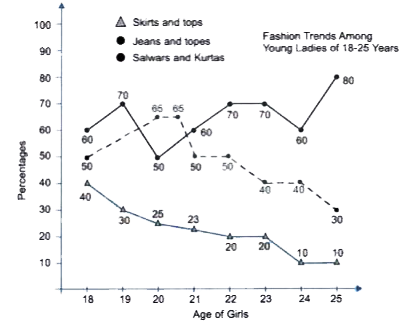
View SolutionThe line graph shown below illustrates the main trends in garments of young ladies of 18 to 25 years. Summarise and write an analytic paragraph in your own words highlighting the main features and details. Compare wherever relevant.
View Solution
