The table below gives information about some of the world's most studied languages. Give an analytic description in a paragraph highlighting and reporting the main features. Don't forget to make comparisons where relevant.
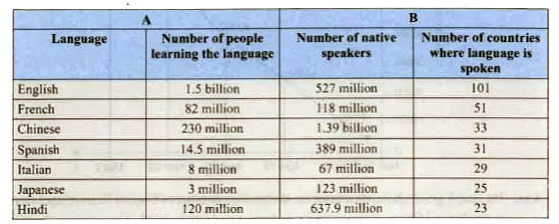
The given table illustrates some revealing facts about seven most popular languages in the world. The table allows comparison between the number of people who study a language versus those who speak it as a mother tongue. It also shows how many countries have speakers of both A and B.
The dominance of English is quite evident. 1.5 billion people are learning English all over the world. Chinese and Hindi, here, hold poor second and third positions. 230 million and 120 million are the number of people learning Chinese and Hindi respectively. French is the fourth popular language that is being learnt by 82 million people.
Chinese and Hindi dominate so far as the number of native speakers is concerned. 1.3 billion native speakers speak Chinese while Hindi has about 640 million native speakers. English is a poor third at 527 million and Spanish holds the fourth position with 389 million pushing back French at number 4 with 118 million native speakers. Italian and Japanese are at the lowest legs of the ladder.
English shows its prominence as a true global language. It is spoken and studied in more than a hundred countries. French and Chinese follow English with their presence in 51 and 33 countries respectively. Spanish, Italian, Japanese and Hindi are spoken in 31, 29, 25 and 23 countries respectively. Overall, more people are learning English than all the other languages combined, together. However, Chinese is getting popularity among the learners. Hindi is being studied more than Spanish, Italian and Japanese combined together. English seems to be unbeatable as it is studied and learnt in 101 countries.
Topper's Solved these Questions
- COMPOSITION - II (WRITING ANALYTICAL PARAGRAPH ON MAP/CHART/REPORT/ LINE GRAPH)BOOK - FULL MARKSCHAPTER - COMPOSITION - II (WRITING ANALYTICAL PARAGRAPH ON MAP/CHART/REPORT/ LINE GRAPH)EXERCISE - ANALYTIC STUDY OF REPORTS
3 Videos
- COMPOSITION - II (WRITING ANALYTICAL PARAGRAPH ON MAP/CHART/REPORT/ LINE GRAPH)BOOK - FULL MARKSCHAPTER - COMPOSITION - II (WRITING ANALYTICAL PARAGRAPH ON MAP/CHART/REPORT/ LINE GRAPH)EXERCISE - ANALYTIC STUDY OF MAPS
3 Videos
- COMPOSITION - II (WRITING ANALYTICAL PARAGRAPH ON MAP/CHART/REPORT/ LINE GRAPH)BOOK - FULL MARKSCHAPTER - COMPOSITION - II (WRITING ANALYTICAL PARAGRAPH ON MAP/CHART/REPORT/ LINE GRAPH)EXERCISE - PIE CHARTS
4 Videos
- CLOZE PASSAGEBOOK - FULL MARKSCHAPTER - CLOZE PASSAGEEXERCISE - Fill in the most appropriate option in each blank from those given below to complete the following passage.
112 Videos
- COMPOSITION-IBOOK - FULL MARKSCHAPTER - COMPOSITION-IEXERCISE - IV. OFFICIAL LETTERS ON ALL SITUATIONS (SOLVED EXAMPLES)
29 Videos
Similar Questions
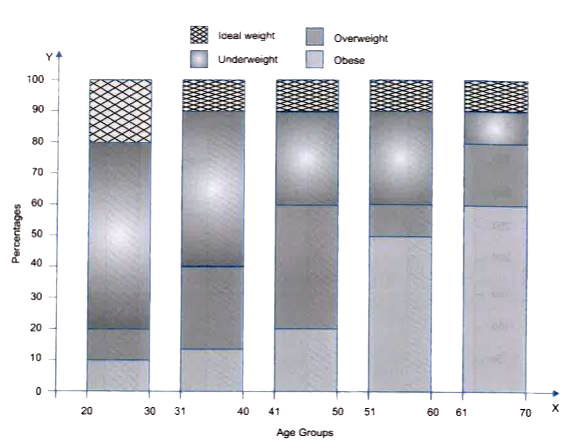
The chart given below illustrates the weight measurements of people in the United States of America in 2020. Summarise the information in an analytic paragraph of 150-200 words by selecting and reporting the main features. Make comparisons where relevant.
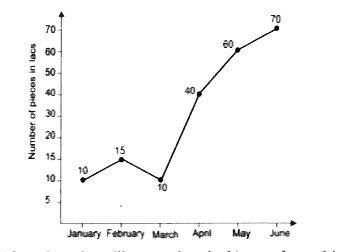
View SolutionThe line-graph chart given below breaks down the sales history of the famous Lifebuoy brand in soap in the first six months of the year, from January to June. Write an analytic paragraph in 150–200 words after selecting and reporting the main features. Make comparions where necessary.
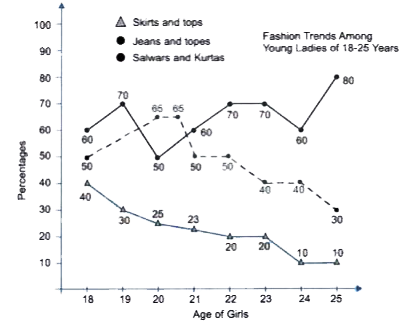
View SolutionThe line graph shown below illustrates the main trends in garments of young ladies of 18 to 25 years. Summarise and write an analytic paragraph in your own words highlighting the main features and details. Compare wherever relevant.
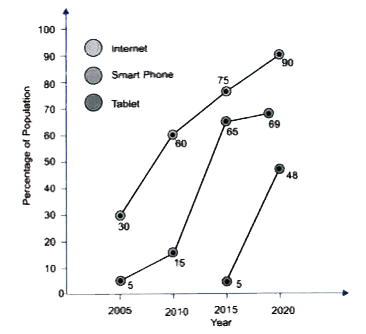
View SolutionThe graph shows the recent technological revolution in India in recent years. Summarises the information by selecting and reporting the main features. Make comparisons where necessary.
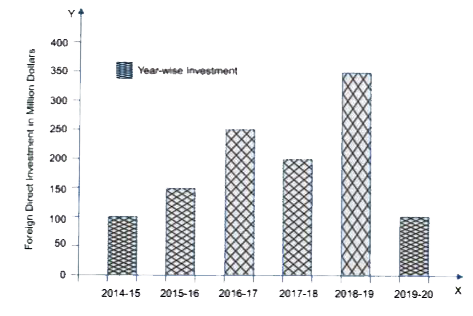
View SolutionThe bar chart given below illustrates the total Foreign Direct Investment (FDI) into India from all over the world. Summarise and write an analytic paragraph selecting the main features and giving all the necessary details. Compare where you find it relevant.
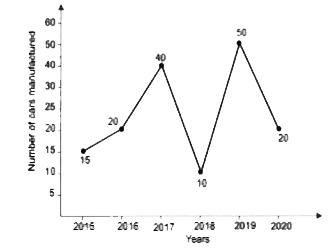
View SolutionThe line graph given below breaks down the number of cars produced in Standard Automobile Company from 2015 to 2020. Summarise the information by selecting and reporting the main features. Make comparisons where necessary.
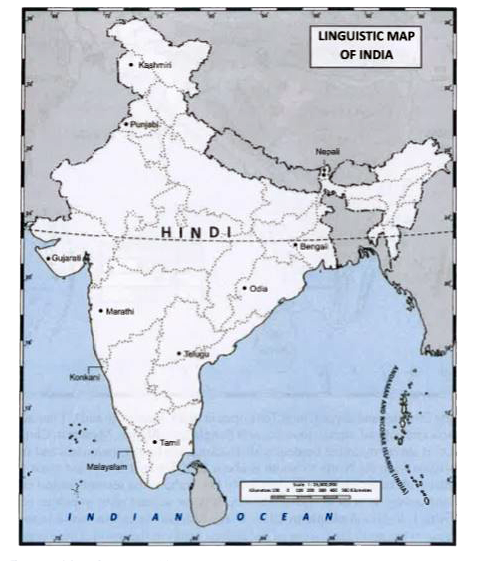
View SolutionThe map given above illustrates the main languages of India which are spoken in different parts of India. After studying the map write an analytic paragraph highlighting the number of major languages and the number of native speakers. Compare and contrast where relevant.
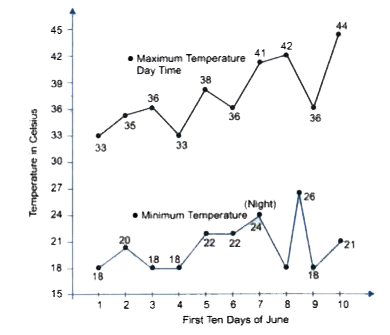
View SolutionThe line graph given above illustrates the maximum and minimum temperatures in the first ten days of June. Summarise the information by selecting and reporting the main features. Make comparisons where necessary.
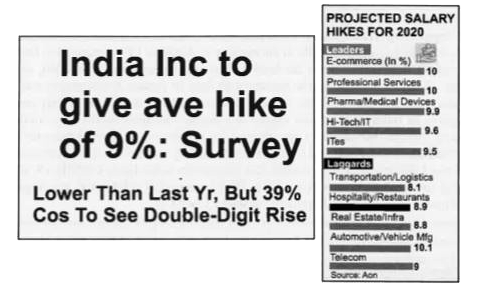
View SolutionThe given report presented by Times News Network illustrates the average salaries of India Inc. to its employees for 2020. Summarise by writing an analytic paragraph (150-200 words) highlighting the main features and details. Compare wherever relevant.
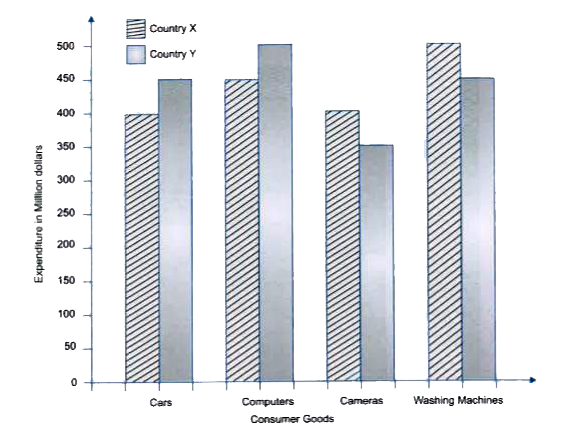
View SolutionThe chart below shows the expenditure of two countries X and Y on consumer goods in 2020 in US million dollars.
Summarise and write an analytic paragraph highlighting main features and necessary details in 150-200 words. Compare where relevant.
View Solution
