Consider the following statements :
The appropriate number of classes while constructing a frequency distribution should be chosen such that
1. the class-frequency that increases to a peak and then declines.
2. the class-frequency should cluster around the class mid point.
Which of the statements given is/are correct?
1 only
2 only
Both 1 and 2
Neither 1 nor 2
The correct Answer is:B
To solve the question, we need to analyze the two statements regarding the construction of a frequency distribution and determine their correctness.
1. Understanding the First Statement:
- The first statement claims that "the class frequency that increases to a peak and then declines" is appropriate when constructing a frequency distribution.
- In a well-constructed frequency distribution, we typically expect the frequencies to show a certain pattern, but they do not necessarily need to form a peak and then decline. Frequencies can vary based on the data set, and a peak followed by a decline is not a requirement for a good frequency distribution.
Conclusion: The first statement is false.
Hint: Consider how frequency distributions can vary based on the nature of the data. Not all distributions will have a peak.
2. Understanding the Second Statement:
- The second statement asserts that "the class frequency should cluster around the class midpoint."
- This is a valid point. When constructing a frequency distribution, it is desirable for the frequencies to cluster around the midpoints of the classes. This helps in accurately representing the data and understanding its distribution.
Conclusion: The second statement is true.
Hint: Think about how midpoints are calculated and their significance in representing the data accurately.
3. Final Conclusion:
- Based on the analysis, we find that only the second statement is correct while the first statement is incorrect. Therefore, the correct answer is that only the second statement is correct.
Final Answer:
Only the second statement is correct.
- The first statement claims that "the class frequency that increases to a peak and then declines" is appropriate when constructing a frequency distribution.
- In a well-constructed frequency distribution, we typically expect the frequencies to show a certain pattern, but they do not necessarily need to form a peak and then decline. Frequencies can vary based on the data set, and a peak followed by a decline is not a requirement for a good frequency distribution.
- The second statement asserts that "the class frequency should cluster around the class midpoint."
- This is a valid point. When constructing a frequency distribution, it is desirable for the frequencies to cluster around the midpoints of the classes. This helps in accurately representing the data and understanding its distribution.
- Based on the analysis, we find that only the second statement is correct while the first statement is incorrect. Therefore, the correct answer is that only the second statement is correct.
Only the second statement is correct.
Topper's Solved these Questions
- SETS, RELATIONS, FUNCTIONS AND NUMBER SYSTEM BOOK - NDA PREVIOUS YEARSCHAPTER - SETS, RELATIONS, FUNCTIONS AND NUMBER SYSTEM EXERCISE - MCQ
271 Videos
- TRIGONOMETRY - RATIO & IDENTITY , TRIGONOMETRIC EQUATIONSBOOK - NDA PREVIOUS YEARSCHAPTER - TRIGONOMETRY - RATIO & IDENTITY , TRIGONOMETRIC EQUATIONSEXERCISE - MCQ
238 Videos
Similar Questions
Knowledge Check
Consider the following statements The appropriate number of classes while constructing a frequency distribution should be chosen such that1 The class frequency first increases to a peak and then declines. 2 The class-frequency should chuster around the class mid point Which of the statements given is/are correct?
A1onlyB2onlyCBoth 1 and 2DNeithe 1 nor 2How many classes a frequency distribution should have?
ALarge numberBSmall numberCNeither very large nor very small numberDNot more than 10.Consider the following distribution

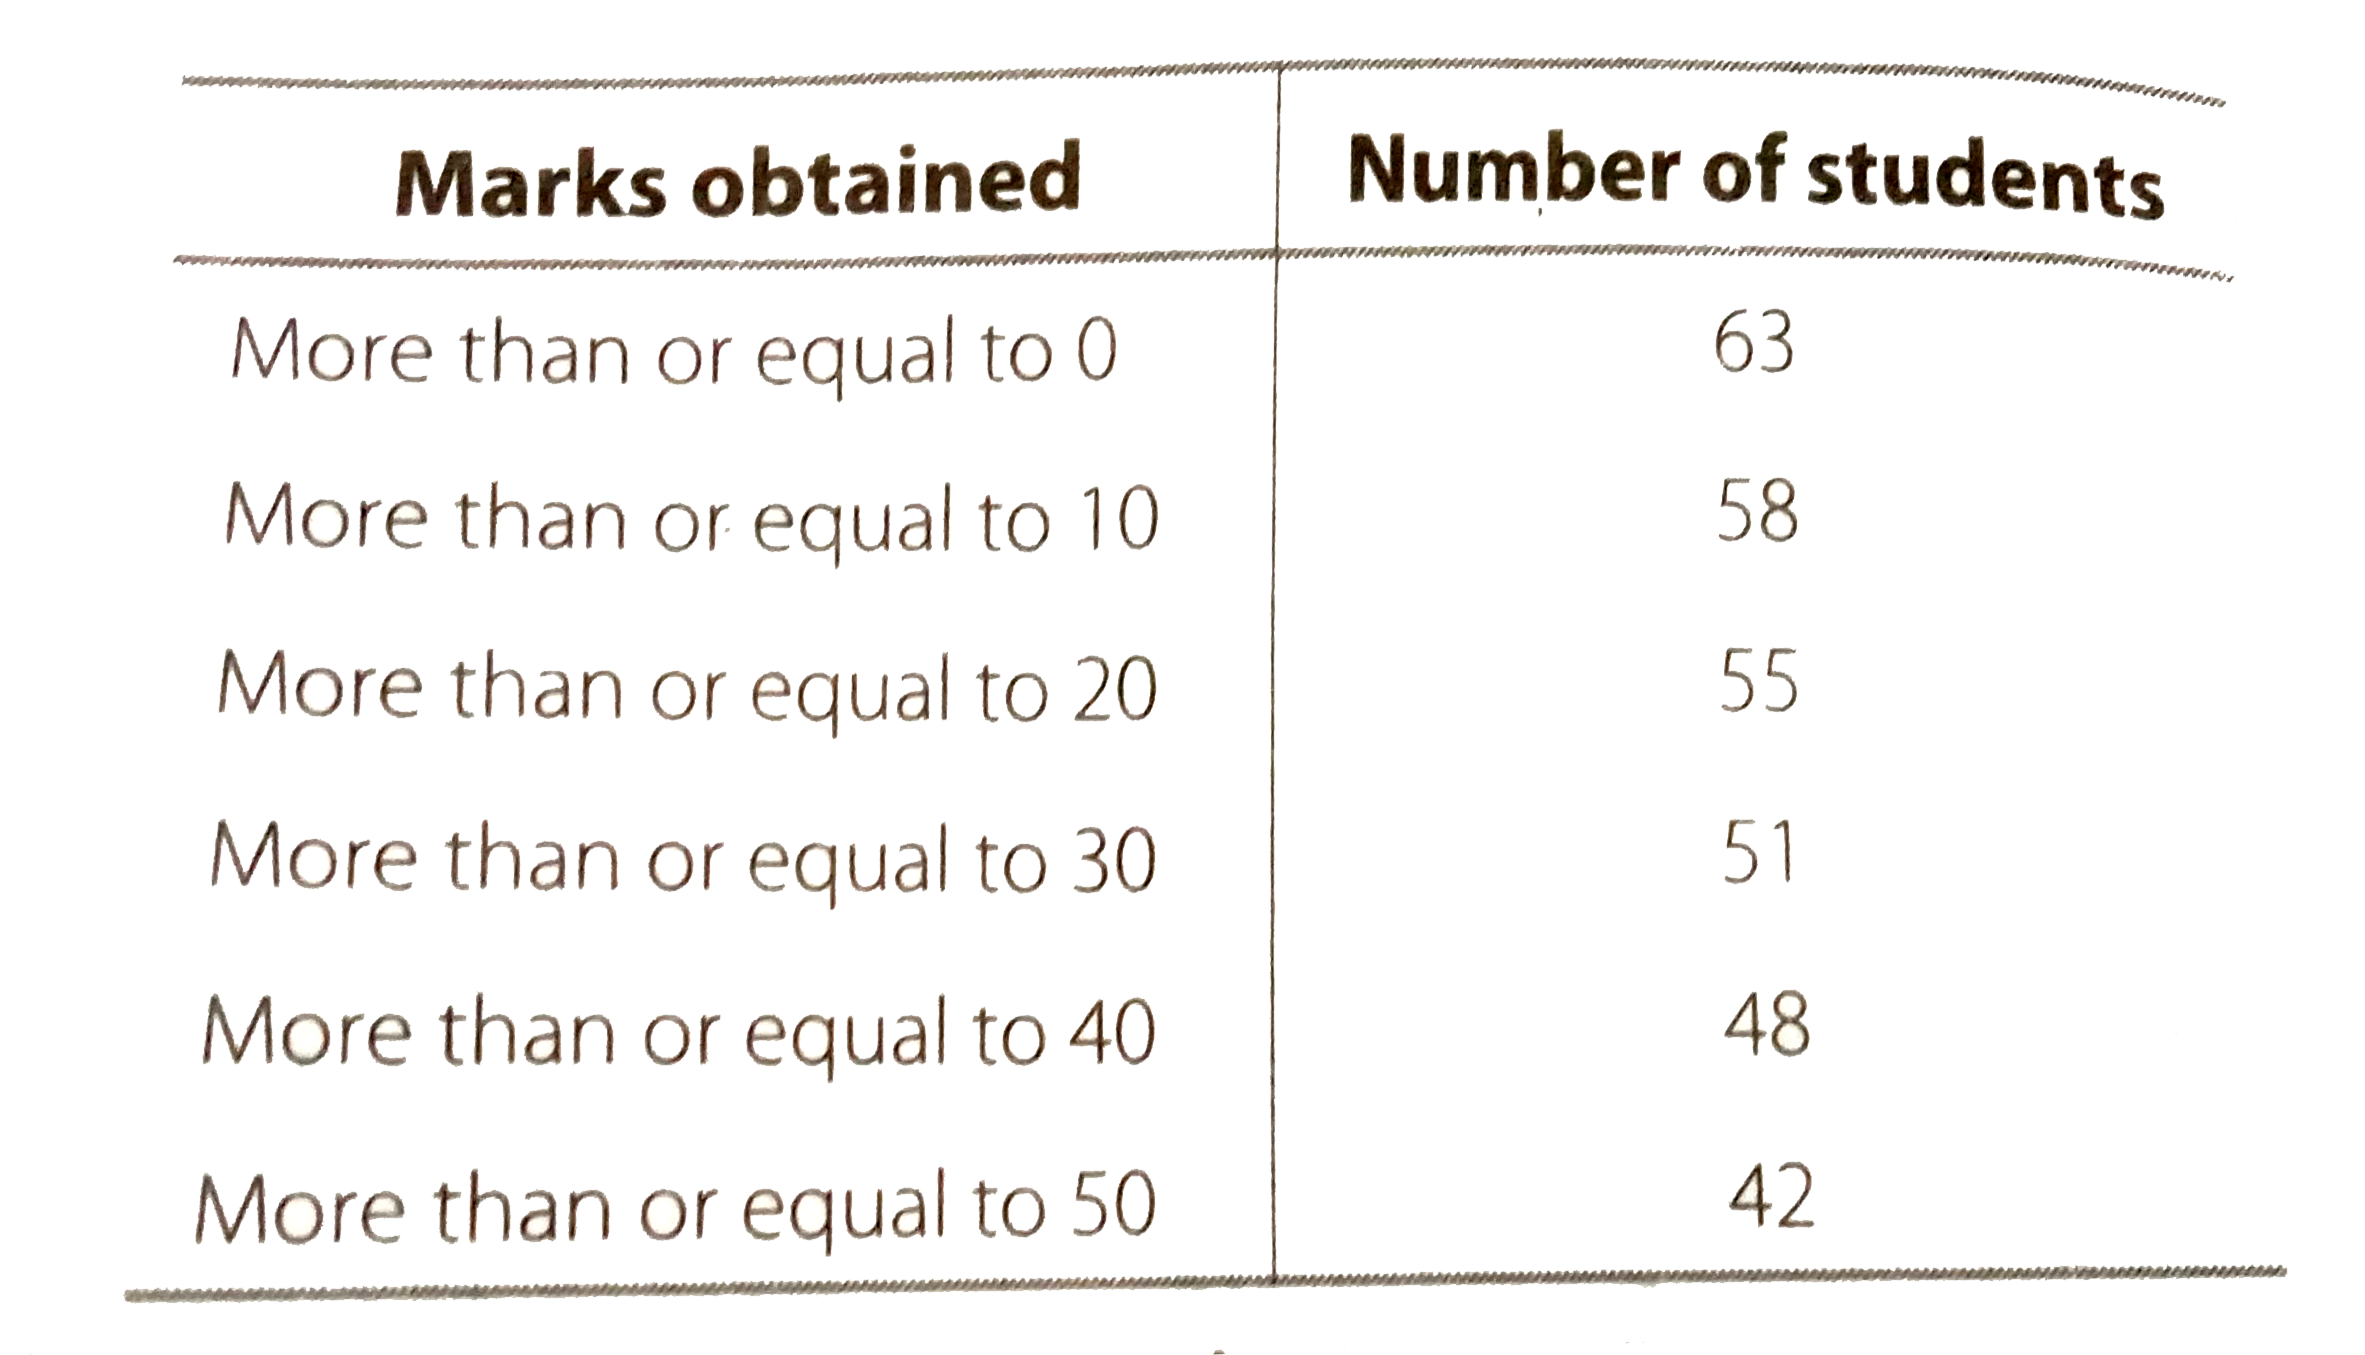
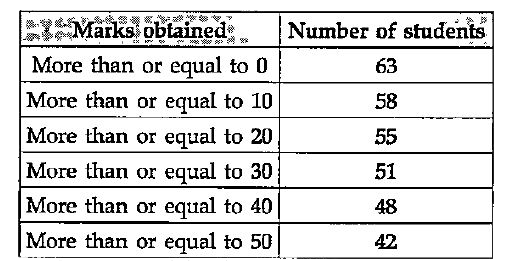
Frequency of the class 30-40 isA3B4C48D51
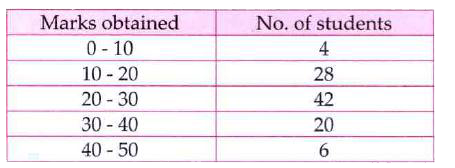
The marks of students of a class are given in following frequency distribution. Find the mean.

View SolutionDetermine the upper limit of the modal class of the following frequency distribution:

View SolutionConsider the following frequency distribution

The upper limit of the median class in
View SolutionLet m be the mid - point and l the upper class limit of a class in a continuous frequency distribution The lowe limit of the class is
View SolutionIf m is the mid-point and l is the upper limit of a class in a continous frequency distribution, then lower class limit of the class is
View Solution


