The average sales and standard deviation of sales for four months for a company are as follows:

During which month are the sales most consistent?
Month 1
Month 2
Month 3
Month 4
The correct Answer is:C
From visual observation of given table we can say that during month 3, the sales are most consistent.
Topper's Solved these Questions
- SETS, RELATIONS, FUNCTIONS AND NUMBER SYSTEM BOOK - NDA PREVIOUS YEARSCHAPTER - SETS, RELATIONS, FUNCTIONS AND NUMBER SYSTEM EXERCISE - MCQ
271 Videos
- TRIGONOMETRY - RATIO & IDENTITY , TRIGONOMETRIC EQUATIONSBOOK - NDA PREVIOUS YEARSCHAPTER - TRIGONOMETRY - RATIO & IDENTITY , TRIGONOMETRIC EQUATIONSEXERCISE - MCQ
238 Videos
Similar Questions

During which month did the company have he highest sales ?
View SolutionThe graph given below gives the actual and expected sales of cars of a company for 6 months. Study the graph and answer the questions that follow.
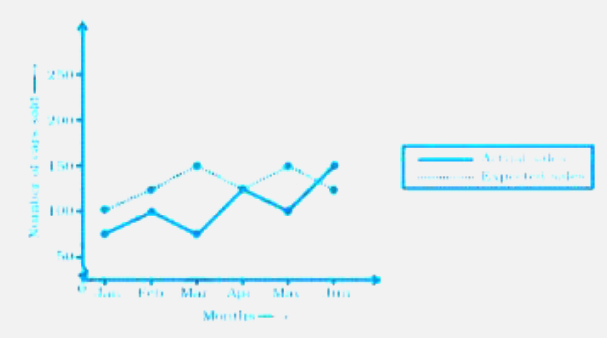
(a) In which month was the actual sales same as the expected sales?
(b) For which month(s) was (were) the difference in actual and expected sales the maximum?
(c) For which month(s) was (were) the difference in actual and expected sales the least?
(d) What was the total sales of cars in the months–Jan, Feb. and March?
(e) What is the average sales of cars in the last three months?
(f) Find the ratio of sales in the first three months to the last three months.
View Solution
Knowledge Check
The line chart given below shows the sales (in crores) of a complany for the years 2009 to 2016
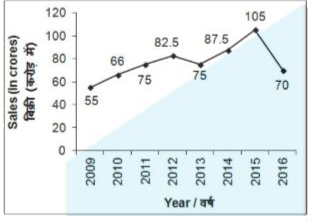
In how many years was the sale of the company more than the sale in 2011?A4B5C3D2The bar graph shows the annual sales of the different departments of a company. Study the diagram and answer the following questions.
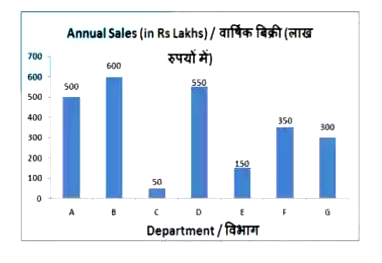
Which department has the second highest annual sales?ADBACBDFThe line chart given below shows the sales (in crores) of company A and B from July to December.
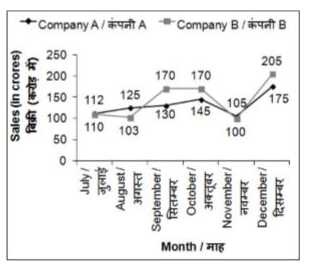
For how many months the sales of company B is more than the sales of company A?Aa)2Bb)3Cc)1Dd)4
Formation of table for the production and sales of a company in different years
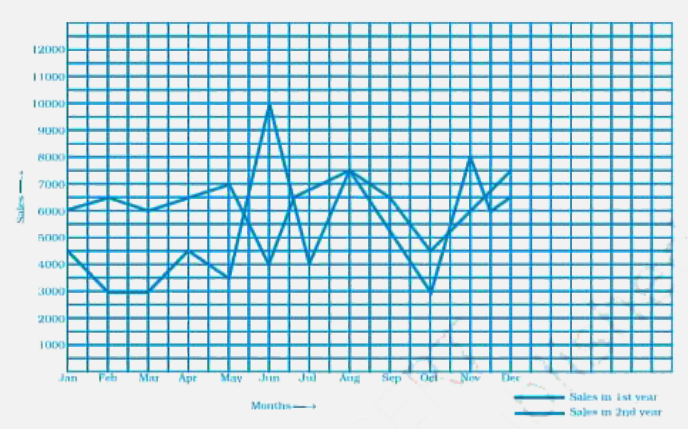
View SolutionFollowing graph shows a comparison of the approximate sale of items manufactured by a company for the first two years of its operation.
(a) In which months there was maximum difference in the sale of items of two years?
(b) In which year was there more stability in the sale of items ?
(c) In which month the sale remains the same in both the years ?
(d) In which month was the sales of first year less than that of second year?
View SolutionThe given graph shows the sale of story books in a bookshop for the first 6 months.
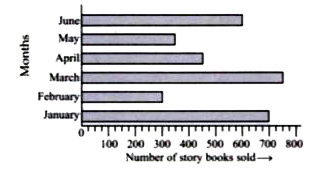
In which month, the sale of story books was 54 of the sale of books in June ?
View SolutionNishtha is a manager of a company selling laptops. She plans the target sale of 2000 laptops per month. She allocates necessary resources to carry out the plan. She has six salesmen working under her. She works with them, guiding and motivating them to achieve the target sales. At the end of the month, after comparison of actual sales with the target sales she found that actual sales exceeded the target sales. Identify, by quoting the lines from the above paragraph, the functions of management Nishtha is performing. Explain these functions.
View SolutionAbhay working in Tele Bharti as a salesperson. His monthly salary is just Rs. 200. But he gets the bonus as per the given rule. If he sells the simcards of Rs. X then his bonus will be Rs. [(x100)2+10]. In the first quarter of the year his average sale was Rs. 3000 per month. In the next 5 months his average sae was Rs. 5000 per month. In the last four months his average sale was Rs. 8000 per month. What is the average earning pre month for the whole year ?
View Solution
