The given graph shows the range of variation among population members for a trait determined by multiple genes. If this population is subjected to distruptive selection for several generations, Which of the following distributions is most likely to result?
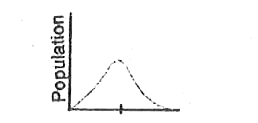 Solution in Telugu
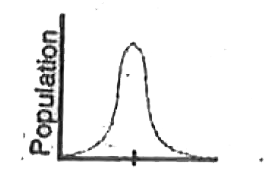
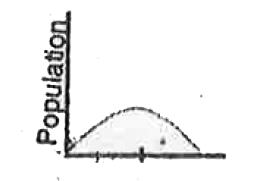
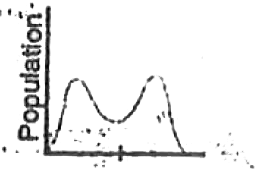
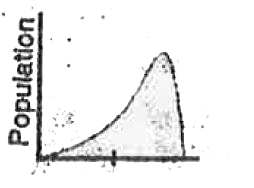
The correct Answer is:C
Step by step video, text & image solution for The given graph shows the range of variation among population members for a trait determined by multiple genes. If this population is subjected to distruptive selection for several generations, Which of the following distributions is most likely to result? by Biology experts to help you in doubts & scoring excellent marks in Class 12 exams.
Topper's Solved these Questions
- BOOK - AAKASH SERIESCHAPTER - EVOLUTIONEXERCISE - EXERCISE - I (BRIEF ACCOUNT OF EVOLUTION)19videos
EVOLUTION
- BOOK - AAKASH SERIESCHAPTER - EVOLUTIONEXERCISE - EXERCISE - I (EVOLUTION OF MAN)27videos
EVOLUTION
- BOOK - AAKASH SERIESCHAPTER - EVOLUTIONEXERCISE - EXERCISE - I (HARDY WEINBERG)3videos
EVOLUTION
- BOOK - AAKASH SERIESCHAPTER - DIGESTION AND ABSORPTIONEXERCISE - Exercise - III (Previous AIPMT/NEET Questions)24videos
DIGESTION AND ABSORPTION
- BOOK - AAKASH SERIESCHAPTER - EXCRETORY PRODUCTS AND THEIR ELIMINATIONEXERCISE - EXERCISE - III (PREVIOUS AIPMT/NEET QUESTIONS)18videos
EXCRETORY PRODUCTS AND THEIR ELIMINATION
Similar Questions
The periods of Mesozoic era
02:13View SolutionThe country, where most of the primitive men have been discovered is
View SolutionAt a particular locus, frequency of allele A is 0.6 and that of allele 'a' is 0.4. What would be the frequency of heterozygotes in a random mating population at equilibrium?
View SolutionWhich cells of Crypts of Lieberkuhn' secrete antibacterial lysozyme ?
01:51View SolutionThe part of nephron involved in active reabsorption of sodium is
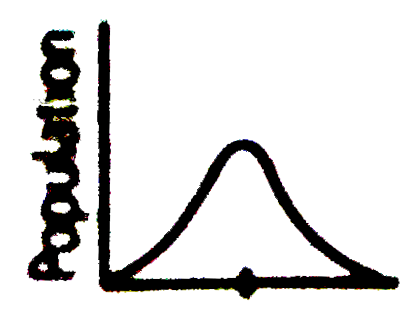
03:15View SolutionThe given graph shows the range of variation among population members for a trait determined by multiple genes. If this population is subjected to disruptive selection for several generations, which of the following distributions is most likely to result?
 02:26View Solution
Study the charactristics of a population represented in the graphs below. Mark the correct graph that represents the type of selection that this population is likely to undergo
02:41View SolutionStudy the charactristics of a population represented in the graphs below. Mark the correct graph that represents the type of selection that this population is likely to undergo
02:27View SolutionIf a trait A exists in 10% of a population of an asexually reproducing species and a trait B exists in 60% of the same population, which trait is likely to have arisen earlier?
02:21View SolutionIf a trait 'A' exists in 10% of a population of an asexually reproducing species and a trait 'B' exists in 60% of the same population, which trait is likely to have arisen earlier?
View Solution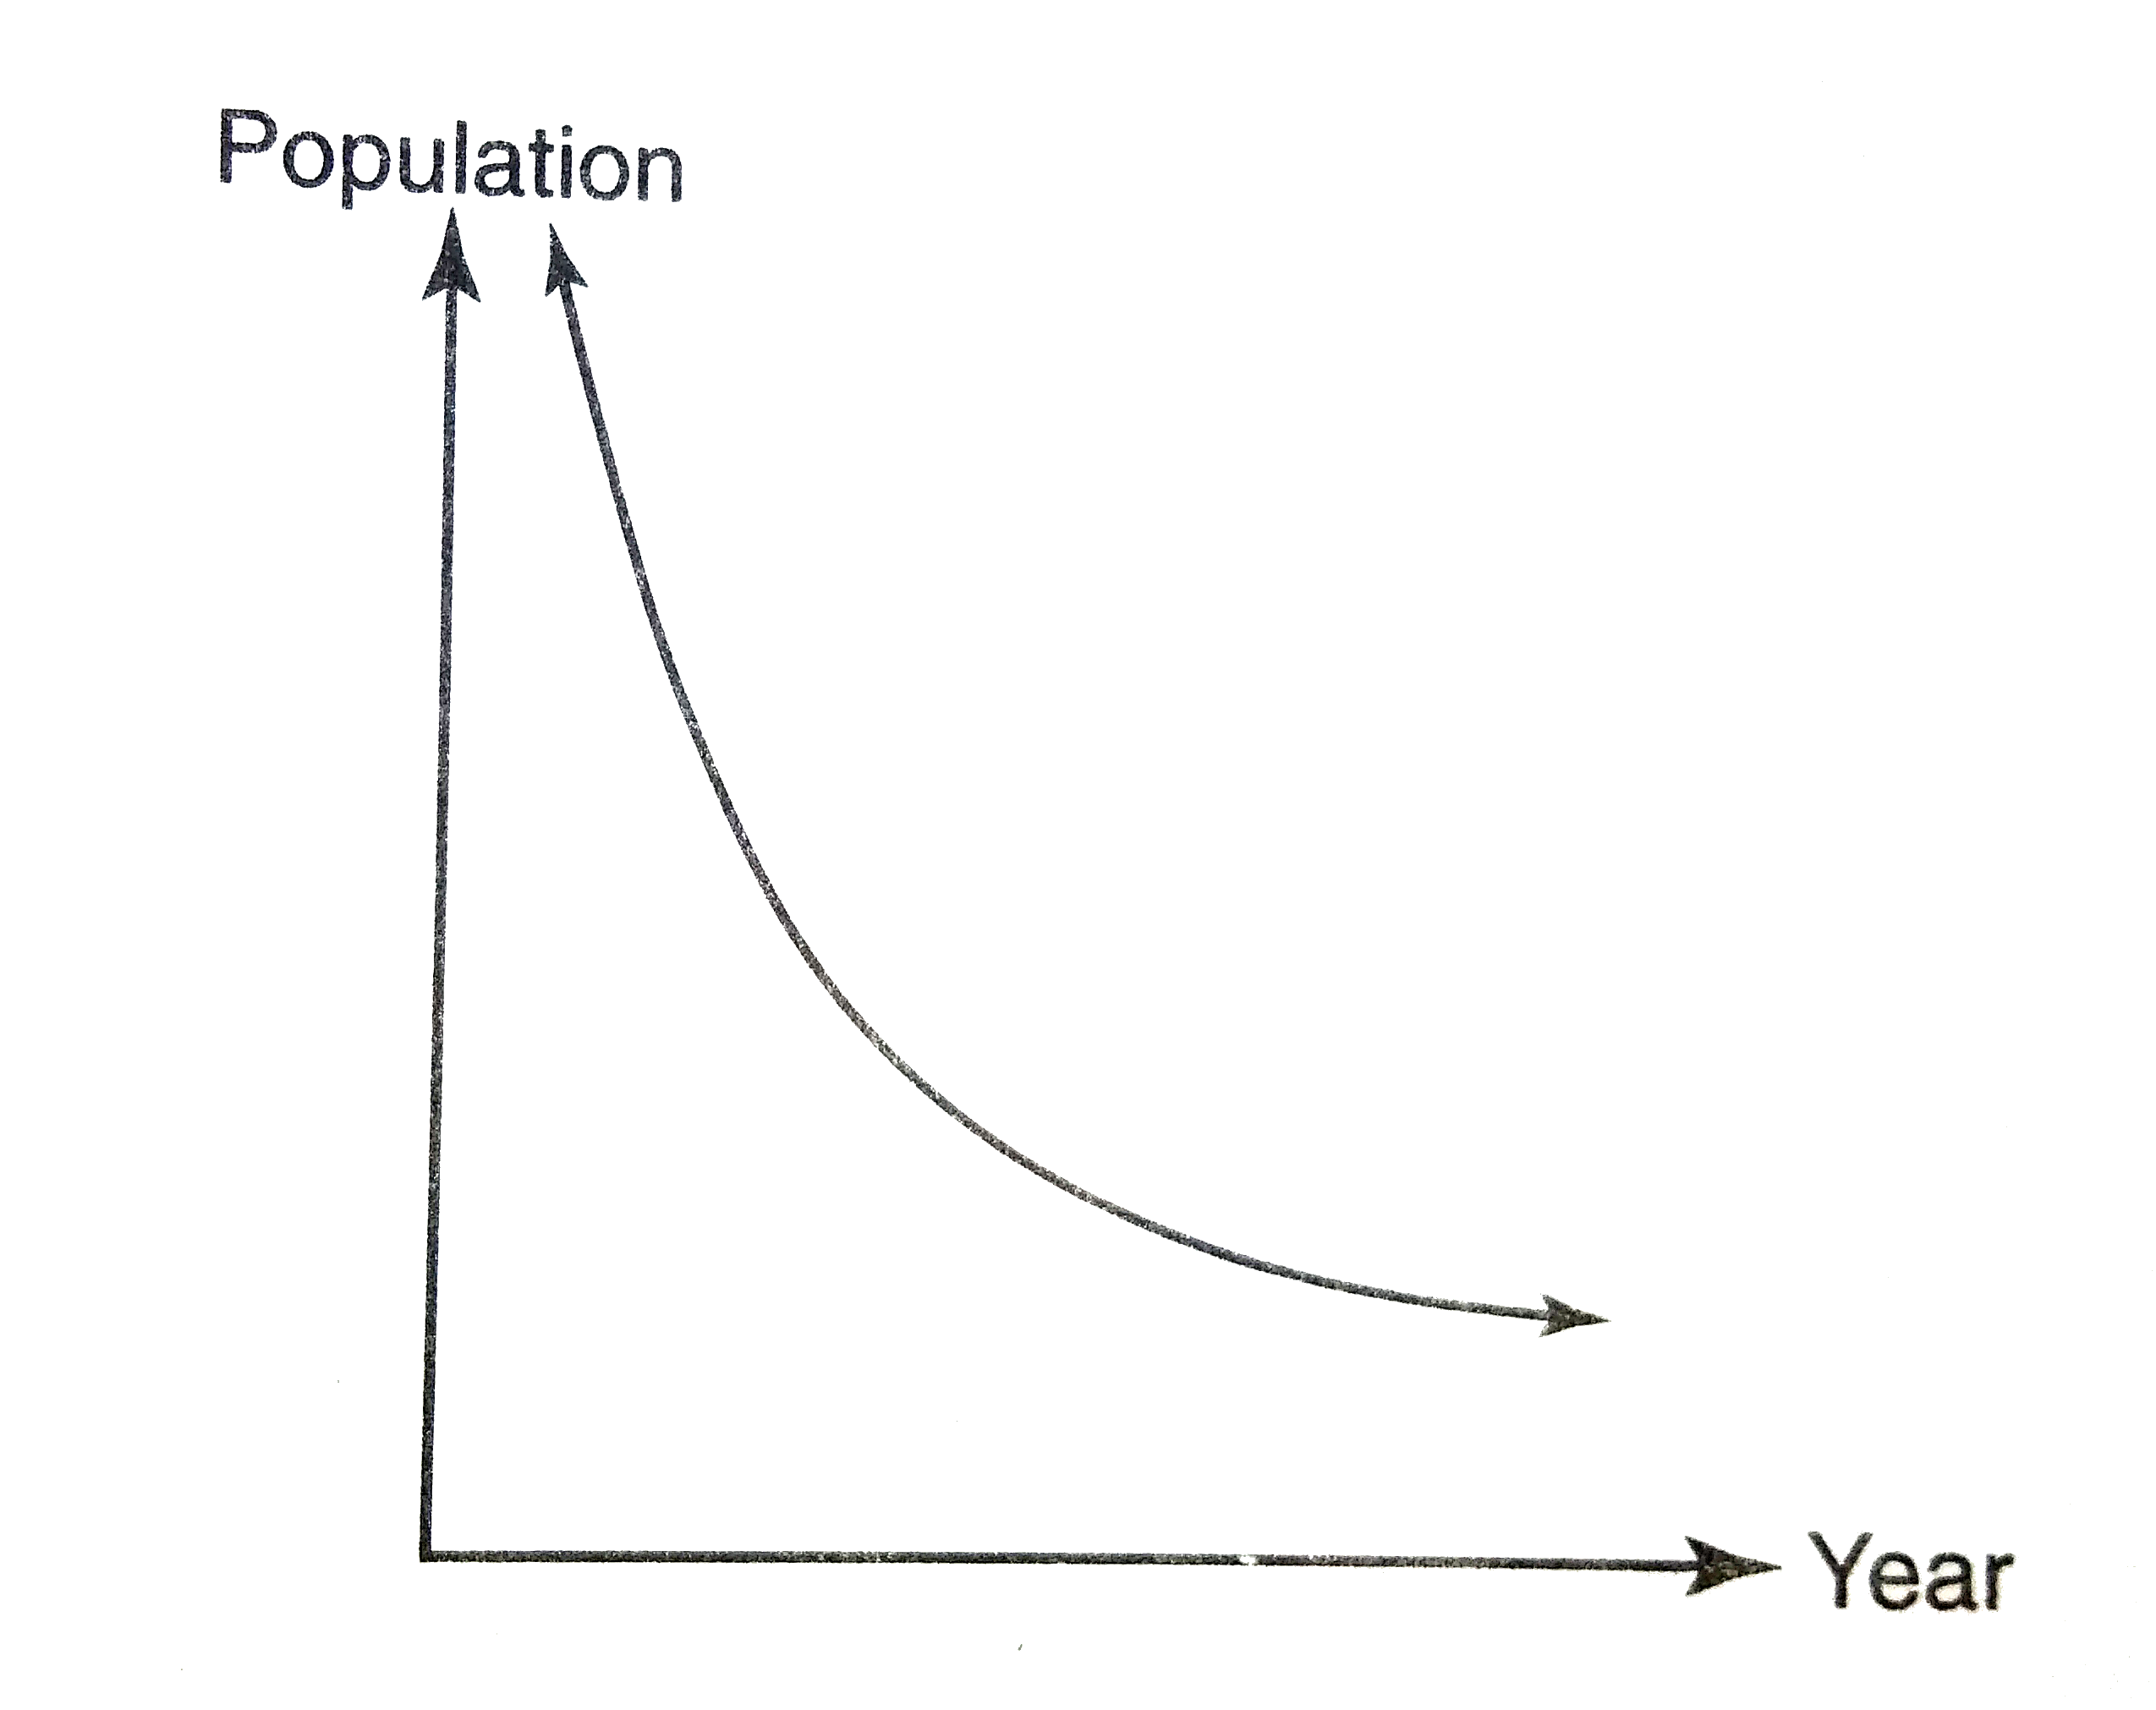
The graph above shows how the size of a country's population has changed over time. Which of the following are the most likely underlying reasons for the type of graph shown?04:17View SolutionThe following graph shows the range of variation among population members for a trait determined by multiple genes.
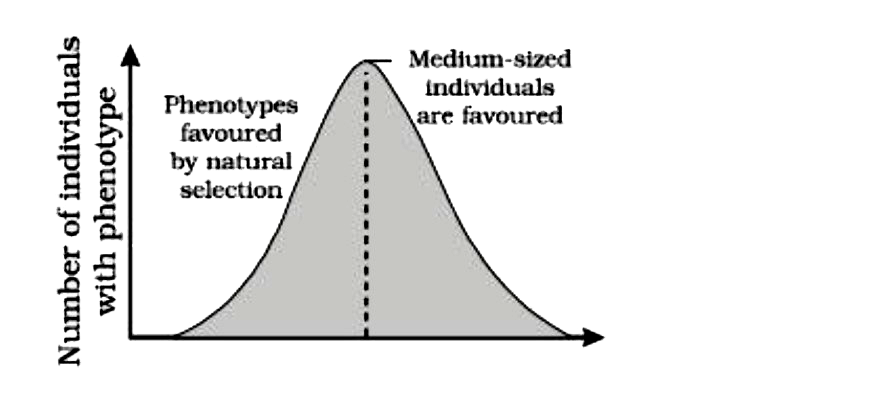
If this population is subject to stabilizing selection for several generations, which of the distribution is most likely to result ?03:53View SolutionIf trait A exists in 10% of a population of an asexually reproducing species and trait,B exists in 60% of the same population, which trait is likely to have arisen earlier?
04:34View SolutionWhich one of the following map shows the population distribution?
02:47View SolutionIf a trait A exists in 10% of a population of an asexually reproducing species and a trait B exists in 60% of the same population, which trait is likely to have arisen earlier?
01:51View Solution

