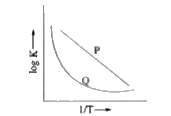
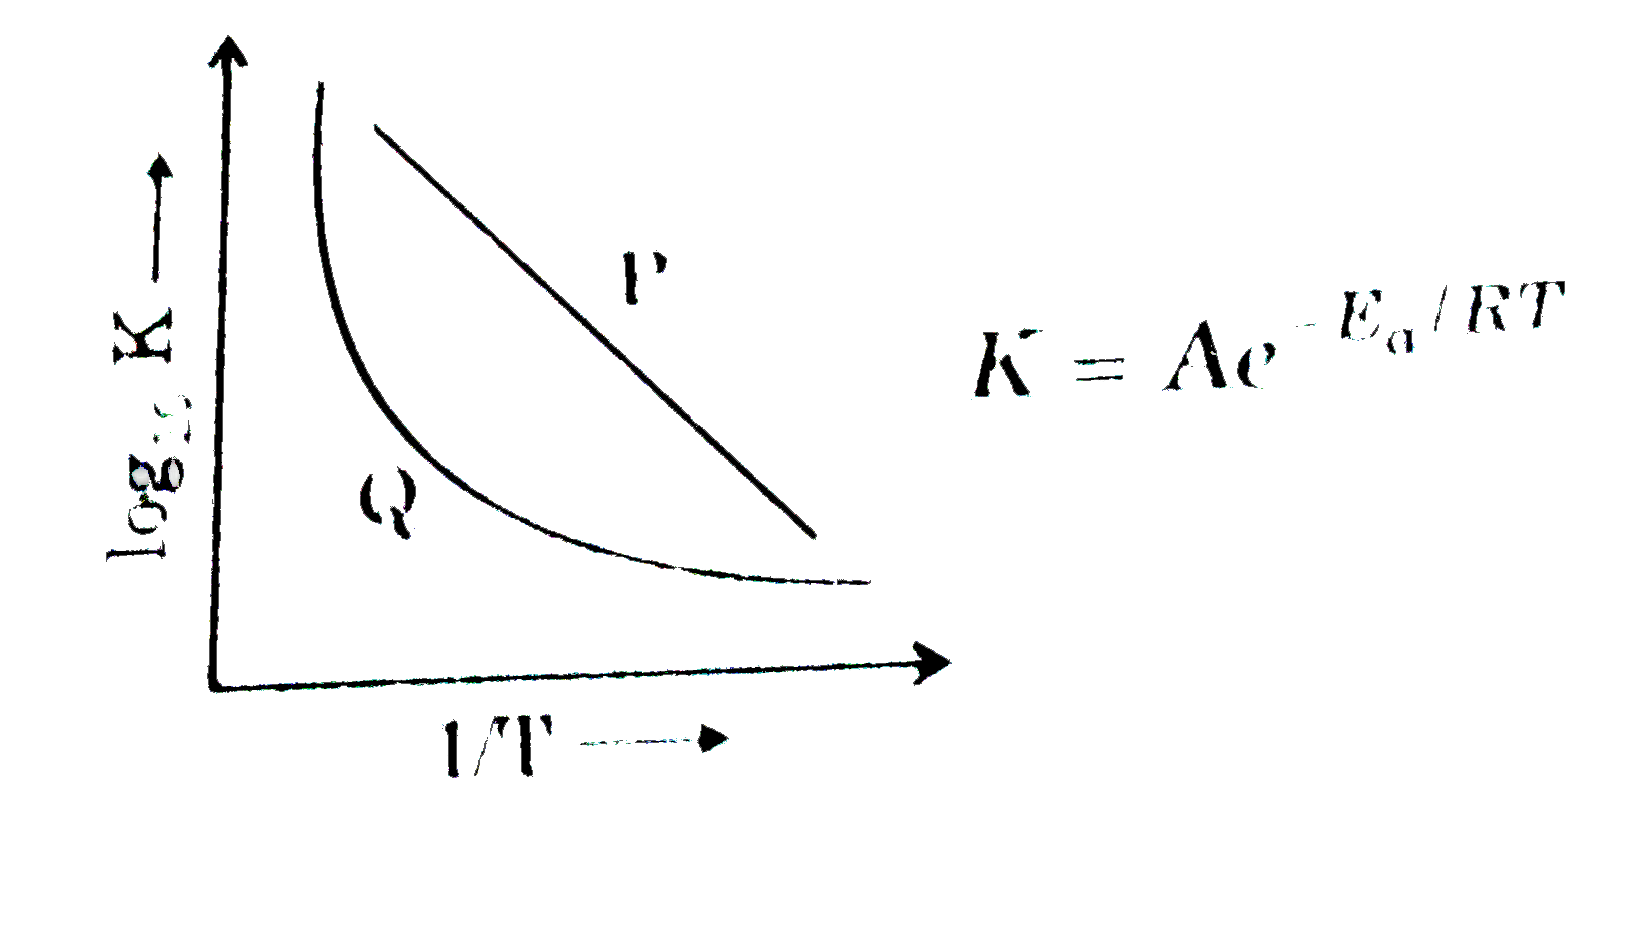
Which of the following statement(s) are true regarding the log K vs 1/T plots shown in the given diagram.

Plot P shows that the energy of activation is independent of temperatureSolution in Telugu
Plot P shows that the energy of activation is independent of temperature
Plot Q describes the behaviour of temperature dependence of energy of activation
Arrhenius behaviour is described by P.
None of these
The correct Answer is:A, B, C
K=A.e−Ea/RT,logK=logA−Ea2.303×1T, here m=(−EA2.303R)
Topper's Solved these Questions
- BOOK - AAKASH SERIESCHAPTER - CHEMICAL KINETICSEXERCISE - LEVEL-II(LECTURE SHEET EXERCISE-II LINKED COMPREHENSION TYPE QUESTIONS)9videos
CHEMICAL KINETICS
- BOOK - AAKASH SERIESCHAPTER - CHEMICAL KINETICSEXERCISE - LEVEL-II(LECTURE SHEET EXERCISE-III MATCH THE FOLLOWING QUESTIONS)3videos
CHEMICAL KINETICS
- BOOK - AAKASH SERIESCHAPTER - CHEMICAL KINETICSEXERCISE - LEVEL-1 (EXERCISE -II ORDER, MOLECULARITY, HALF LIFE:)34videos
CHEMICAL KINETICS
- BOOK - AAKASH SERIESCHAPTER - CHEMICAL KINETCSEXERCISE - EXERCISE - 3.245videos
CHEMICAL KINETCS
- BOOK - AAKASH SERIESCHAPTER - CHEMICAL THERMODYNAMICSEXERCISE - Additional Practice Exercise54videos
CHEMICAL THERMODYNAMICS
Similar Questions
A certain endothermic reaction: A→ Product, ΔH=+ve proceeds ina sequence of three elementary steps with the rate constant K1,K2 and K3 and each one having energy of activation E1,E2 and E3 respectively at 25∘C. The observed rate constannt for the reaction is equal to K3√K1K2.
A1,A2 and A3 are Arrhenius parameters respectively.
The observed energy of activation for the reaction is04:02View SolutionMatch the following columns
 04:25View Solution
Sucrose decompose in acid solution into glucose and fructose according to the first order rate law, with t12=3.00 hours. What fraction of sample of sucrose remains after 8 hours ?
View SolutionDiscuss on the kinetic spontaneity of a chemical reaction. Is a slow reaction spontaneous? Why?
01:41View SolutionWhich among the following is not an exact differential?
01:56View SolutionPlots of log vs.(1)/(T) plots shows an intercept of 2 on y-"axis" with a slope of 45^(@) for the studied reaction. Assuming that DeltaH^(@) and DeltaS^(@) as temperature independent, select the correct statement ( s ).
View SolutionWhich of the following statement are true regarding the log K vs. 1//T plot shown in the given diagram?
02:45View SolutionWhich of the following statement are true regarding the log K vs 1/T. Plot shown in the given diagram?
 05:06View Solution
Select the incorrect statements about the plots of ln K vs 1/T
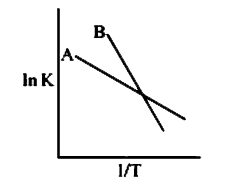
05:06View SolutionPlot ln K vs. 1/T for two reactions A and B are given below. Which reaction is more sensitive to temperature :-
 02:05View Solution
Which of the plots of ln K vs (1/T) is/are correct?
03:00View SolutionA graph plotted between logk versus 1/T for calculating activation energy is shown by
02:31View SolutionPlots of log K Vs 1T plots shows an intercept of 2 on y-axis with a slope of 45∘ for the studied reactions. Assuming that ΔH∘andΔS∘ as temperature independent, select the correct statement
04:43View SolutionPlots of log K Vs 1T plots shows an intercept of 2 on y-axis with a slope of 45∘ for the studied reactions. Assuming that ΔH∘andΔS∘ as temperature independent, select the correct statement
01:14View SolutionFor the Arrhenius equation, the slope for the plot ln k vs 1T is
03:12View Solution

