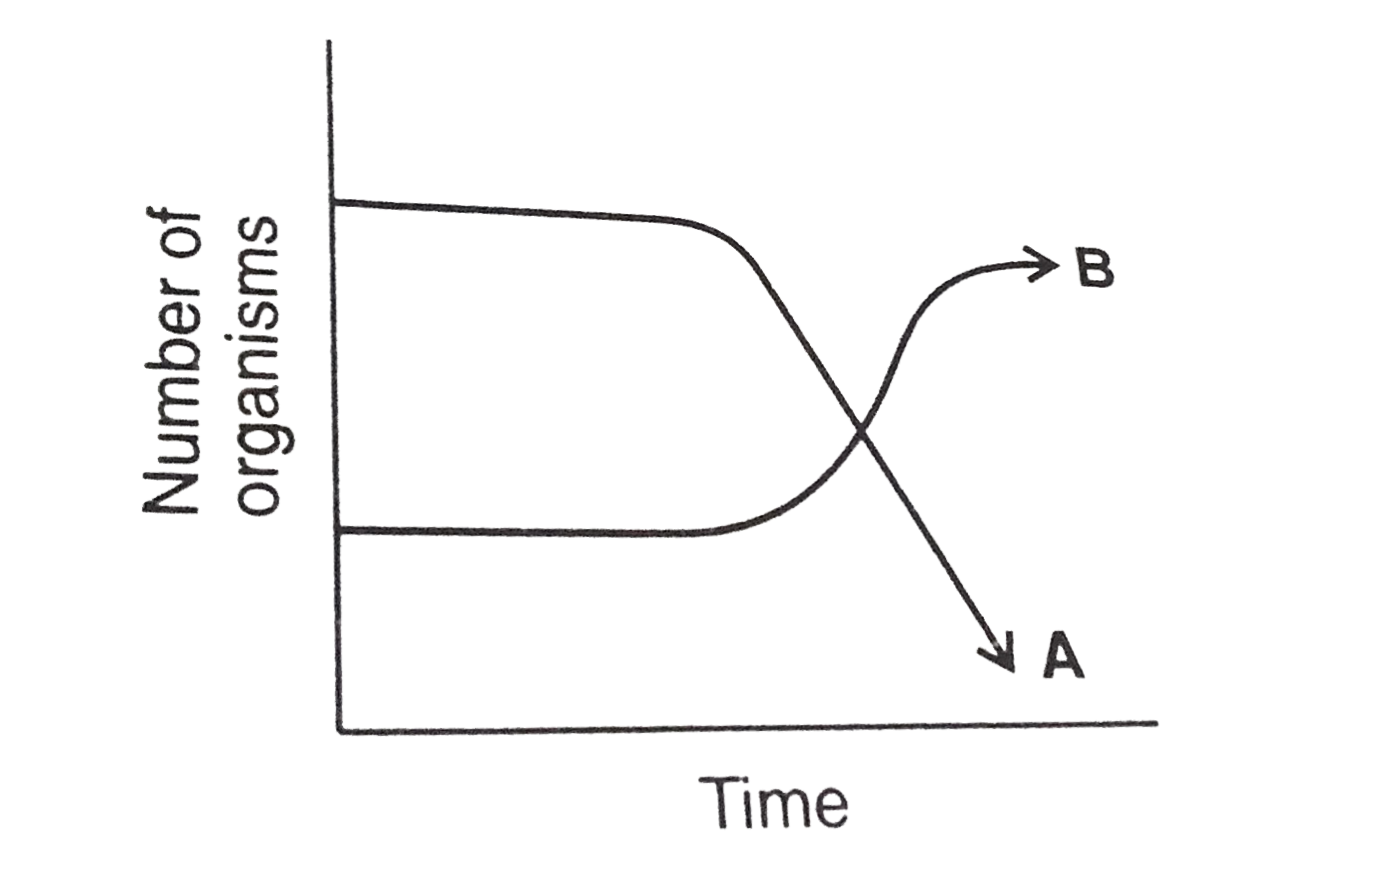
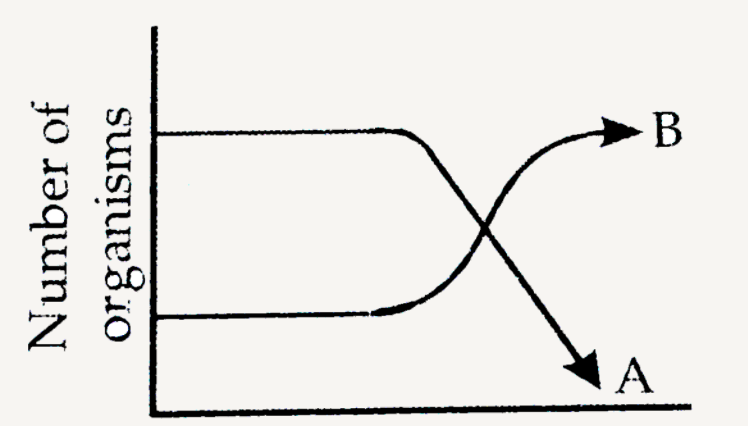
The following graph depicts changes in two populations A and B of herbivores in a grassy field. A possible reason for these changes is that
 Solution in Telugu
Popuation A consumed the members of population B
Both plant population in this habitat decreased
Population B competed more successfully for food than population A
Population A produced more offspring than population B
The correct Answer is:C
Step by step video & image solution for The following graph depicts changes in two populations A and B of herbivores in a grassy field. A possible reason for these changes is that by Biology experts to help you in doubts & scoring excellent marks in Class 11 exams.
Updated on:21/07/2023Topper's Solved these Questions
- ECOSYSTEMBOOK - AAKASH SERIESCHAPTER - ECOSYSTEMEXERCISE - EXERCISE-II (ECOSYSTEM SERVICES)
11 Videos
- CELL CYCLE AND CELL DIVISIONBOOK - AAKASH SERIESCHAPTER - CELL CYCLE AND CELL DIVISIONEXERCISE - Exercise-III
18 Videos
- ENVIRONMENTAL ISSUESBOOK - AAKASH SERIESCHAPTER - ENVIRONMENTAL ISSUESEXERCISE - Exercise-III (Previous AIPMT/NEET Questions)
41 Videos
Similar Questions
Cultural services are
View SolutionWhich of the following options gives the correct sequences of events during mitosis?
View SolutionWhich of the following in sewage treatment removes suspended solids ?
View SolutionThe following graph depicts changes in two populations (A and B) of herbivores in a grassy field. A possible reason for these changes is that :
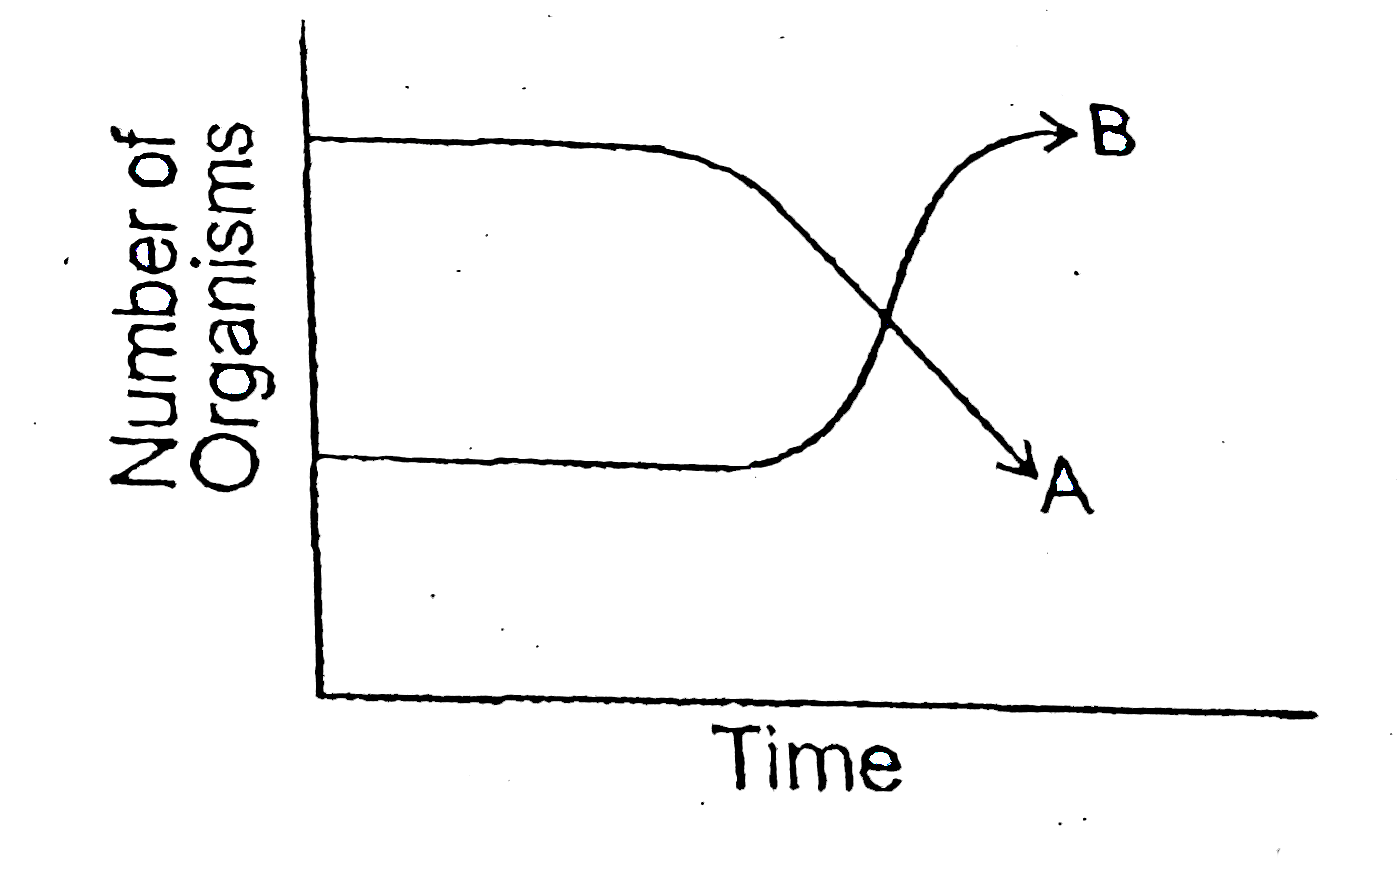
View SolutionThe graph below shows the changes in two populations of herbivores in a grassy field. A possible reason for these changes is that

View SolutionThe following graph depicts changes in two populations (A and B) of herbivores in a grassy field. A possible reason for these changes is that
View SolutionWhich of the following graphs best depicts the changes in one cycle of PCR ?
View Solutionनिम्नलिखित ग्राफ एक घासीय मैदान में शाकाहारियों समष्टियों ( और ) में होने वाले परिवर्तनों को बताता है परिवर्तनों का सम्भावी कारण है कि
View Solutionनिम्नलिखत ग्राफ एक घासीय मैदान में शाकाहारयों की दो | समष्टियों (A और B) में होने वाले परिवर्तनों को बताता हैं। इन परिवर्तनों का संभावी कारण है कि :
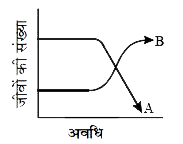
View SolutionThe following graph depicts changes in two populations (A and B) of herbivores in a grassy field. A possible reson for these changes is that
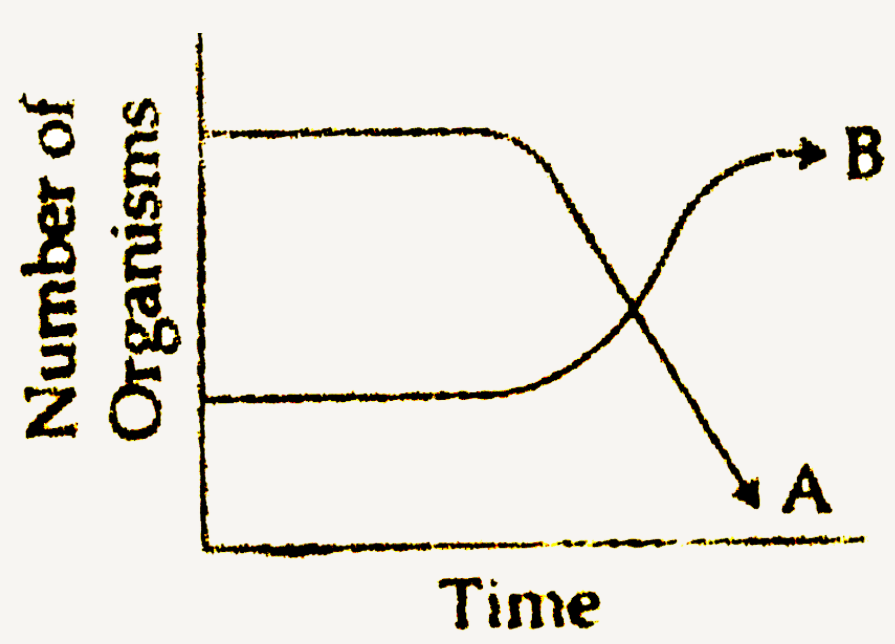
View SolutionThe following graph depicts changes in two populations (A and B) of herbivores in a grassy field A possible reason for these changes is that
View SolutionThe following graph depicts changes in two populations A and B of herbivores in a grassy field. A possible reason for these changes is that

View SolutionThe following graph depicts changes in two populations (A and B) of herbivores in a grassy field. A possible reason for these changes is that

View SolutionThe following graph depicts changes in two populations (A and B) of herbivores in a grassy field. A possible reason for these changes is that

View SolutionThe following graph depicts changes in two populations (A and B) of herbivores in a grassy field. A possible reson for these changes is that

View SolutionThe following graph depicts changes in two populations (A and B) of herbivores in a grassy field A possible reason for these changes is that

View Solution
