The following graph depicts changes in two populations (A and B) of herbivores in a grassy field. A possible reason for these changes is that
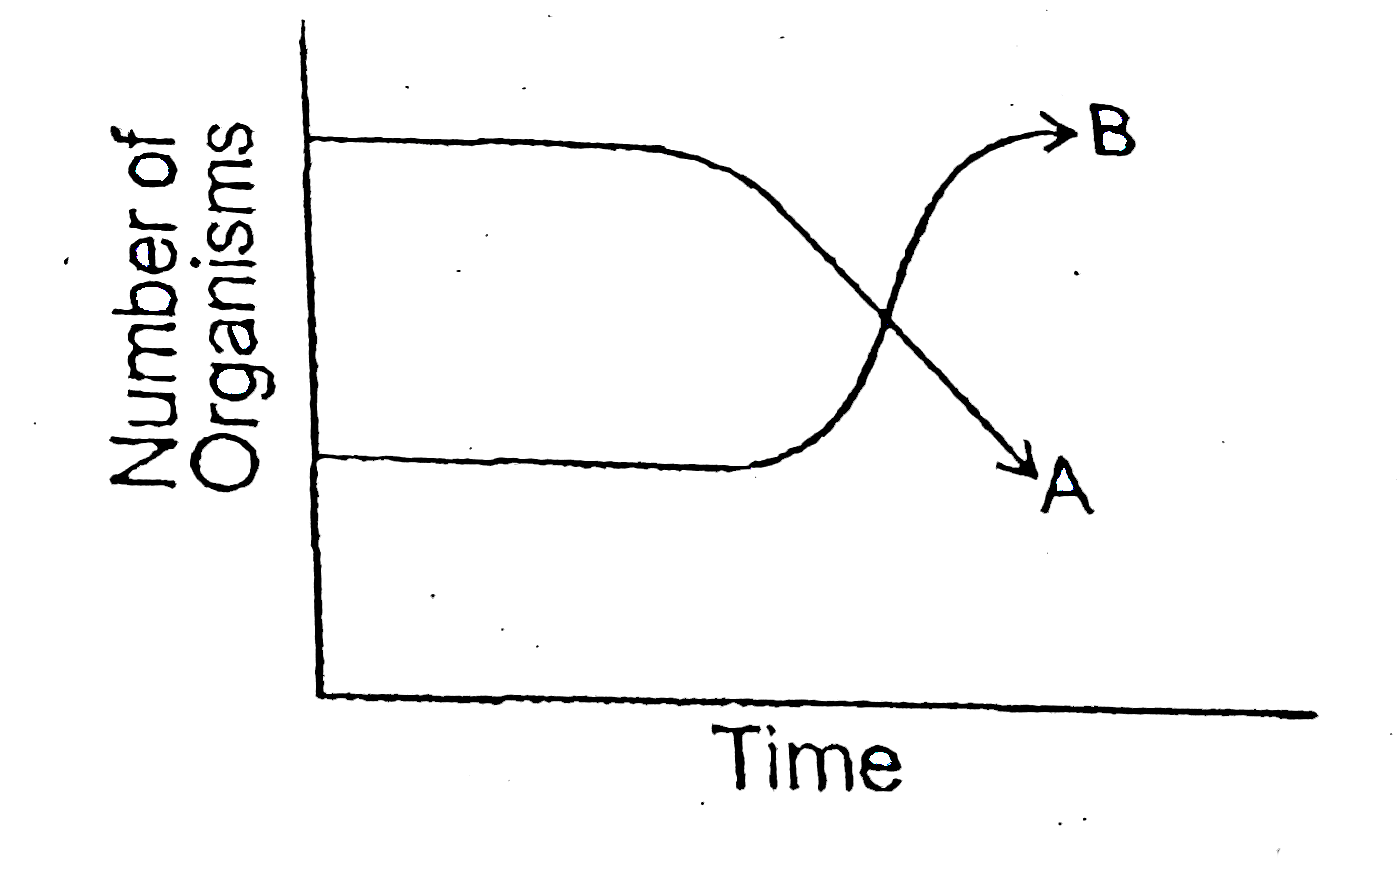
Population A produced more offspring than population B
Population A consumed the members of population B
Both plant populations in this habitat decreased
Population B competent more successfully for food than population A
The correct Answer is:D
Step by step video, text & image solution for The following graph depicts changes in two populations (A and B) of herbivores in a grassy field. A possible reason for these changes is that by Biology experts to help you in doubts & scoring excellent marks in Class 12 exams.
Updated on:21/07/2023Similar Questions
Knowledge Check
Changing population is -
APopulation growthBPopulation dynamicsCPopulation explosionDPopulation ethologyWhich of the following graphs best depicts the changes in one cycle of PCR ?
A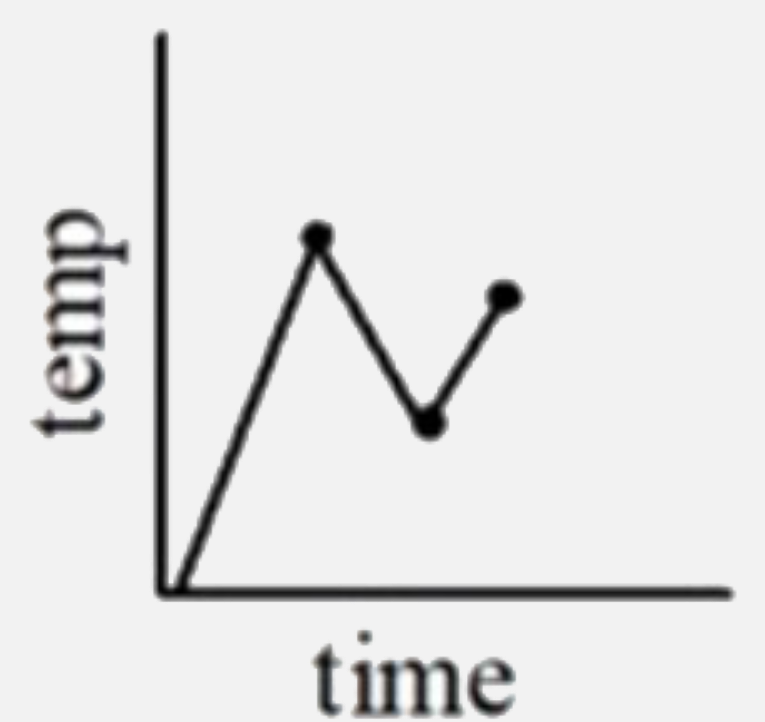 B
B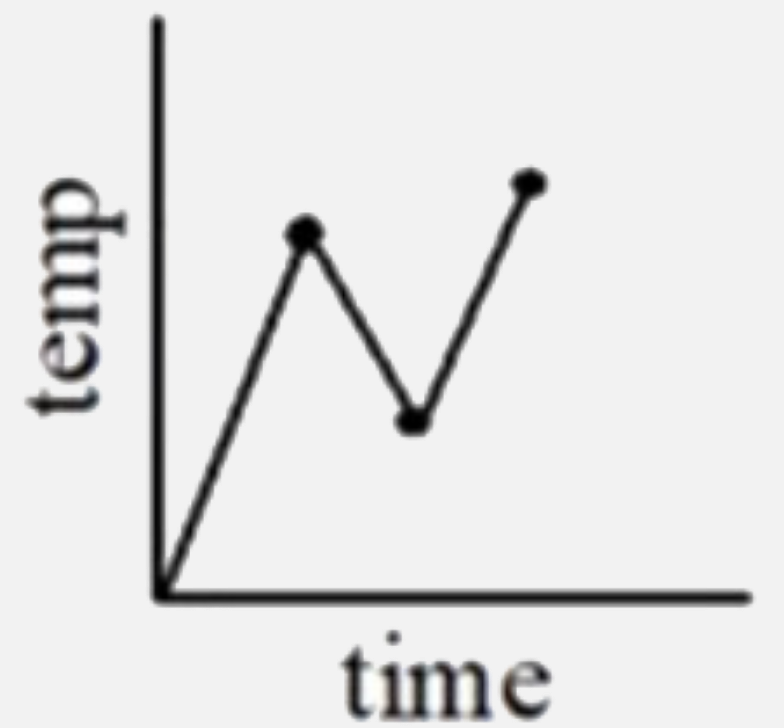 C
C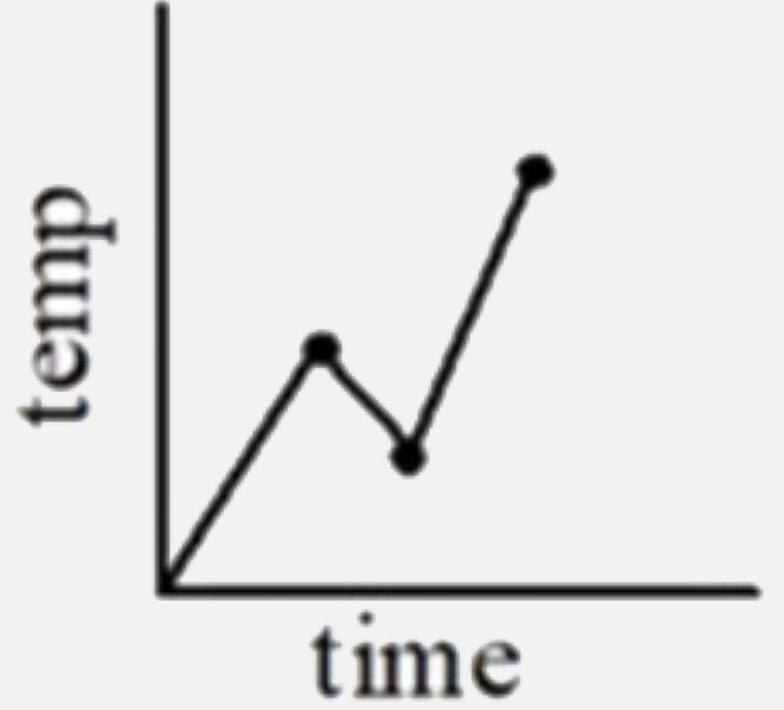 D
D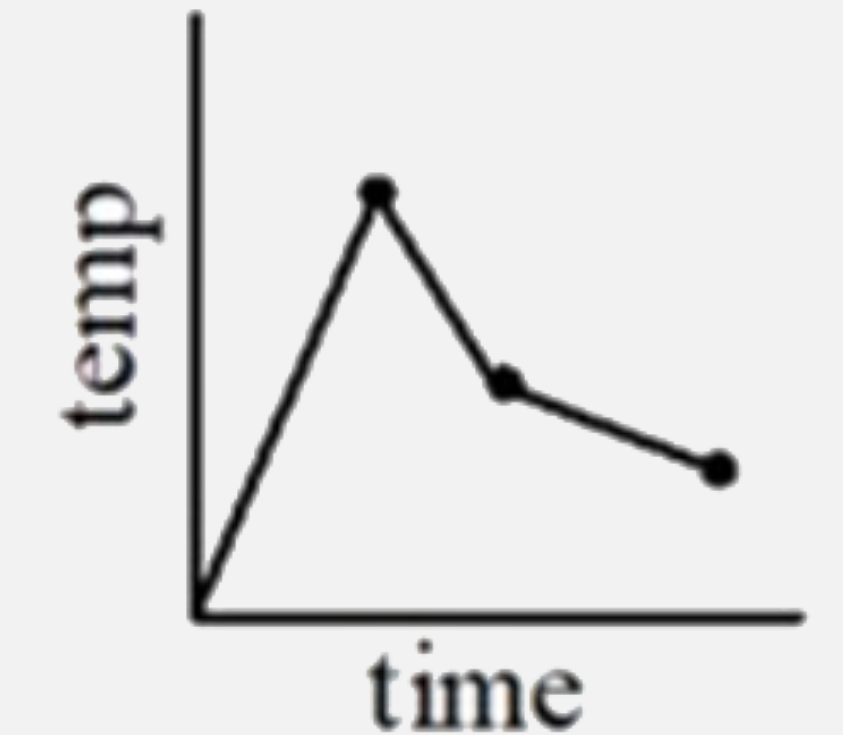
The reason for the change in shape of a regular body is
AVolume stressBShearing strainCLongitudinal strainDMetallic strain
The following graph represents enzyme activity with changing

View SolutionGive the determinants of population change?
View SolutionGive the formula for the change in population size .
View SolutionHow is migration a determinant of population change?
View SolutionThe accompanying figure depicts a change in concentration of species A and B for the reaction A→B, as a function of time. The point of inter section of the two curves represents

View Solution

